A user-centric approach to aligning outcomes to solutions.
The title block: the workshop room in Istanbul, at the ecosystem map on the wall. The practice put design at the front of GE Digital's commercial engagements, in industries new to the company.
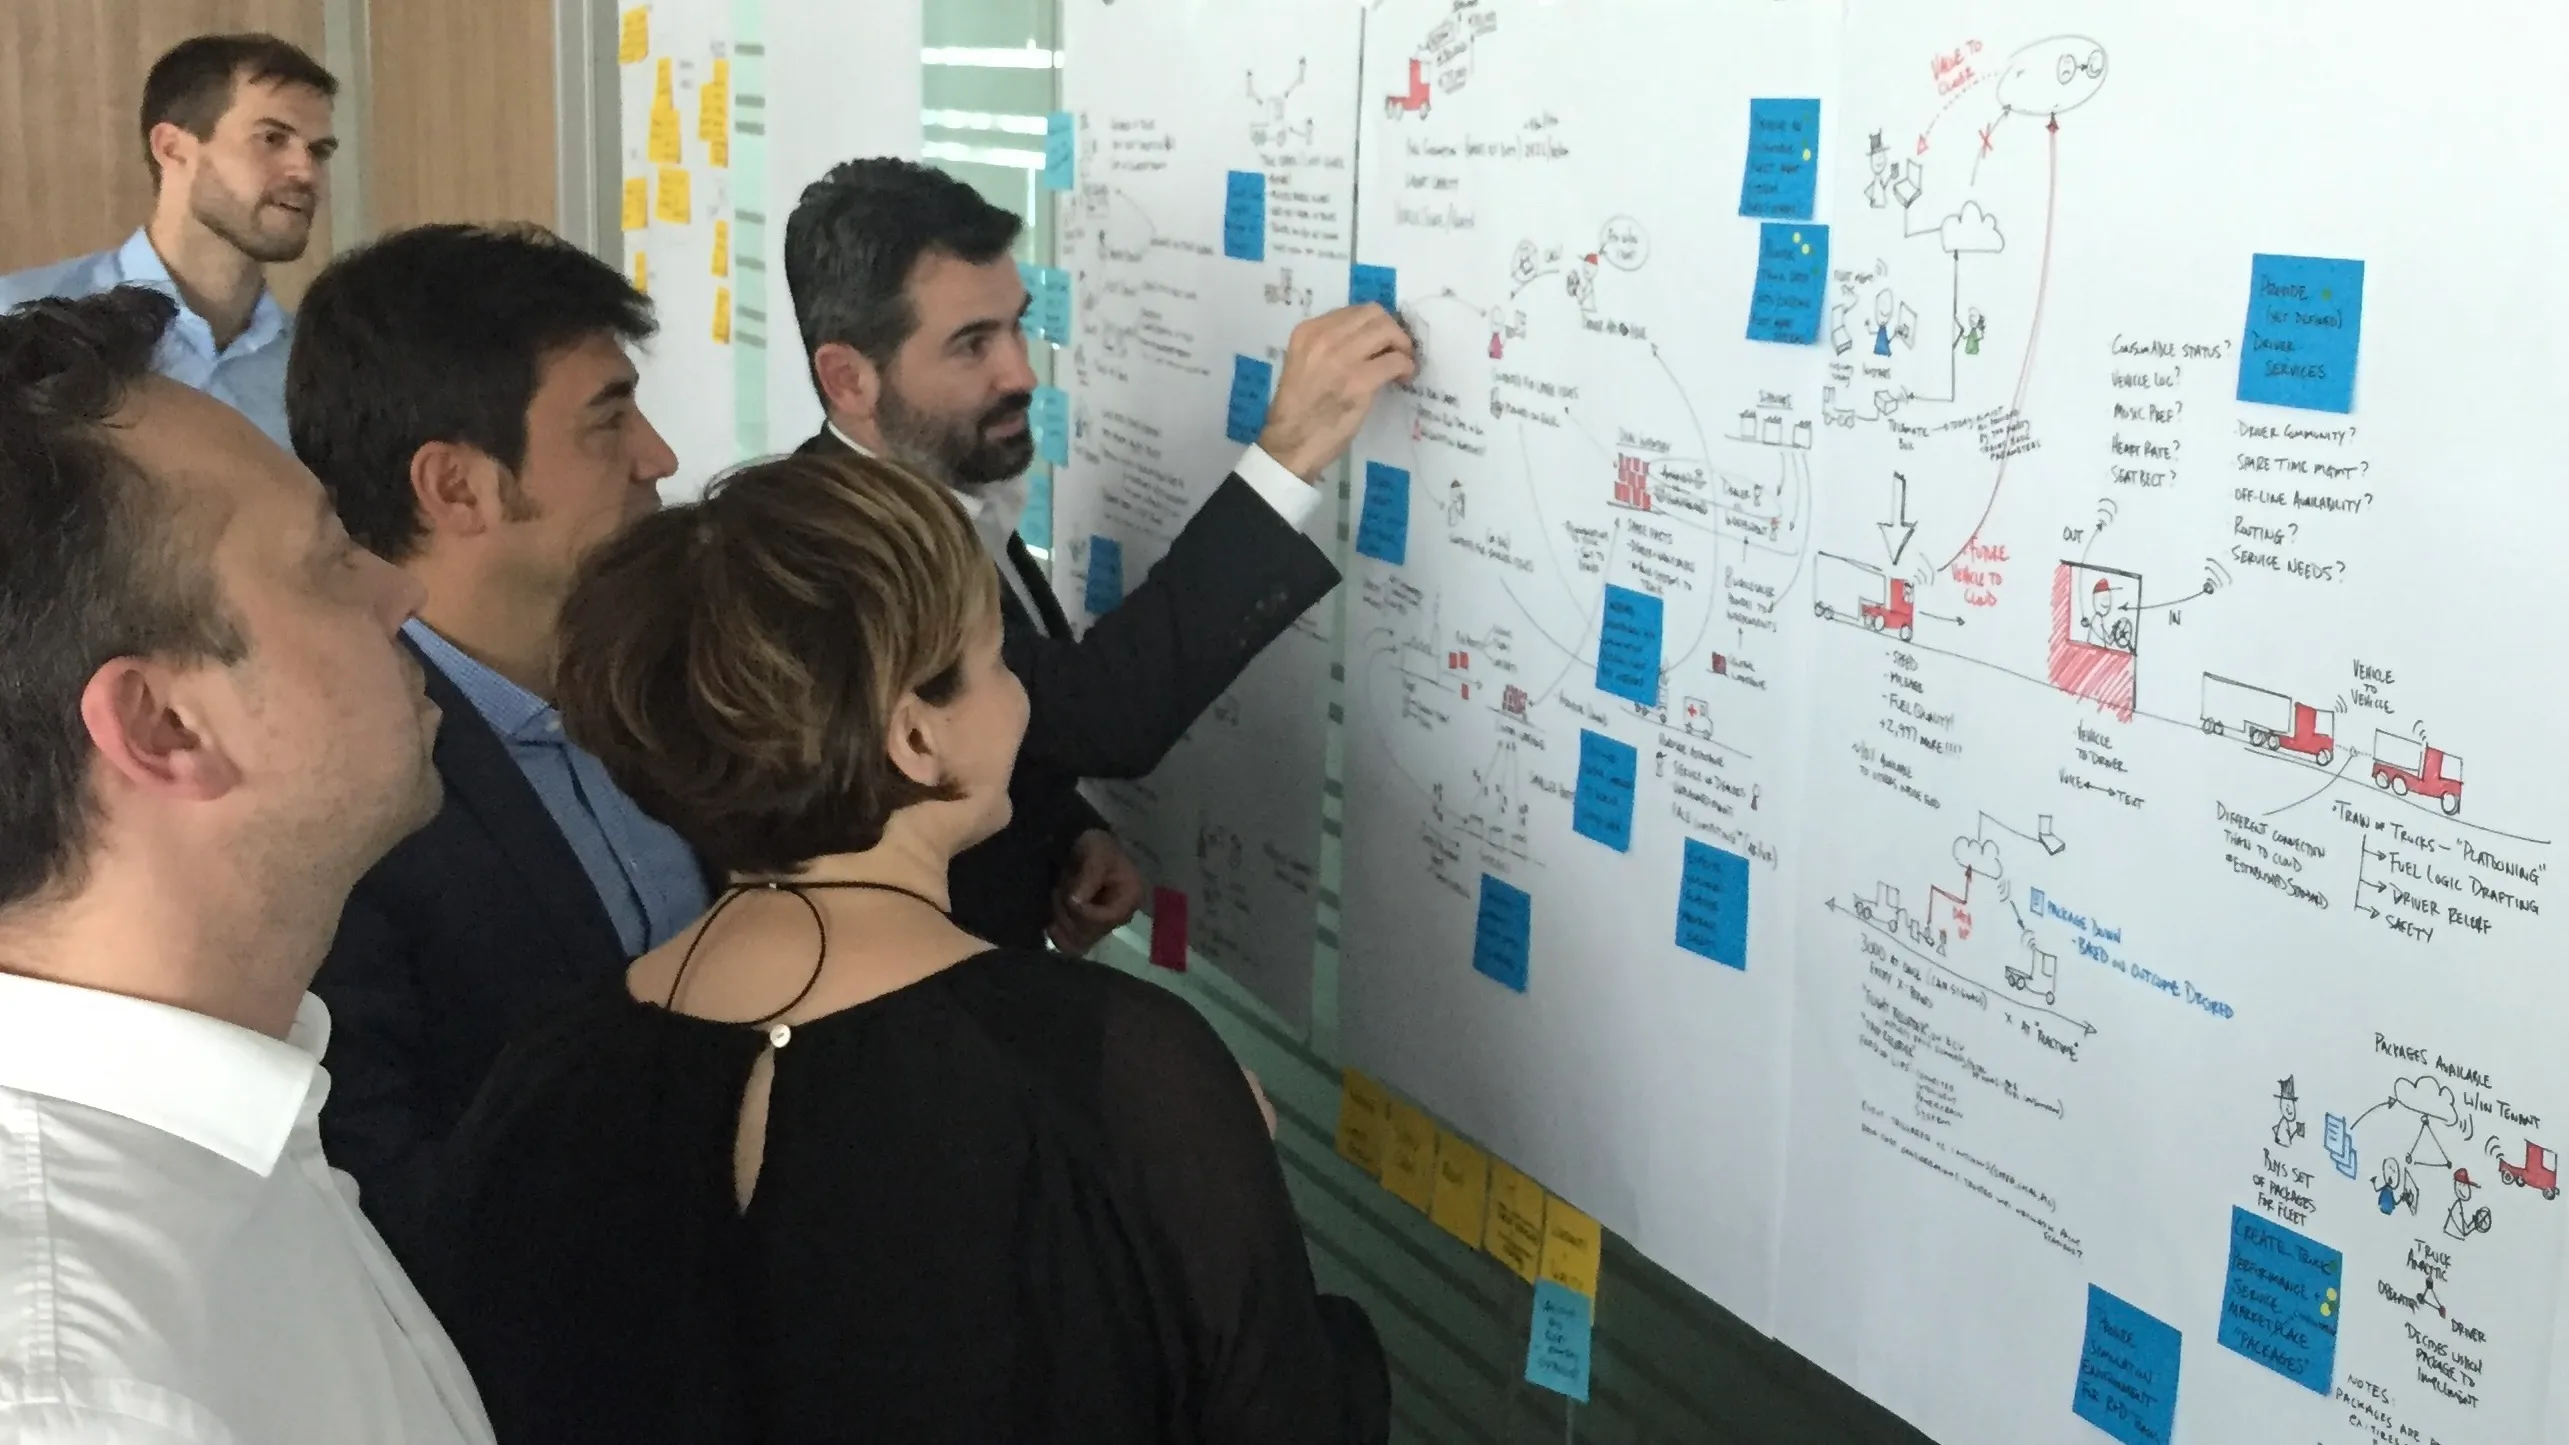
Operations Co-Creation
In 2015 GE Digital formed an Emerging Verticals team to take the Predix industrial IoT platform into industries outside of GE's core: Automotive, telecommunications, heavy equipment, and food & beverage, for example. With the platform lacking mature applications to position, discovery had to happen with customers in their work environments before anything could be proposed. I led experience design for the team and built a participatory discovery practice around “Ecosystem Mapping,” a structured session focusing on the people, things, and environments of an operation, their connections, and pains. This method mapped use cases with high context, identified and prioritized by those in the room. I hired and trained the researchers & designers, taught them the method, and codified it in a playbook. Each engagement resulted in a synthesized report returned to the customer, so what we learned fed both the proposal and the product. A double loop, per Chris Argyris's work. Through 2017 the practice ran 60+ workshops in 18 countries, brought UX into pre-sales, and influenced over $100MM of SaaS. It taught me that on-site, high-context research yields better data and deeper empathy than a purpose-built studio, and that methods must flex to the nuances of the culture.
Business focus
GE's three established verticals, energy, aviation and healthcare, set beside the emerging verticals my team was formed to open: automotive, telecommunications, heavy equipment, food and beverage. It frames the business problem: a platform built on GE's own industries, and a mandate to take it elsewhere.
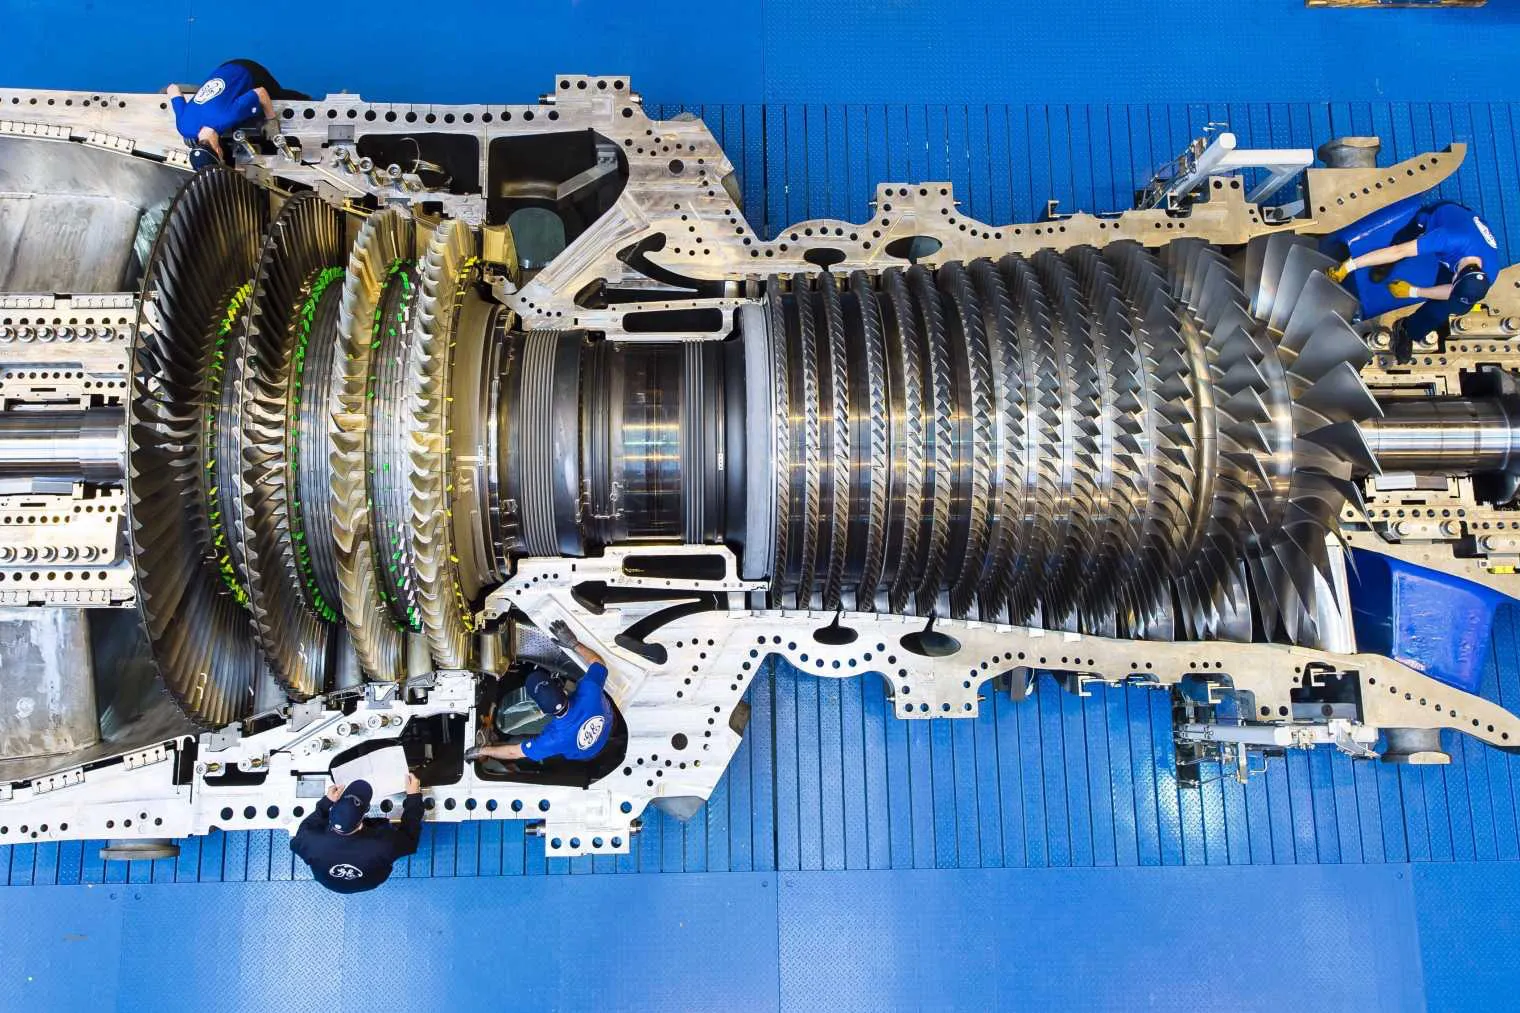
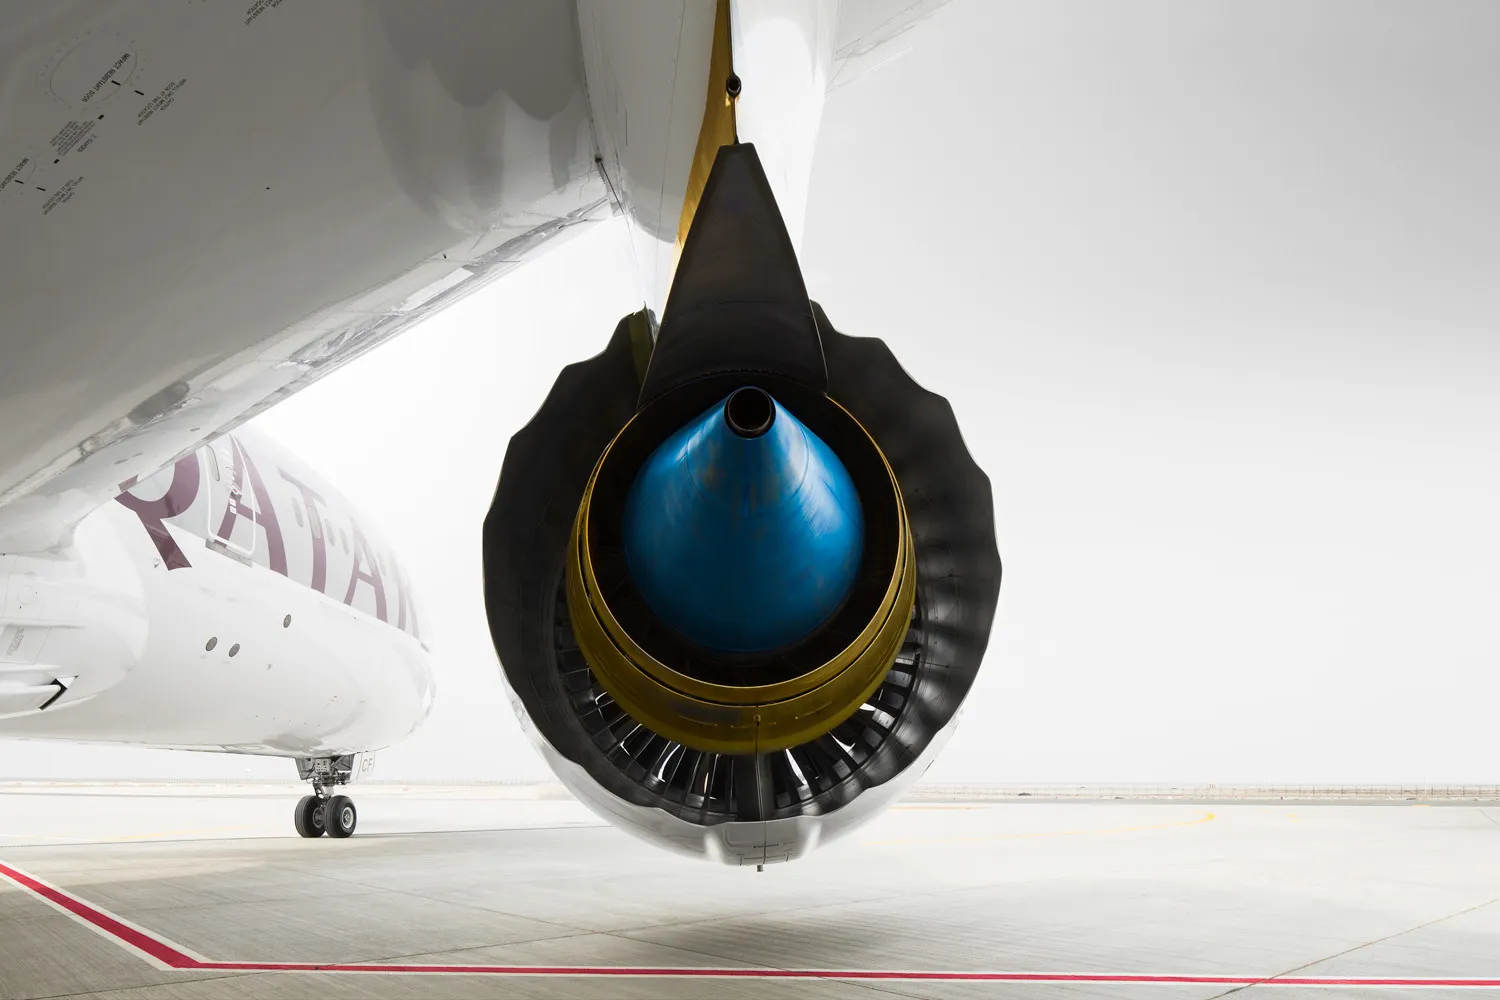
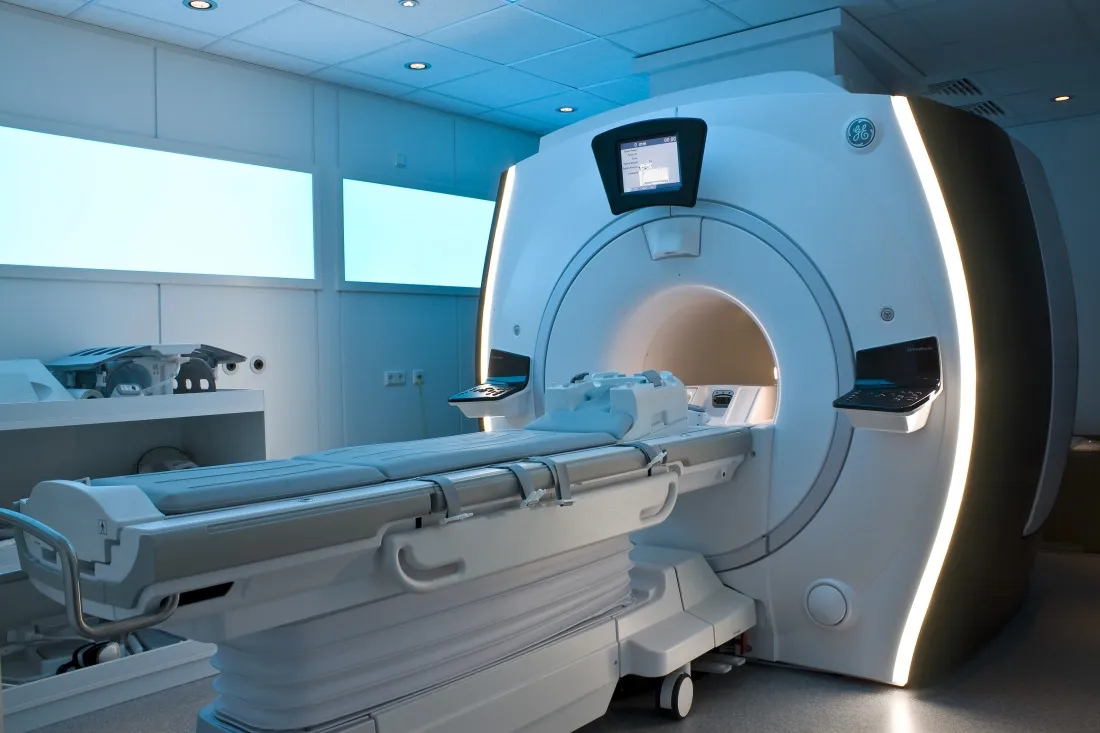
Emerging Verticals
- Automotive
- Telecommunications
- Heavy Equipment
- Food & Bev
- etc…
The question the team was set, in its 2022 wording: how to grow GE's industrial IoT platform and product portfolio beyond the verticals GE already knew. Everything that follows is the method we built to answer it.
How might we grow GE’s industrial IoT platform & product portfolio beyond the core businesses and into new and emerging verticals?
Engagement approach
How we placed design in the commercial engagement: before development, at the Qualify, Discover and Proposal stages, so product management and UX could shape opportunities early. This is the structural move the whole practice rests on.
To connect with commercial opportunities, we prefaced our development with the Qualify, Discover, and Proposal stages of a customer engagement. This allowed PM and UX functions to engage early and outline new opportunities to which our design & engineering team could develop and productize.
Chris Argyris's double loop, then the engagement approach redrawn as one path from customer engagement into product development, and the anti-pattern it guards against: a release sent straight back to sales, with discovery skipped.
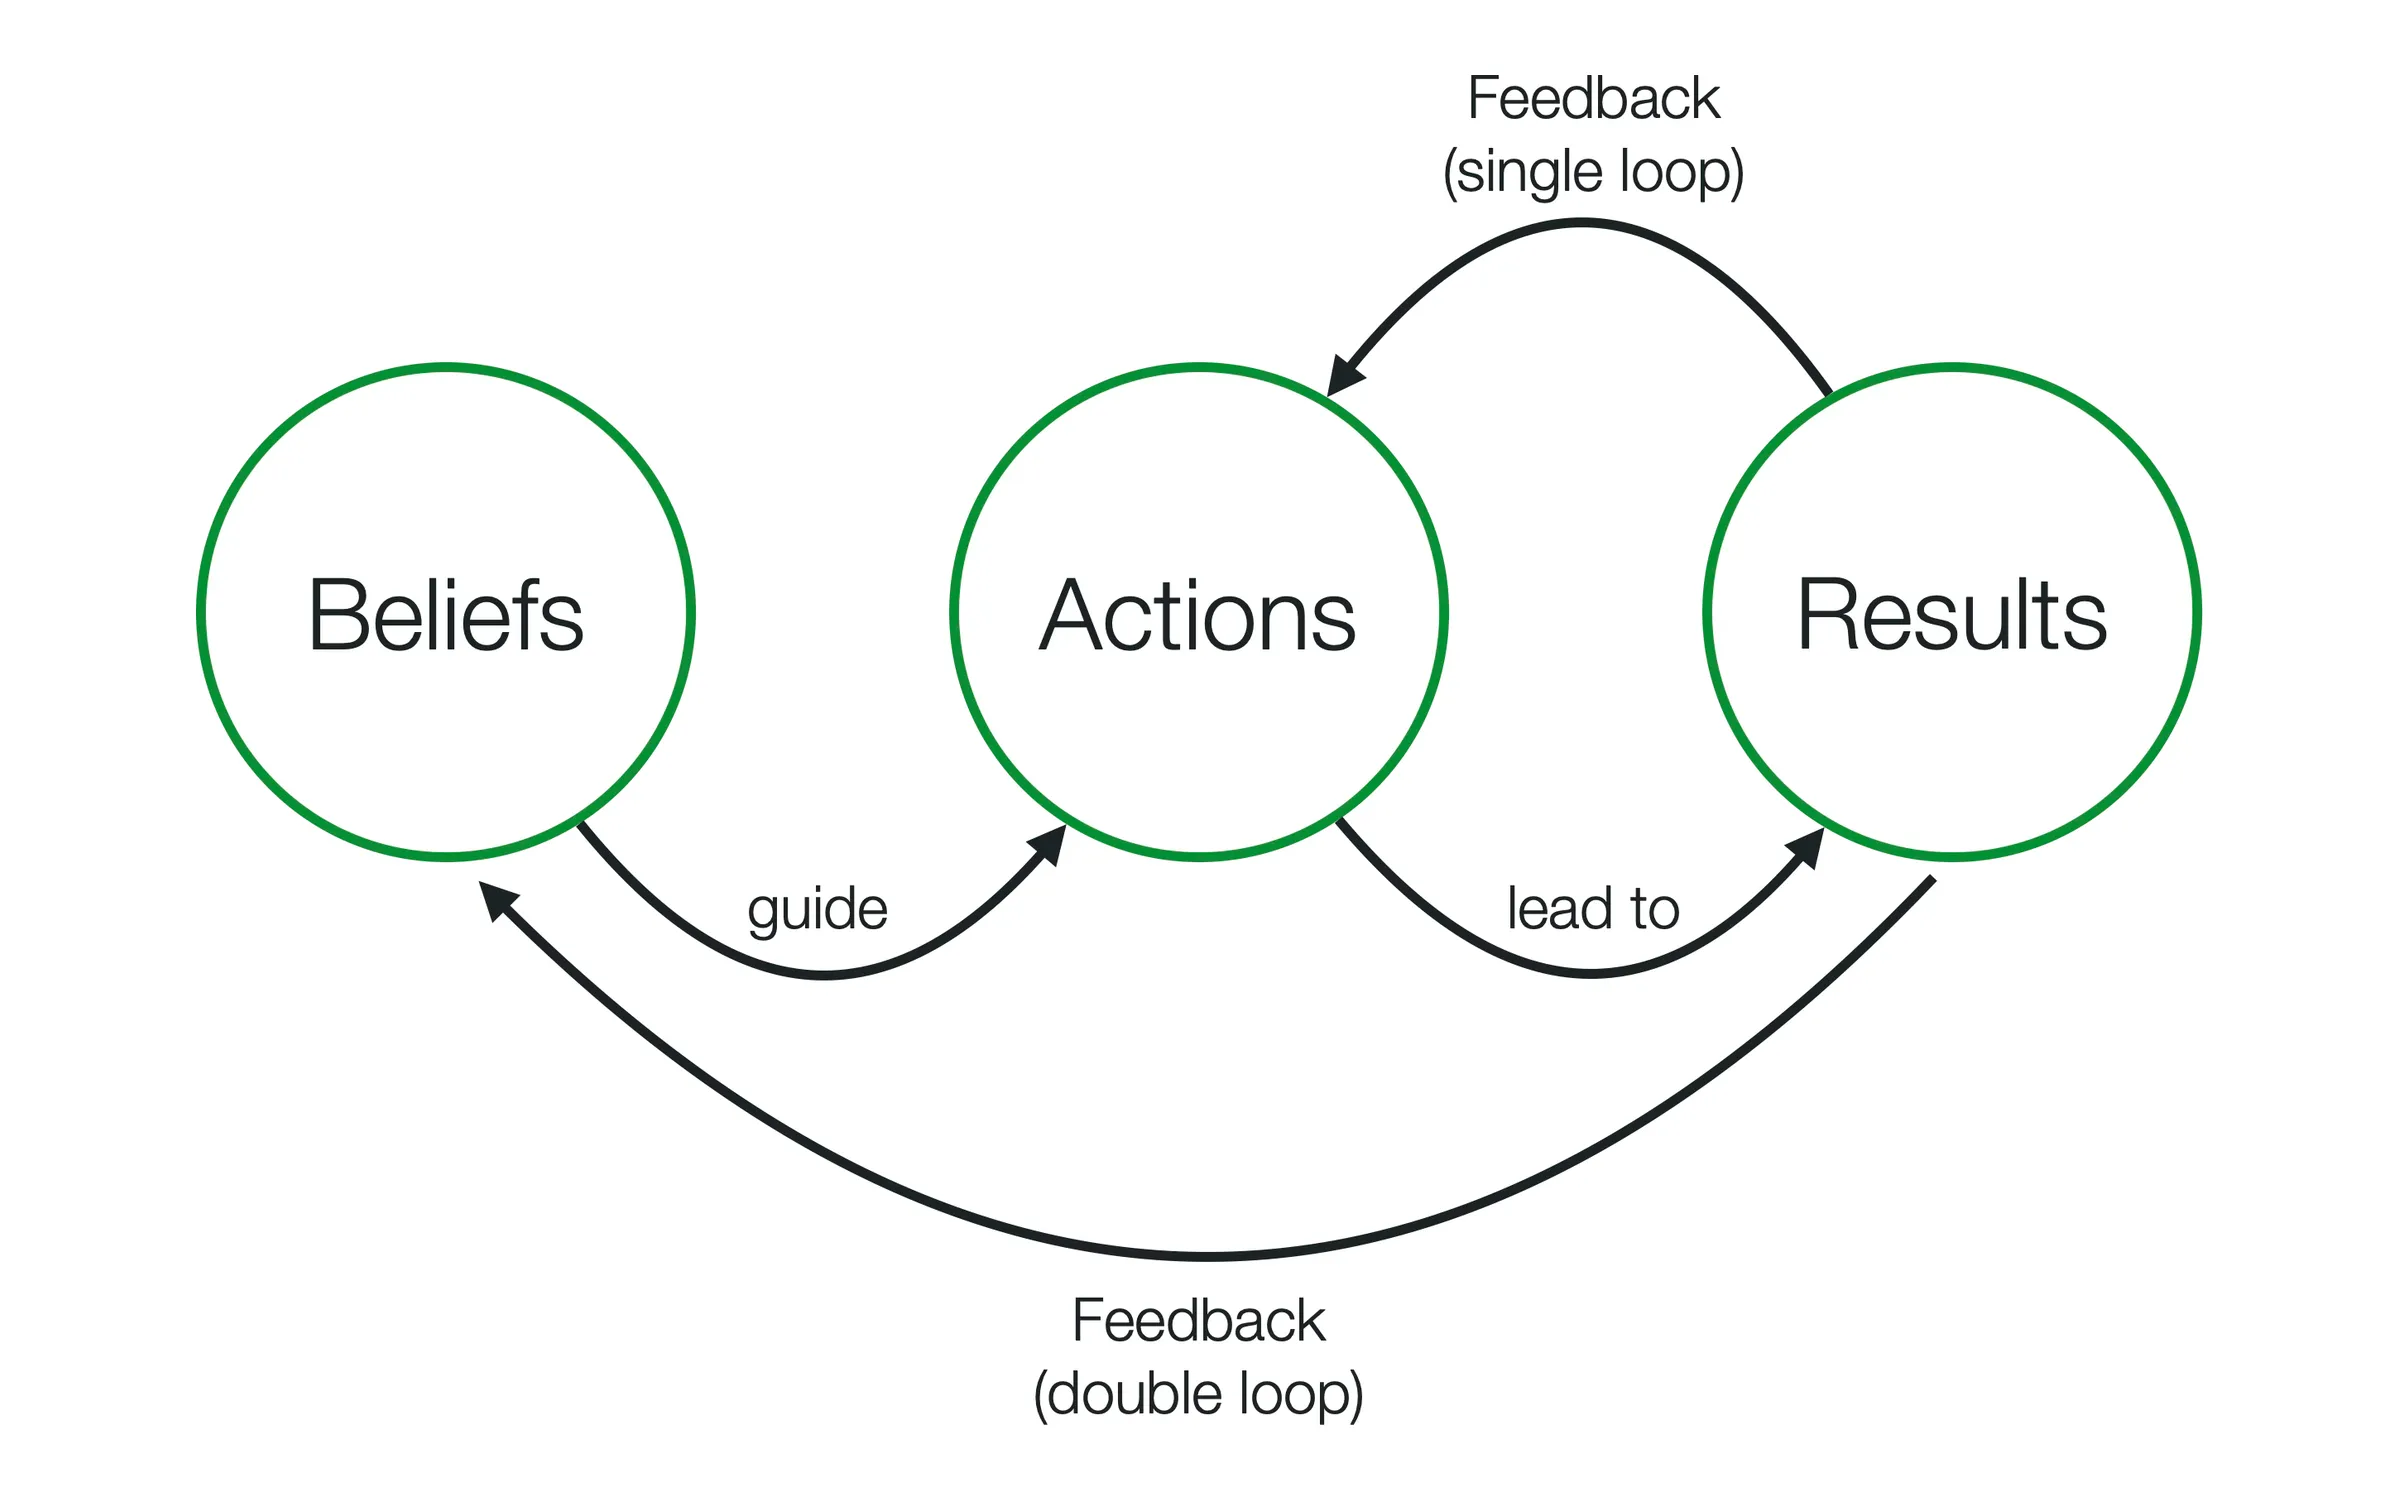
After Chris Argyris, Harvard Business School: “Double Loop Learning in Organizations”, 1977, and “Teaching Smart People How to Learn”, 1991.
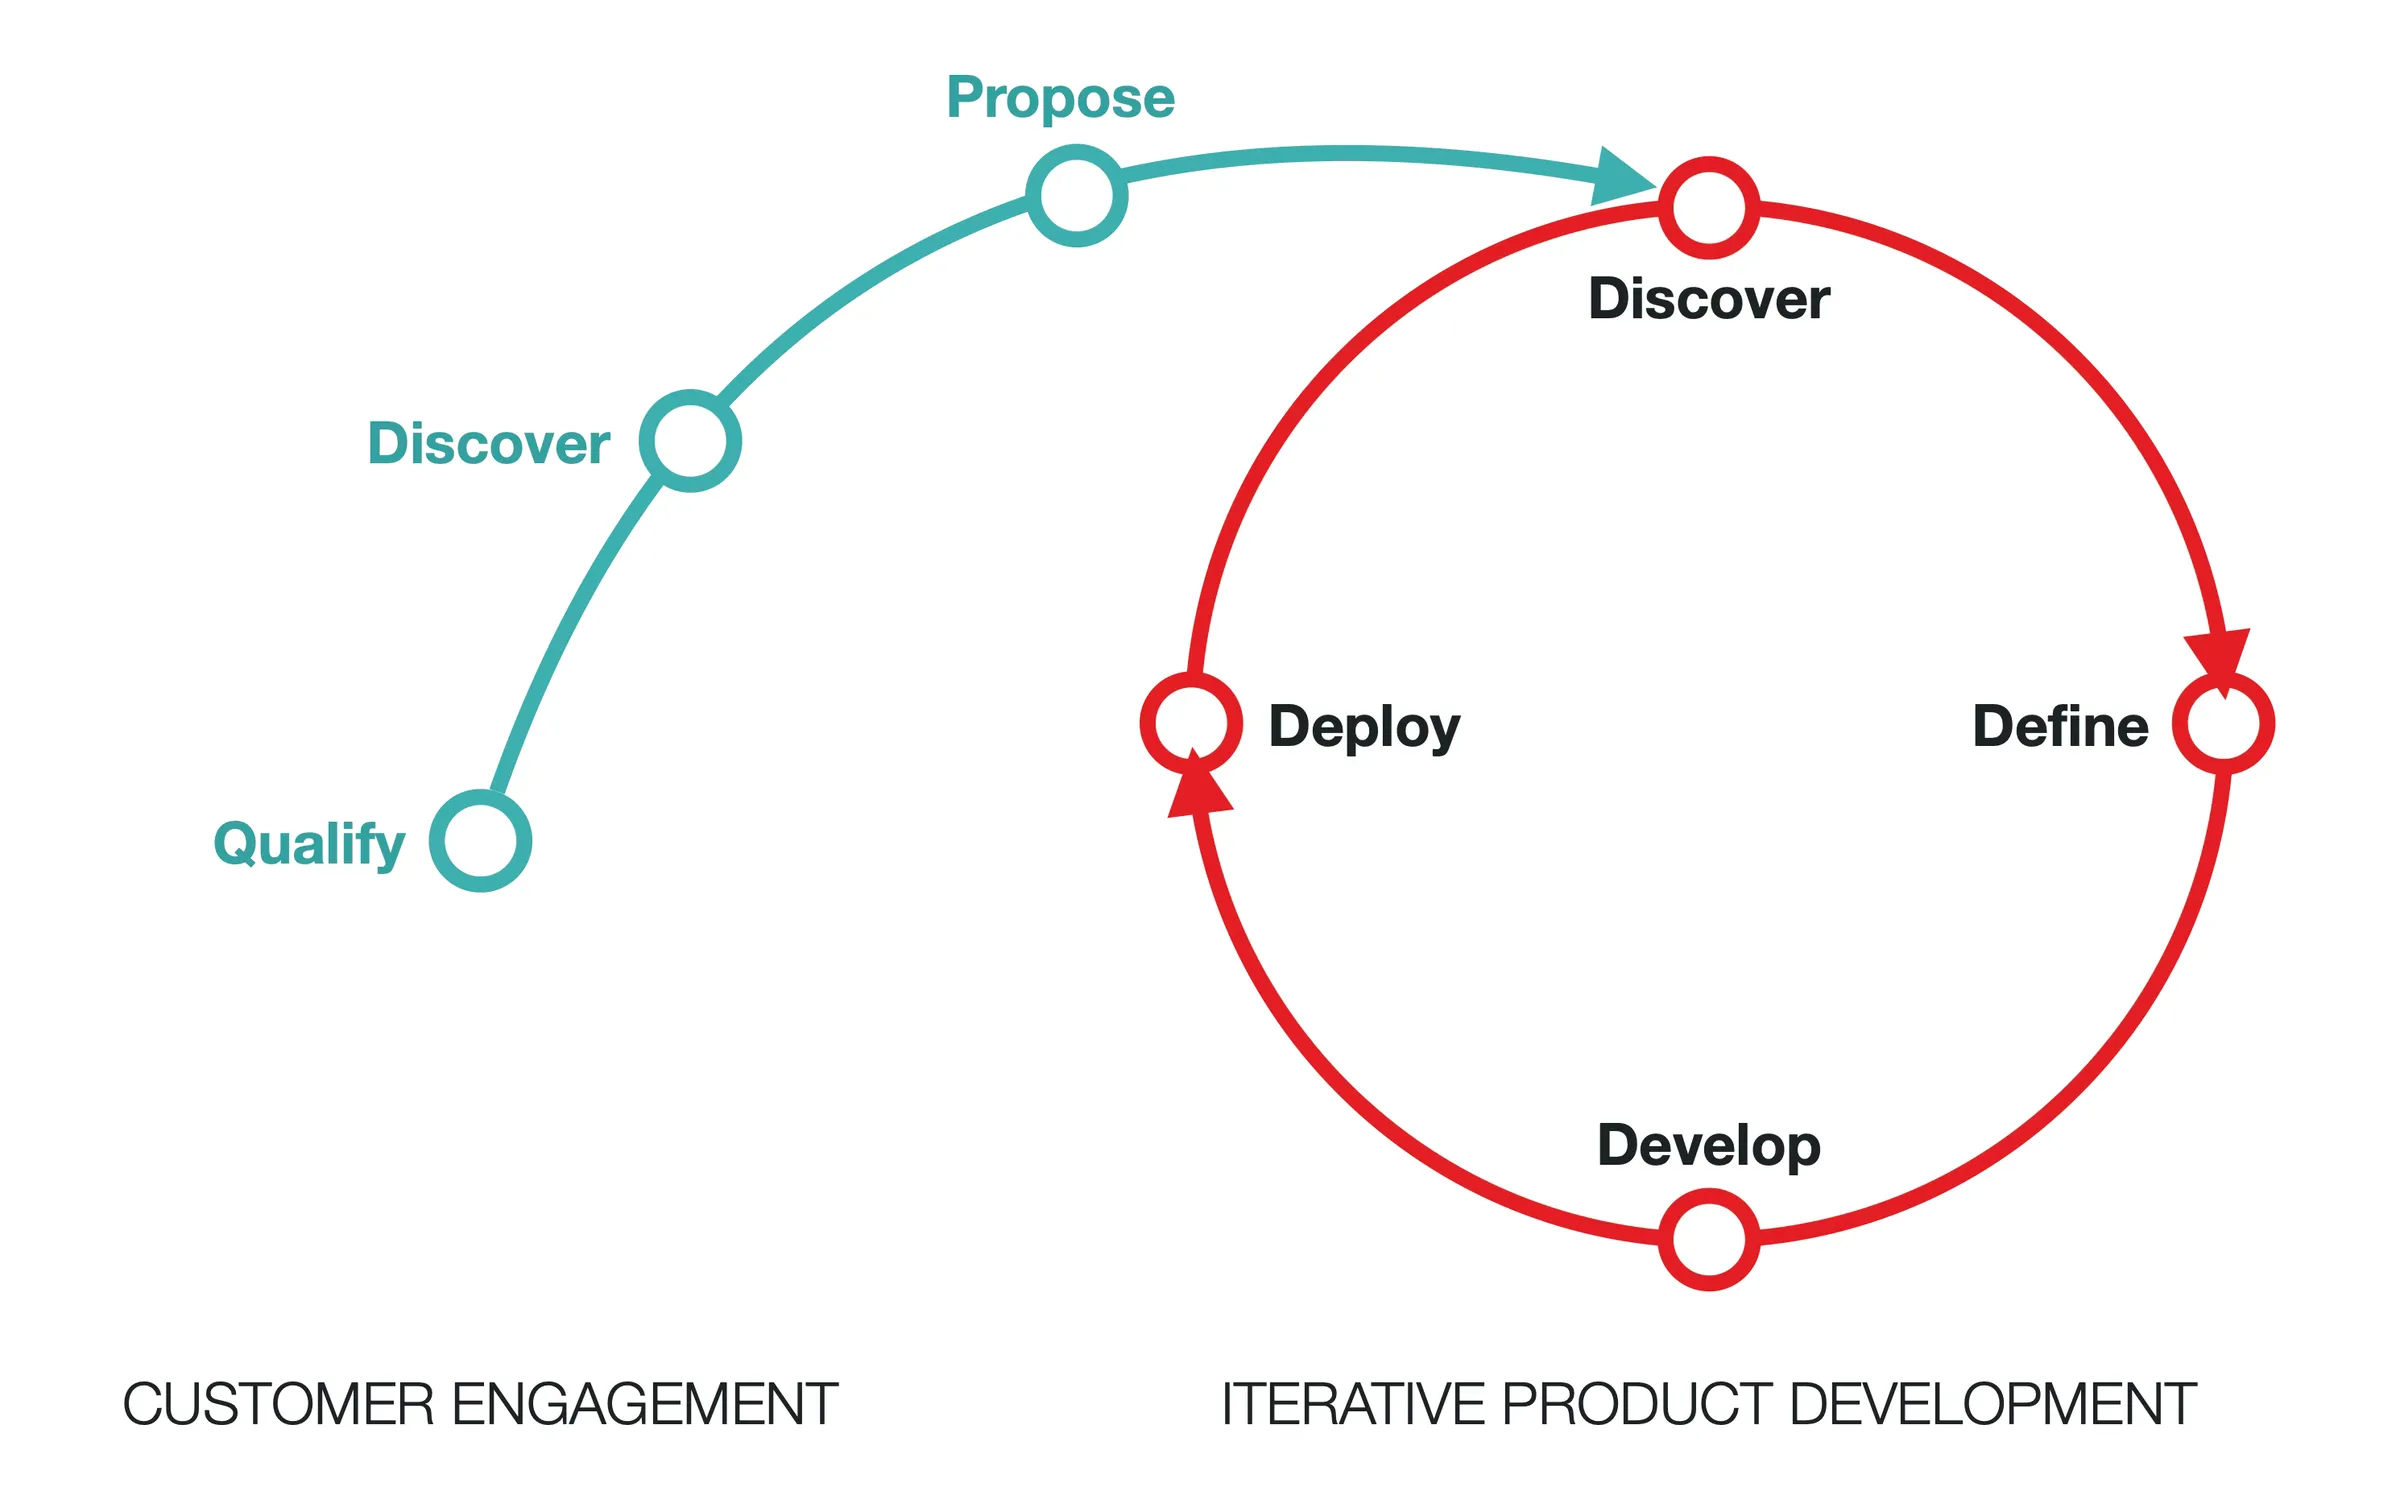
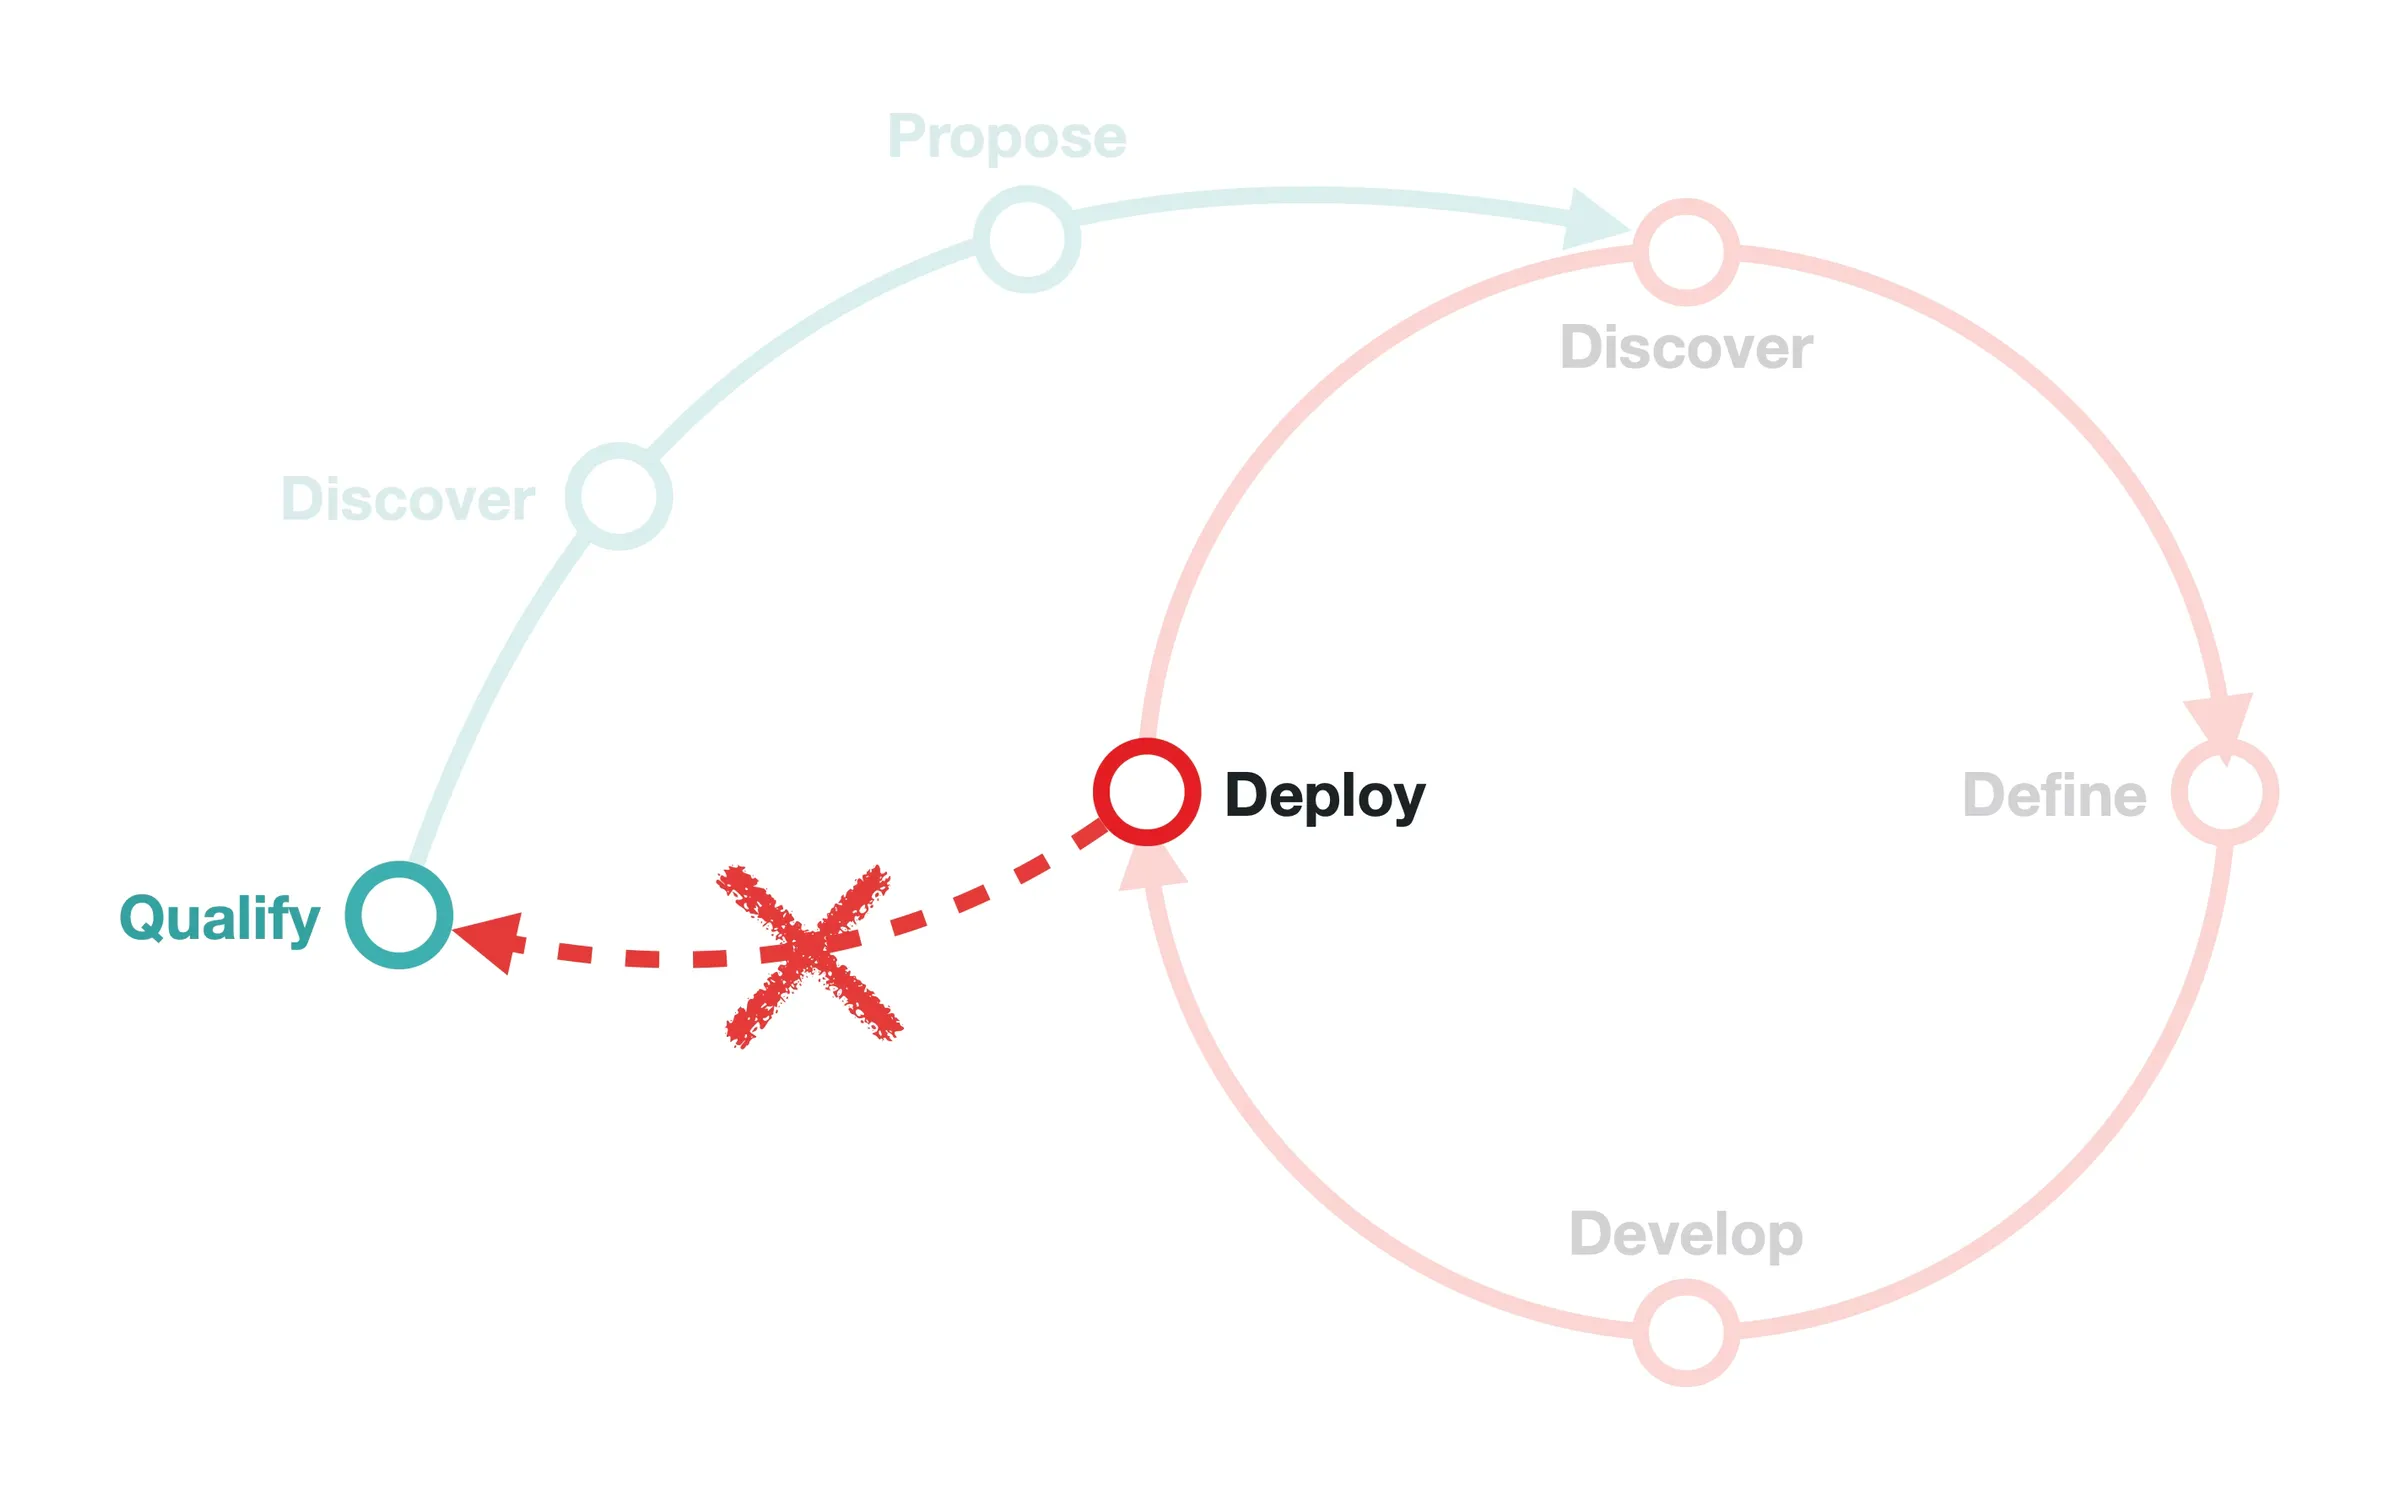
Three readings of the same path: product discovery moved forward into the customer engagement, the proposal drawing on both discovery and what is already deployed, and the double loop laid over the whole.
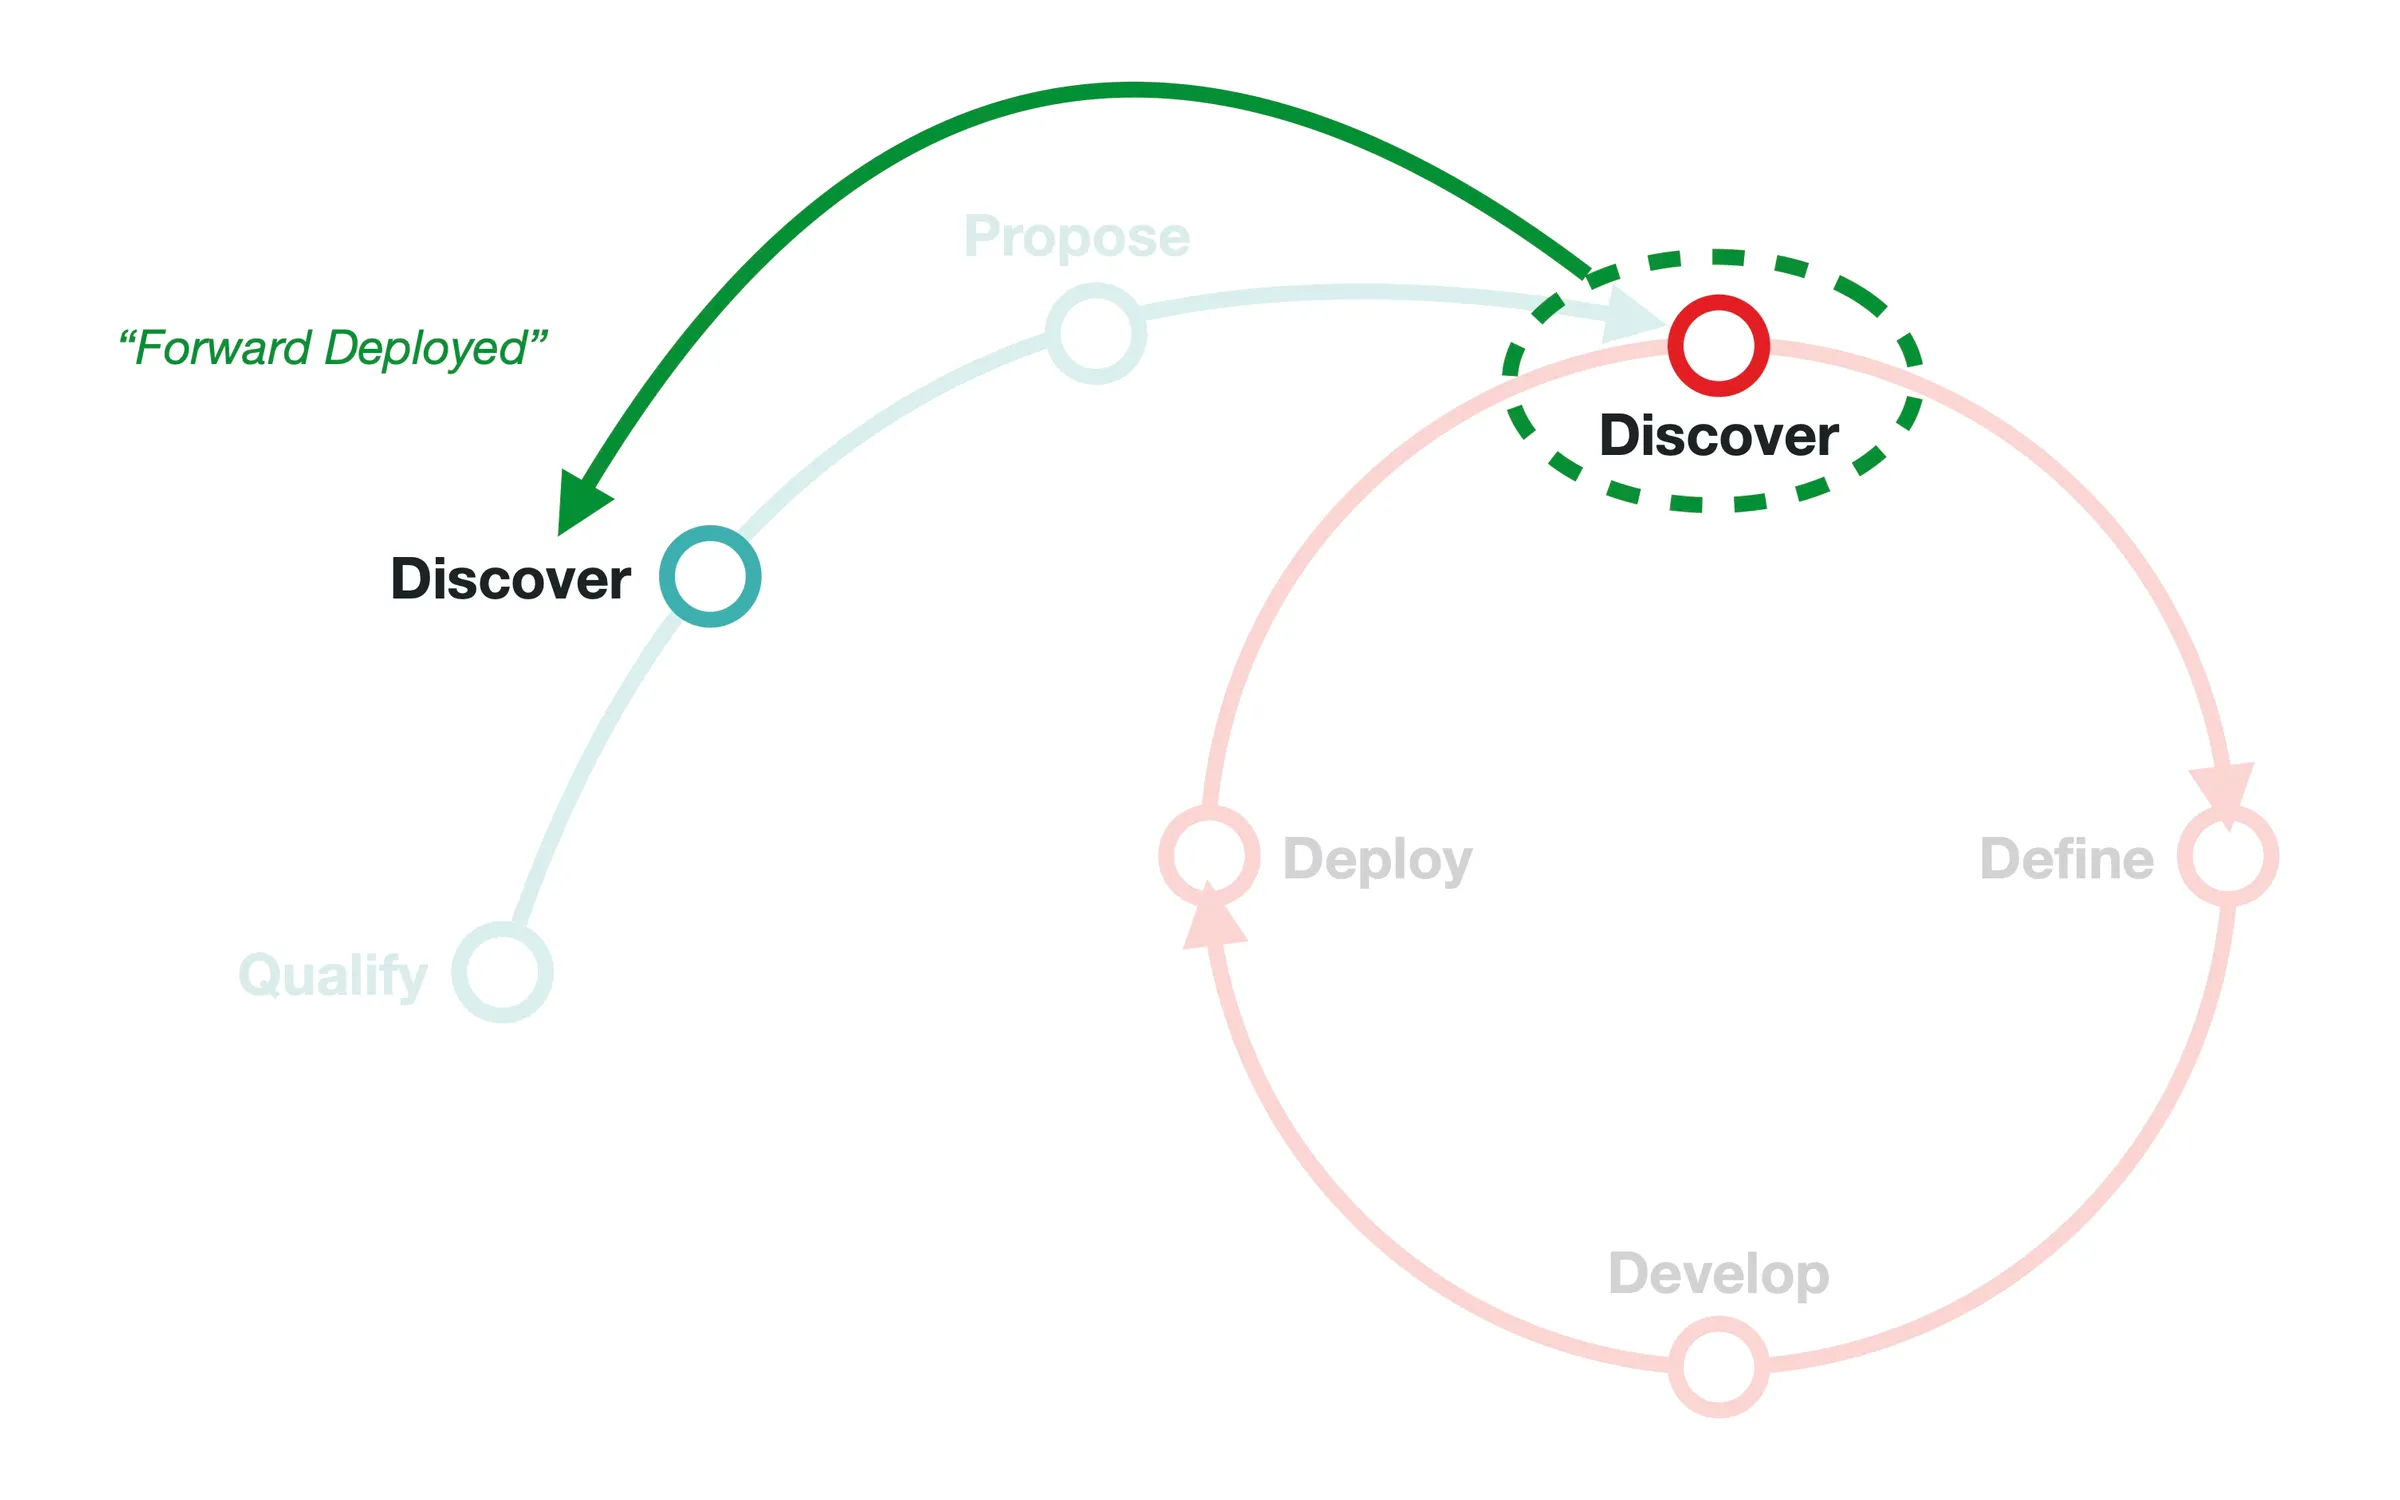
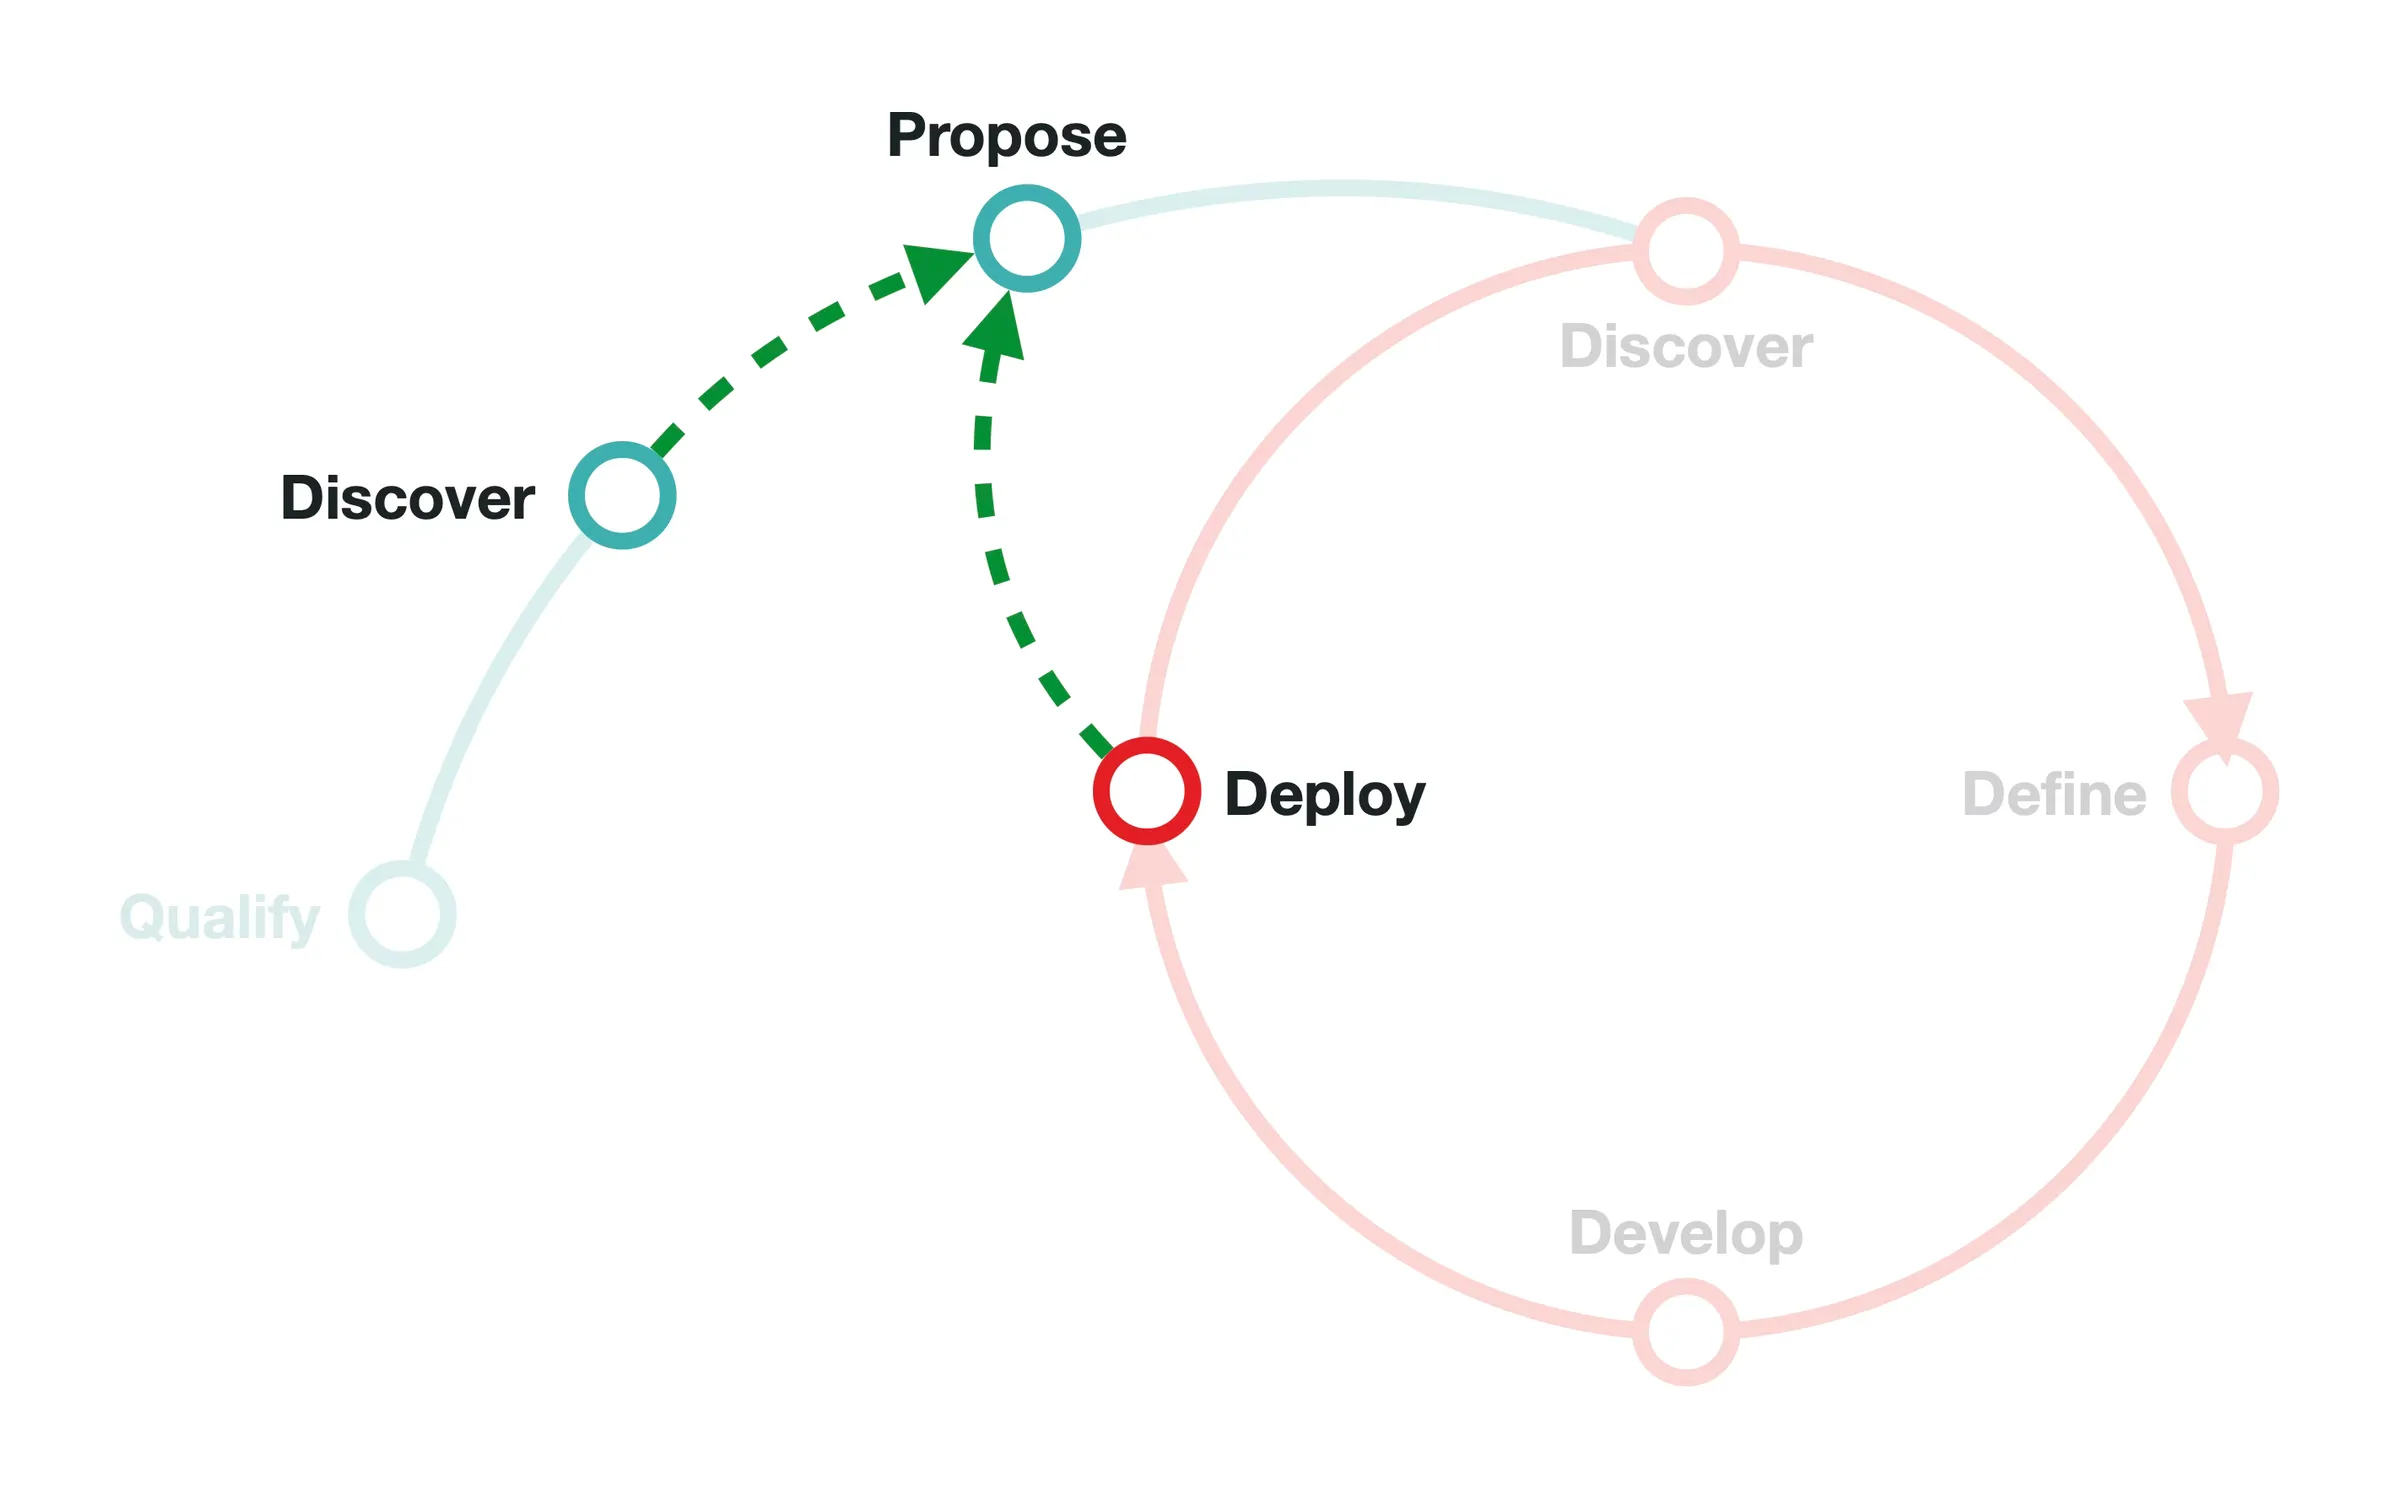
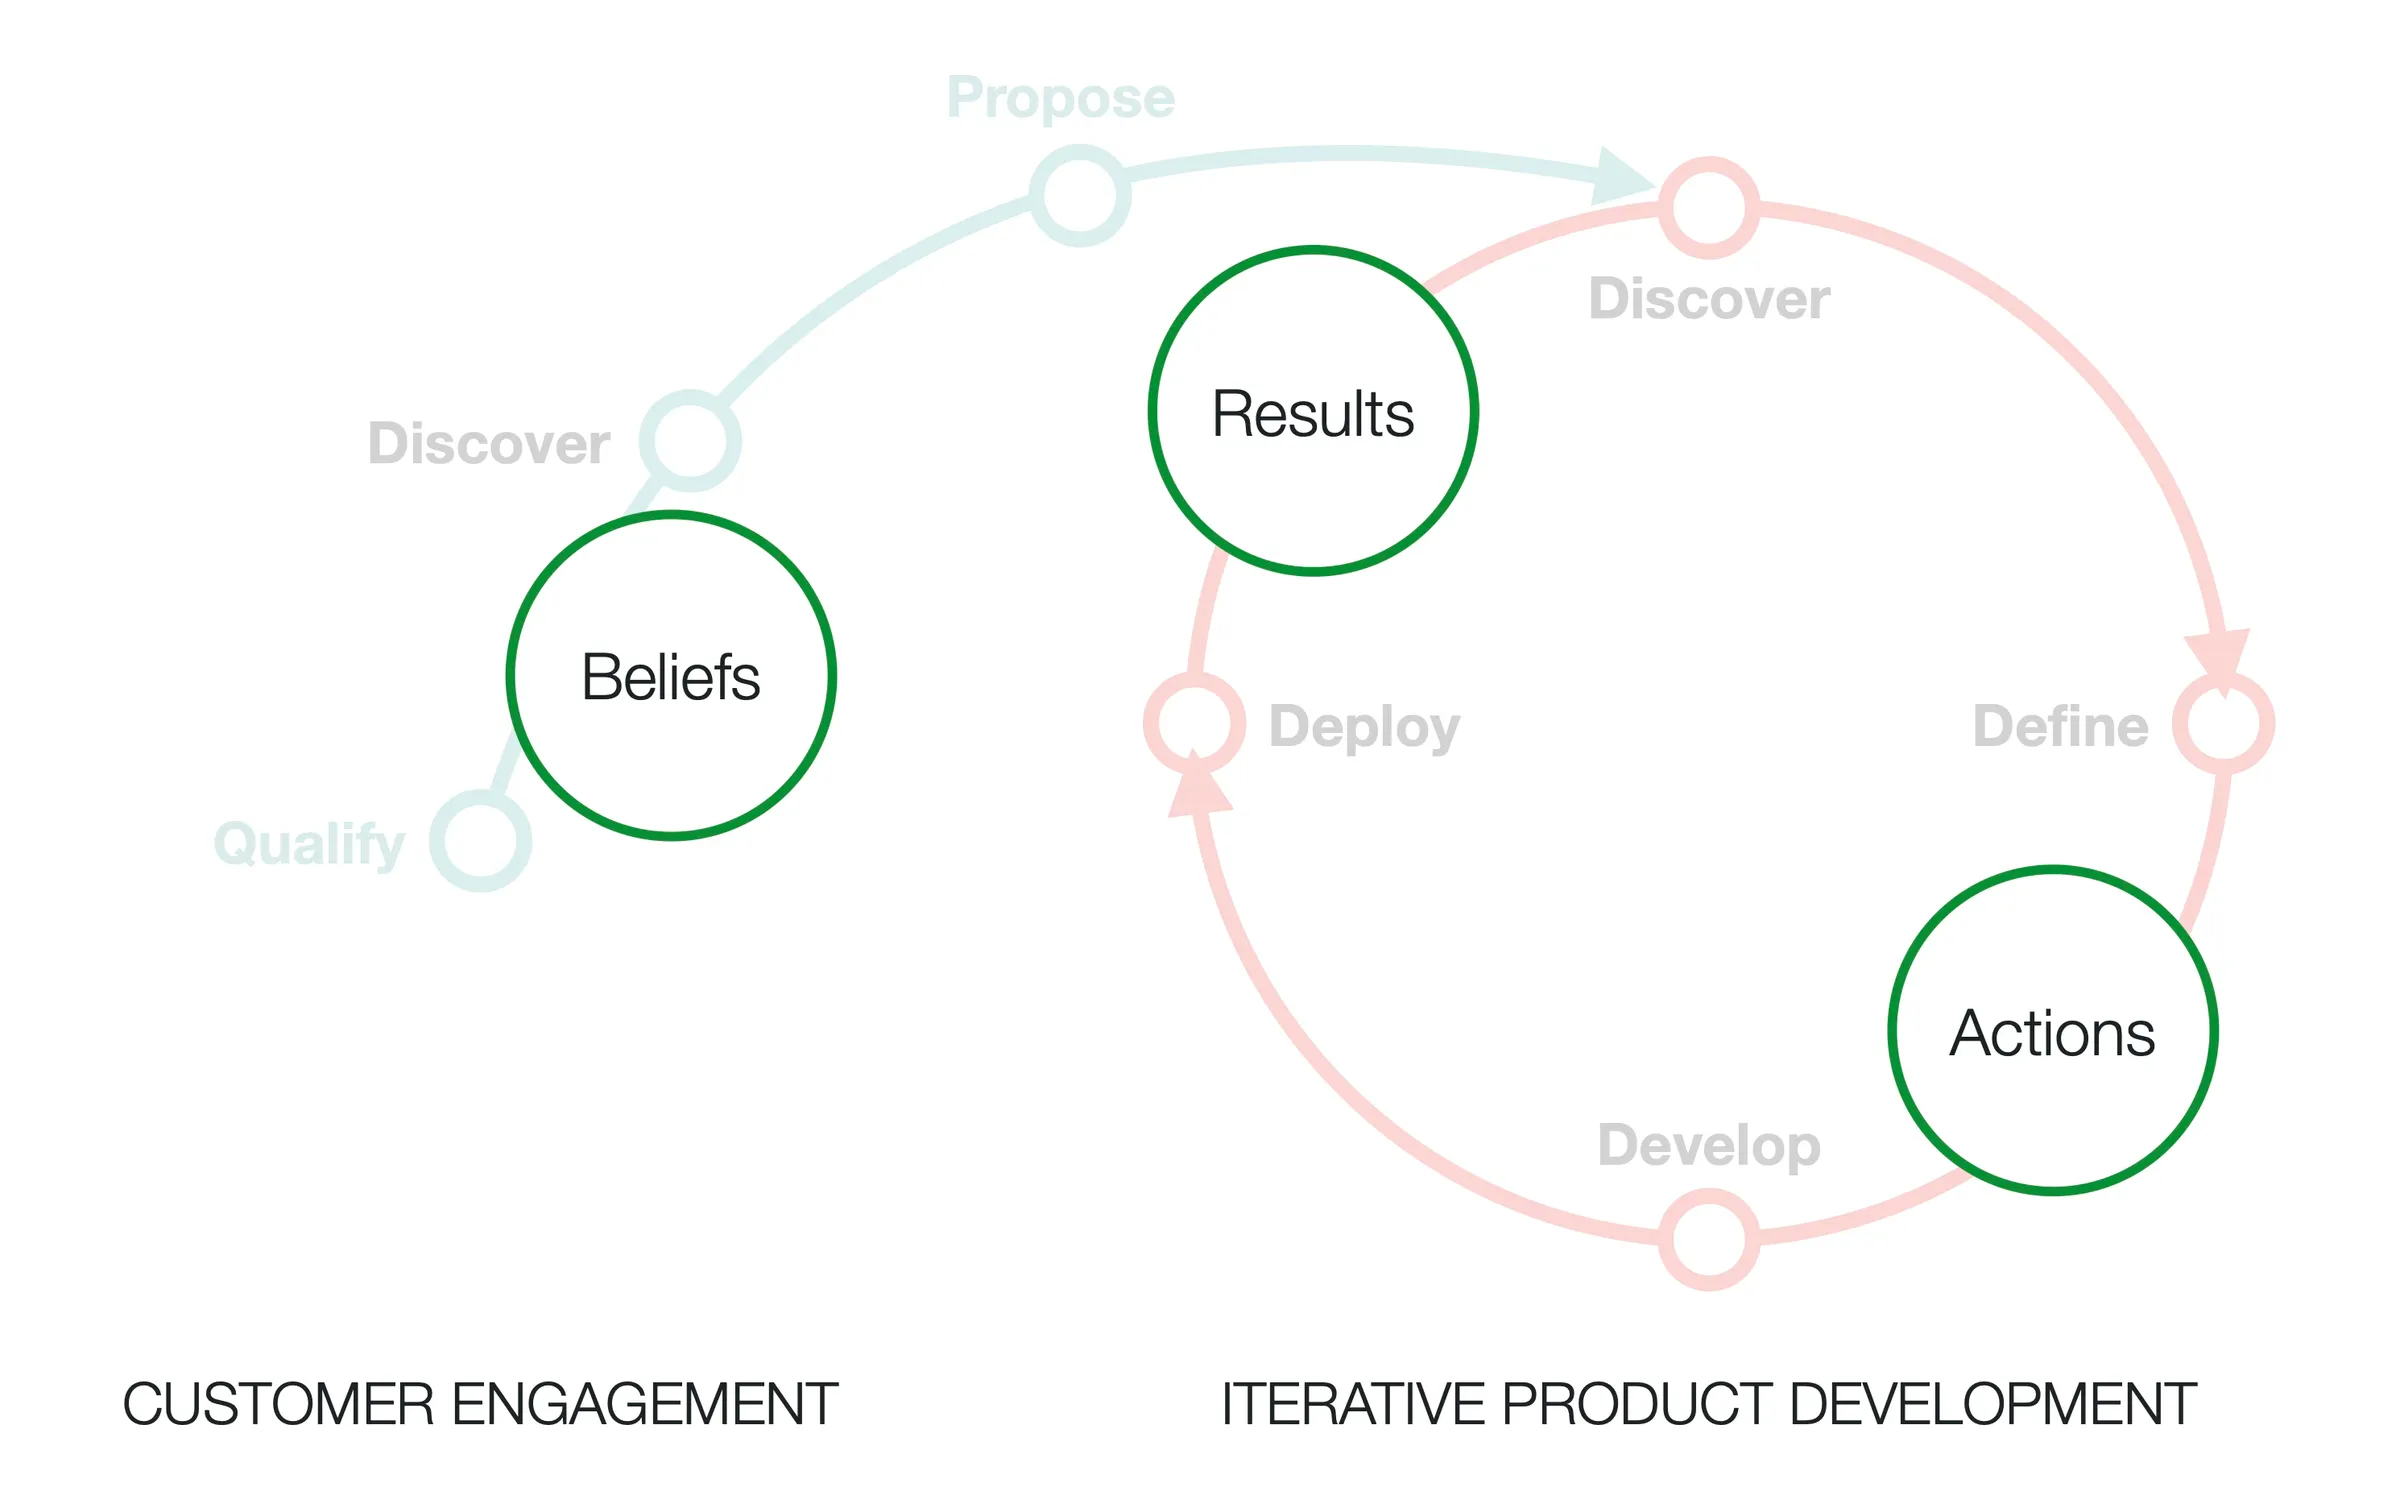
The two aims I set for the Discover phase: gather as much as possible while building customer stickiness, and keep the time between qualifying and proposing short. They are the trade-off the workshops were designed around.
Maximize info gathering & customer stickiness.
Minimize time between qualify & proposal.
Ecosystem mapping
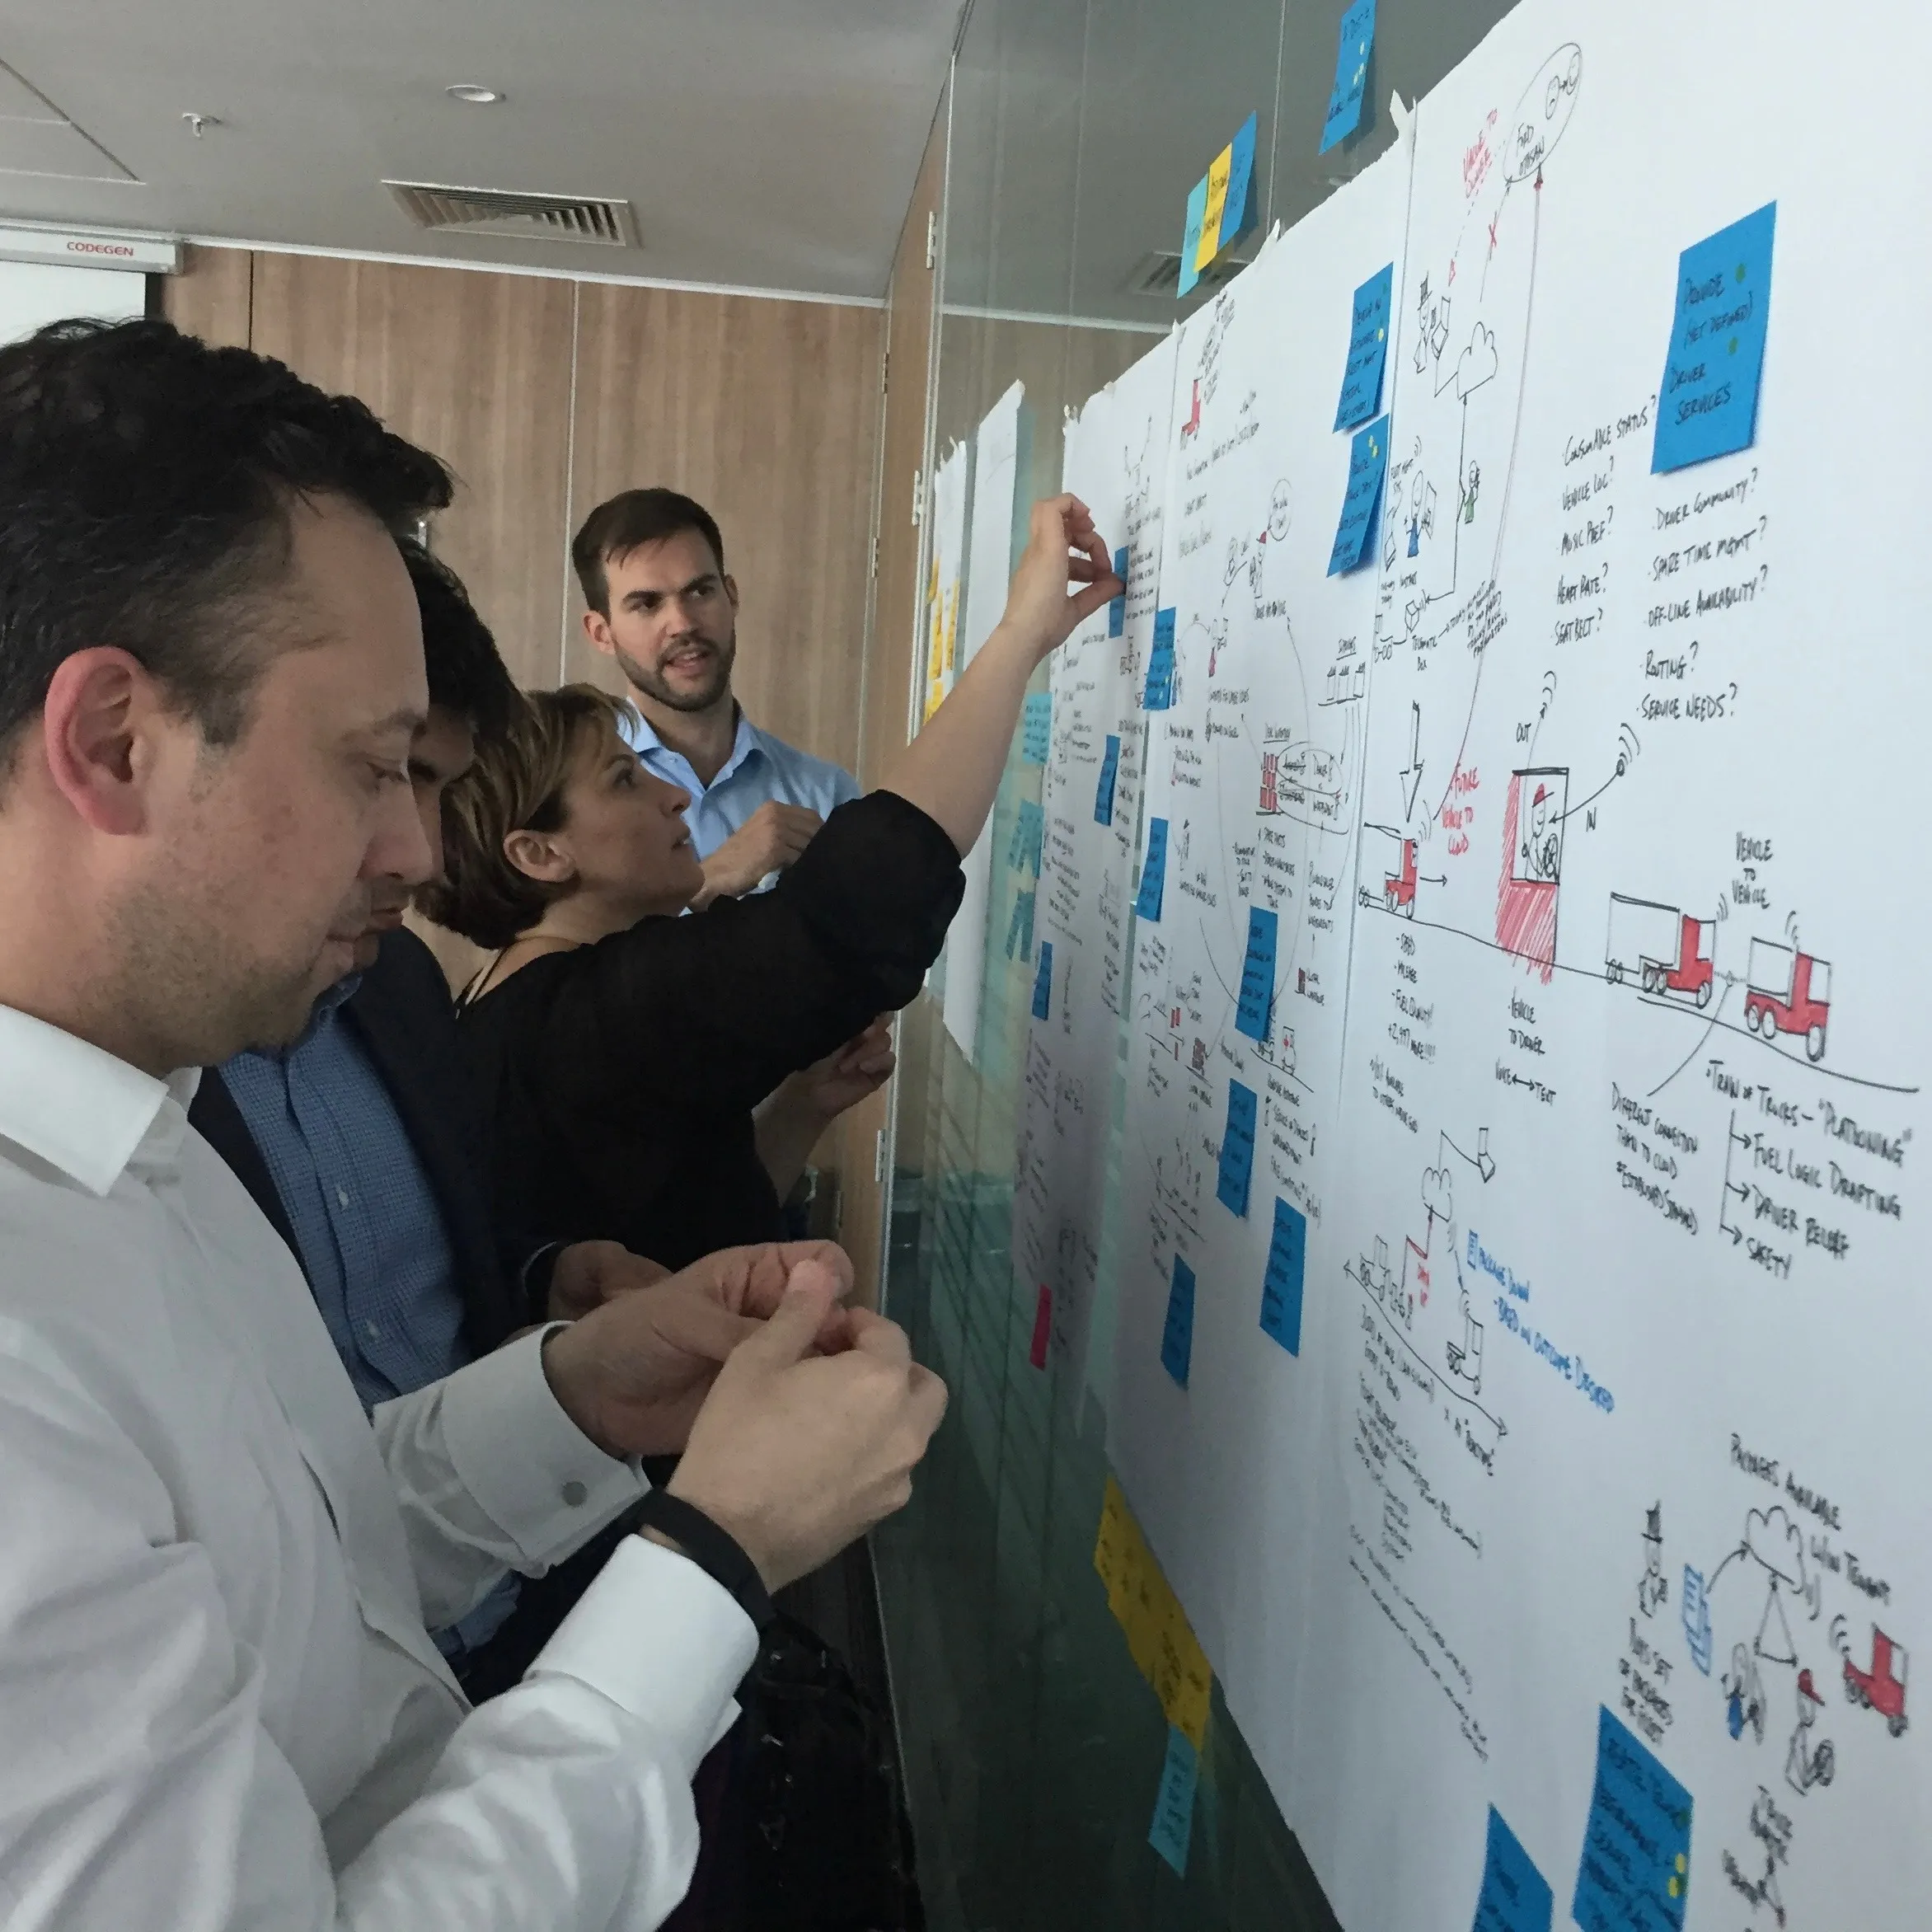
Ecosystem mapping, the core design-thinking structure we developed for discovery and the one I taught the team, and the seven questions of a session, from the business or operational problem-space through the people, things and environments and how they connect, to why the current situation causes pain and how the outcome might improve, beside a room working the map.
We developed a powerful design thinking structure around “Ecosystem Mapping”. This process dives into a business domain, structures IoT components, and focuses solving an identified problem within that system. This is only one design thinking tool used during discovery workshops, but I was able to teach my team this process with success across multiple engagements.
- What is the general business or operational problem-space?
- Who are the people involved and their persona information?
- Which physical devices or things are included in the operation?
- Where are the environments in which this work occurs?
- How are the people, things, and environments connected?
- Why is the current situation causing pain?
- How might we take this understanding and improve the outcome?
Off-site research
GE Digital's purpose-built space for sessions with partners and customers, in three views, one with its moving wall open. We had the room; I still preferred to work at the customer's site, and the next block shows why.
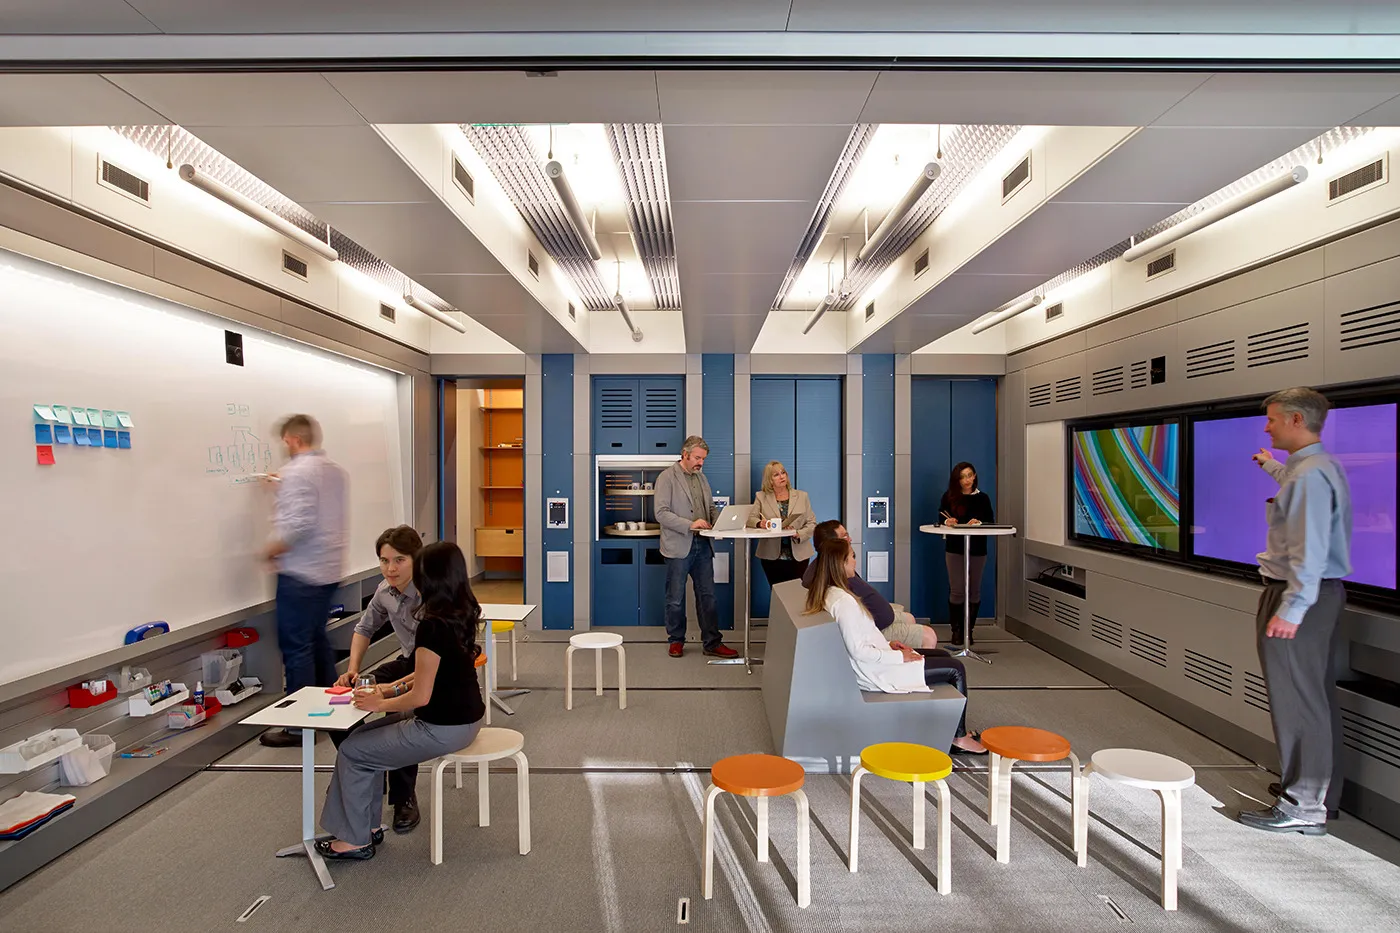
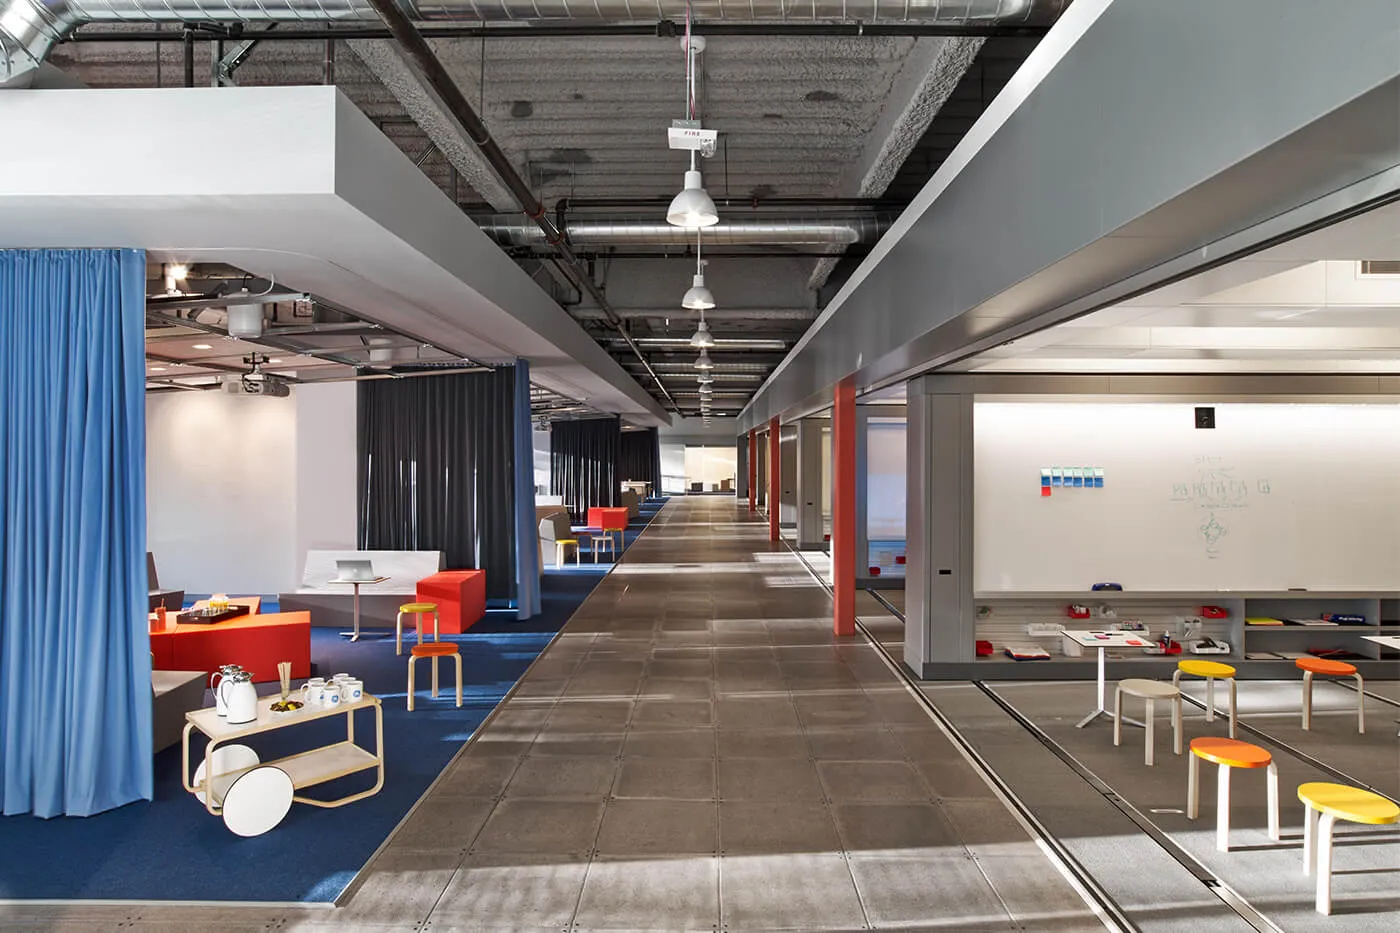
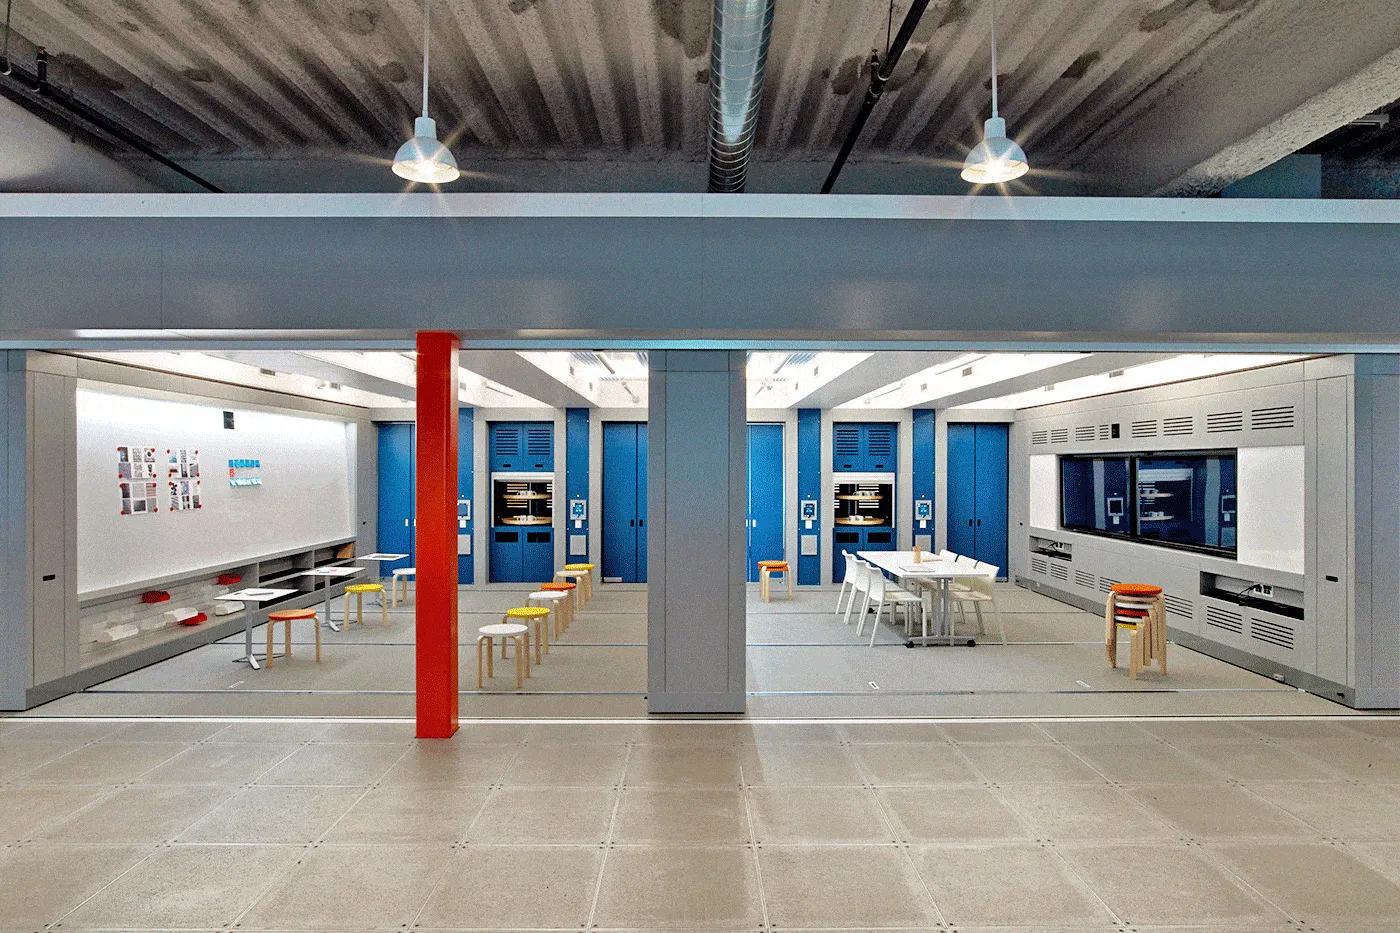
GE Digital created a purpose-built space to host these design-thinking research engagements with partners and customers.
See more at Rapt Studio
On-site research
Four customer sites: an electrical substation in Japan, an elevator installation in Switzerland, the control room of a water desalination pumping station in Saudi Arabia and a mining tire yard in Australia. We preferred working in context, with the business owners and subject-matter experts, to working in our own space, and each place taught us something about how to work there.
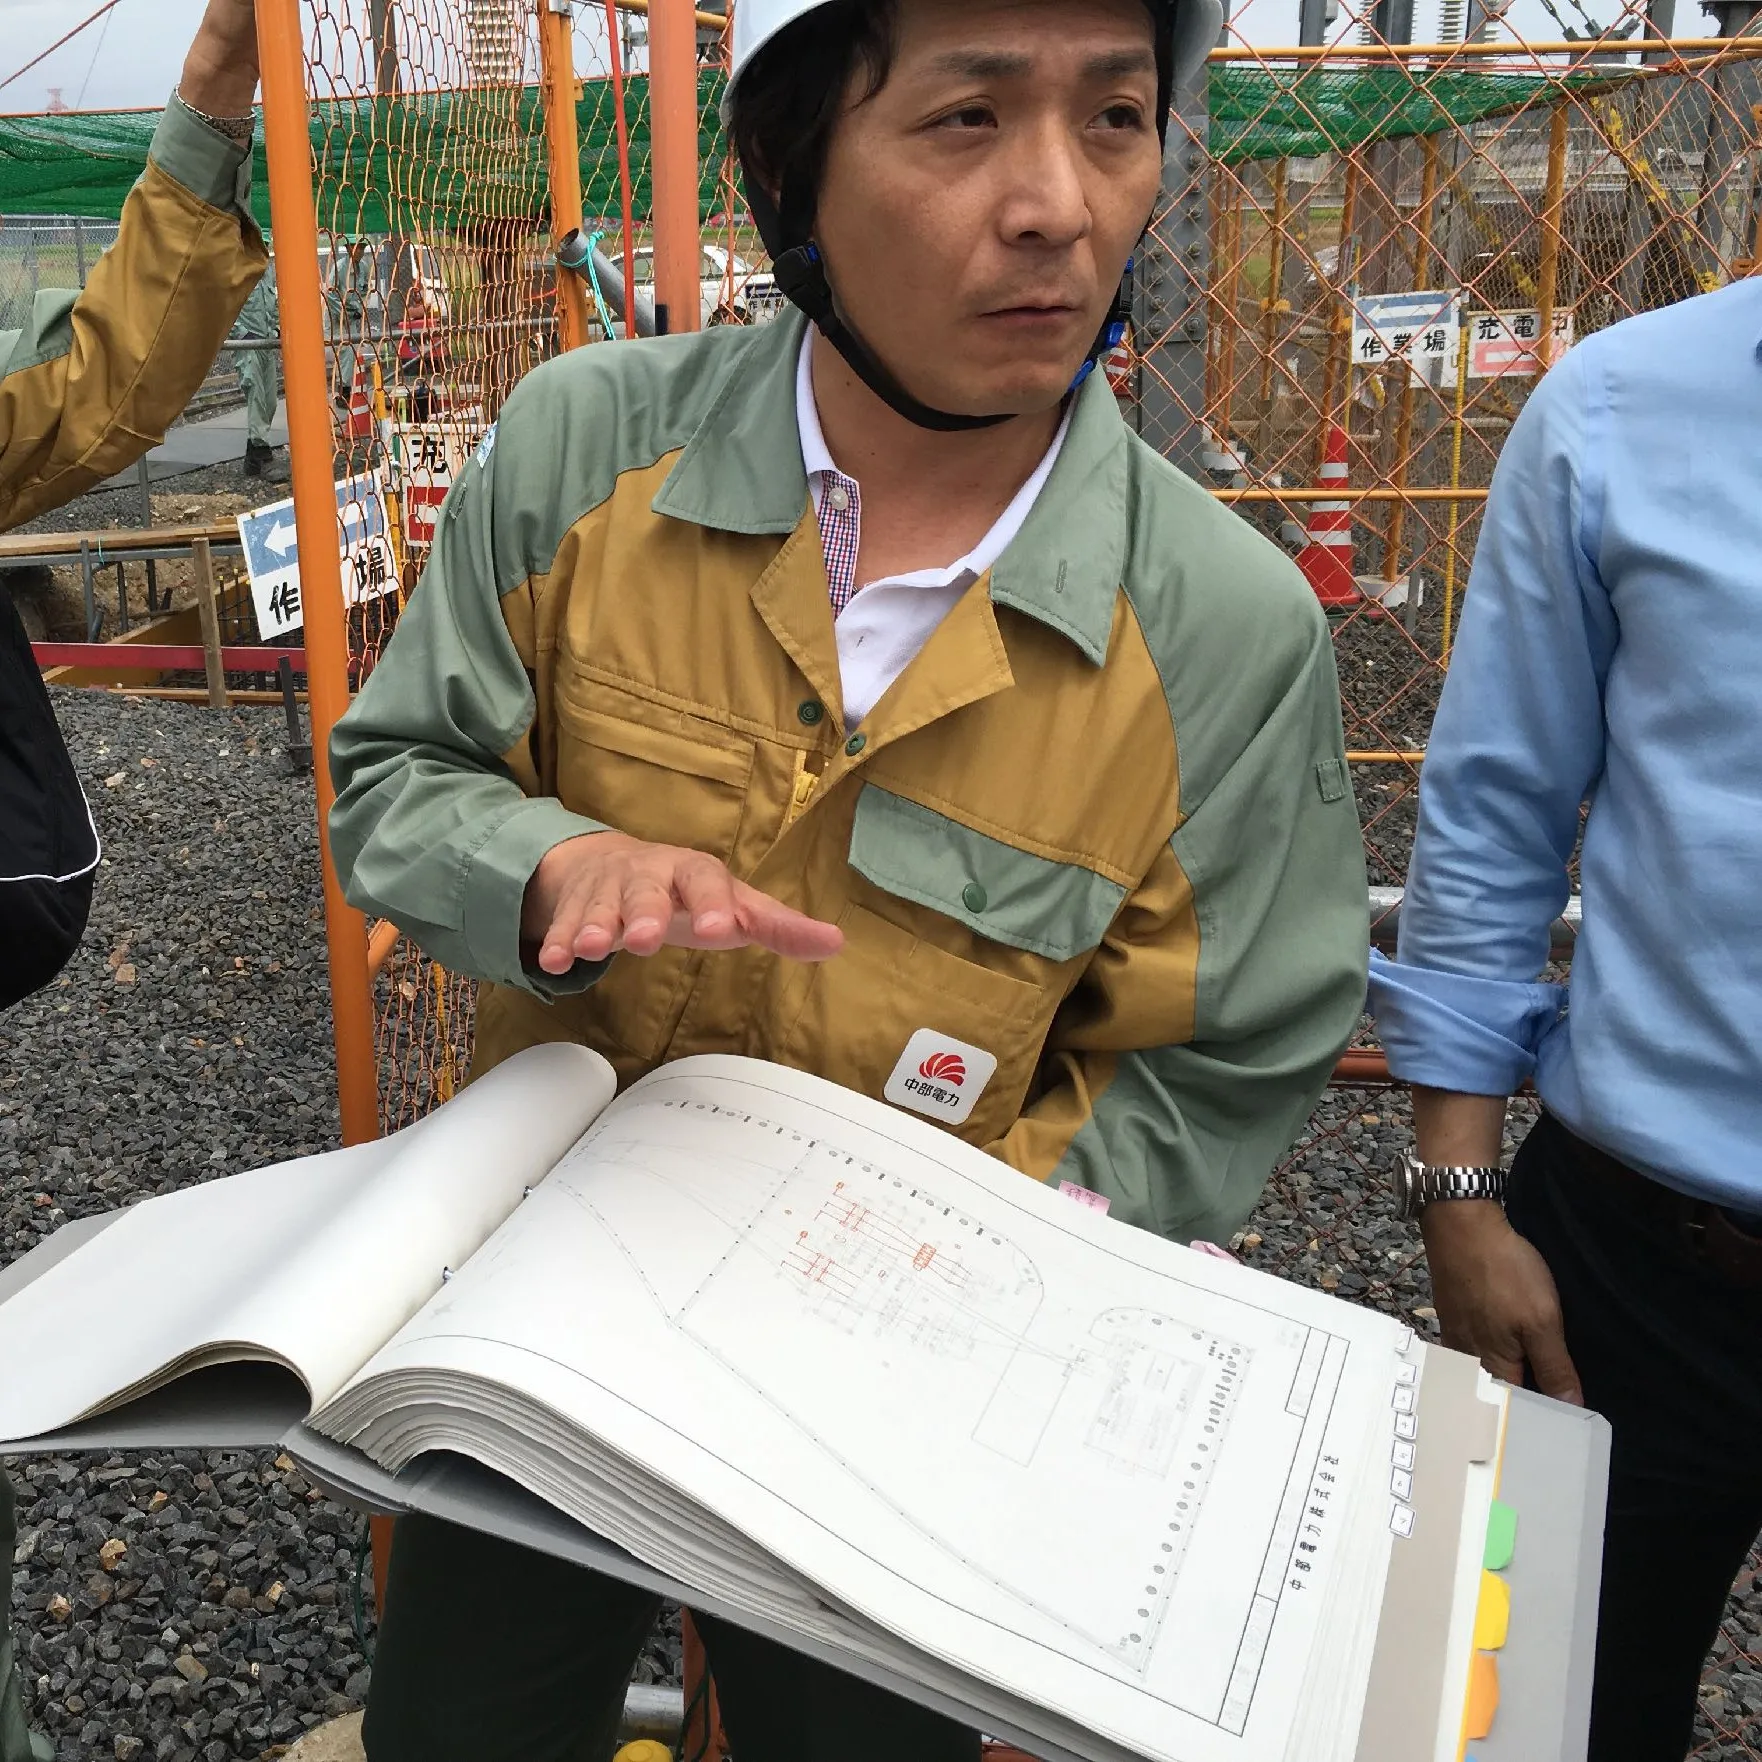
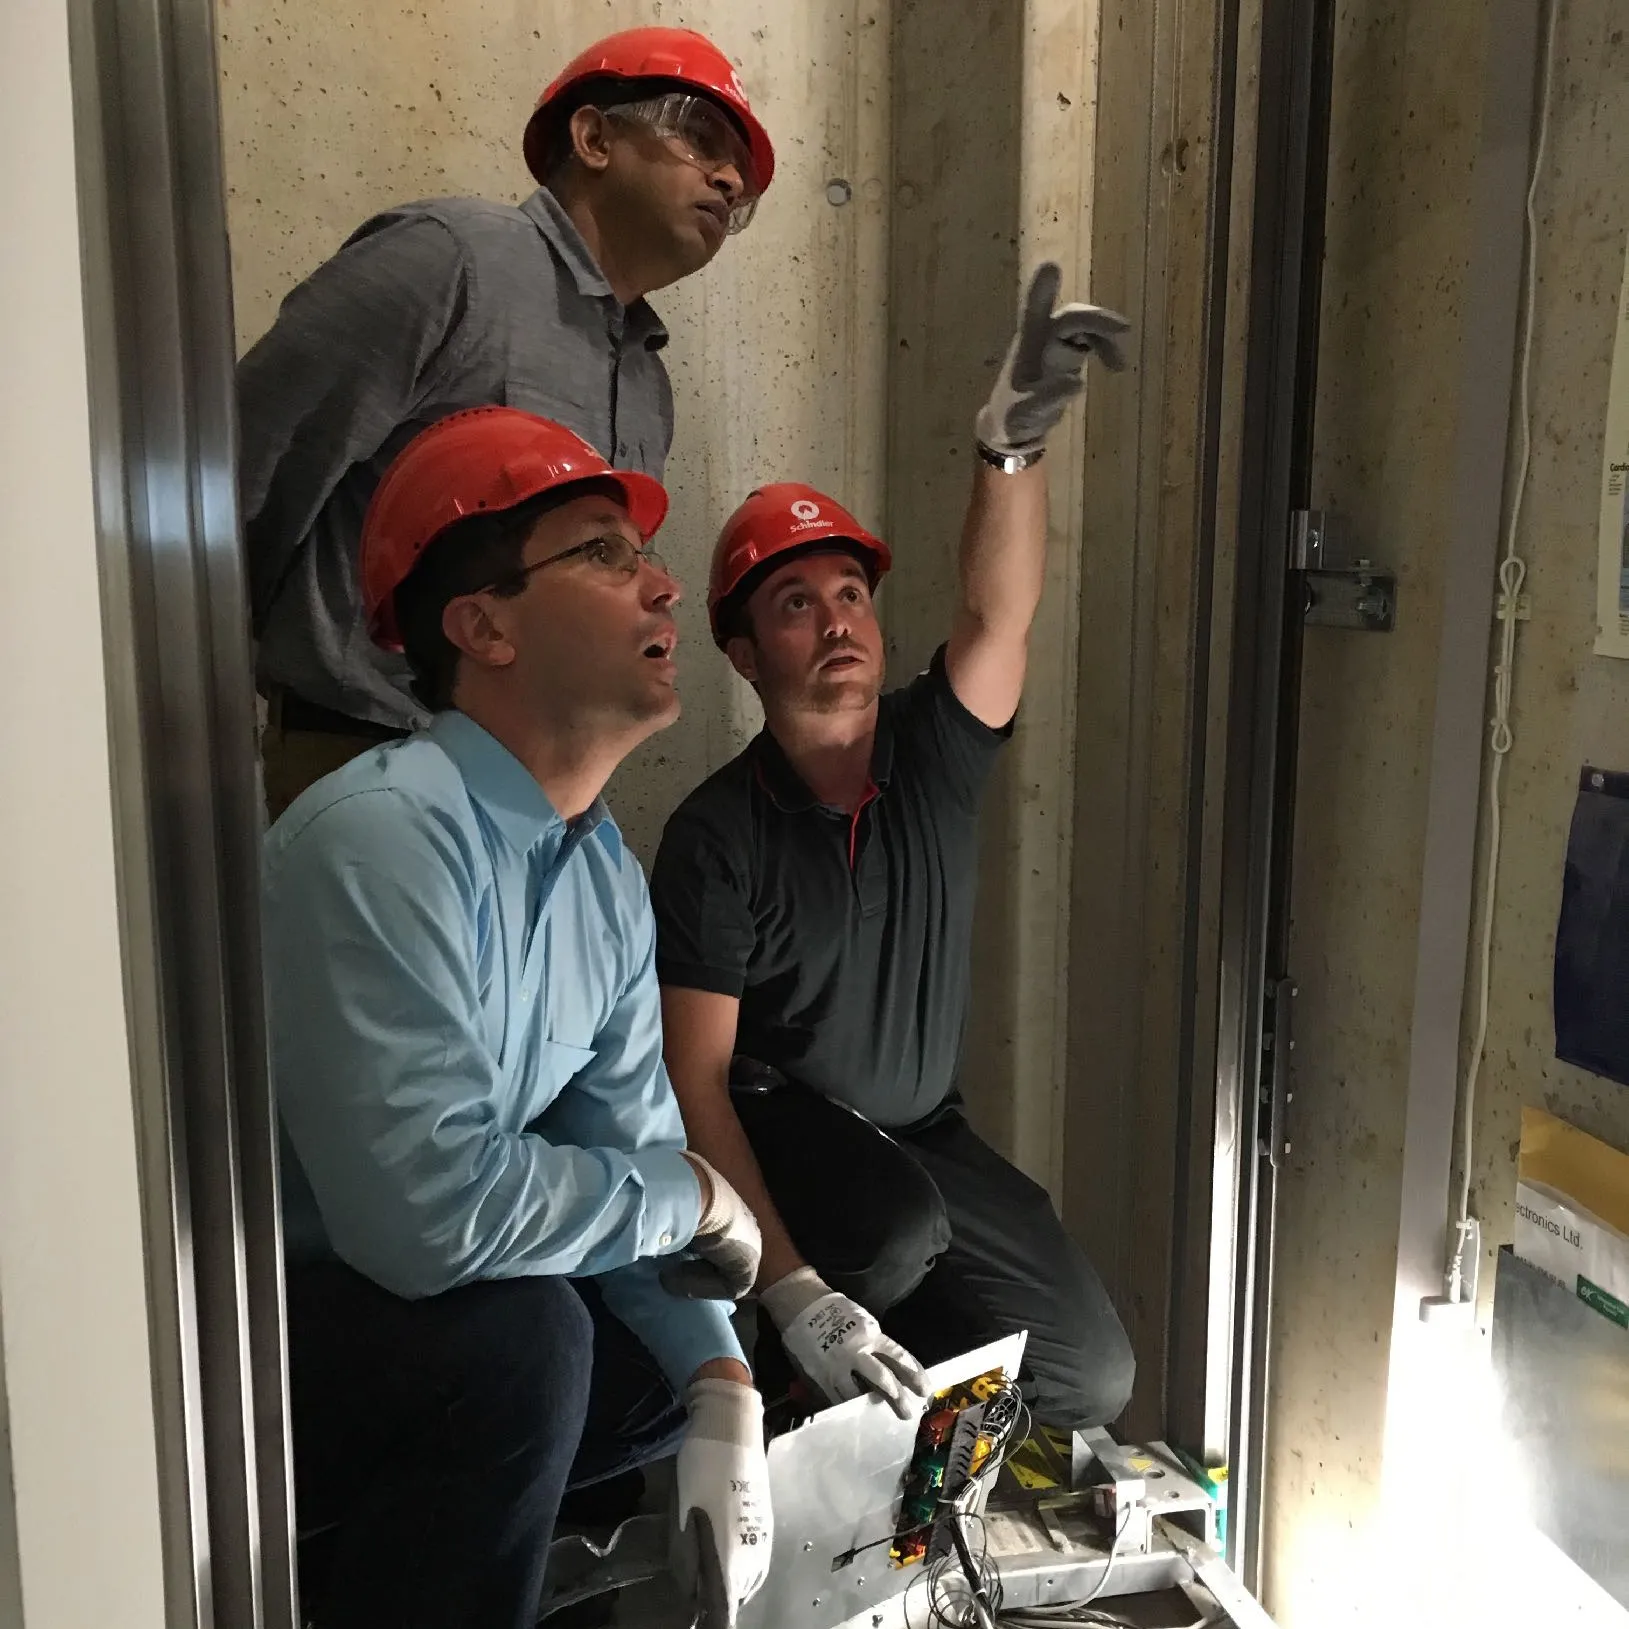
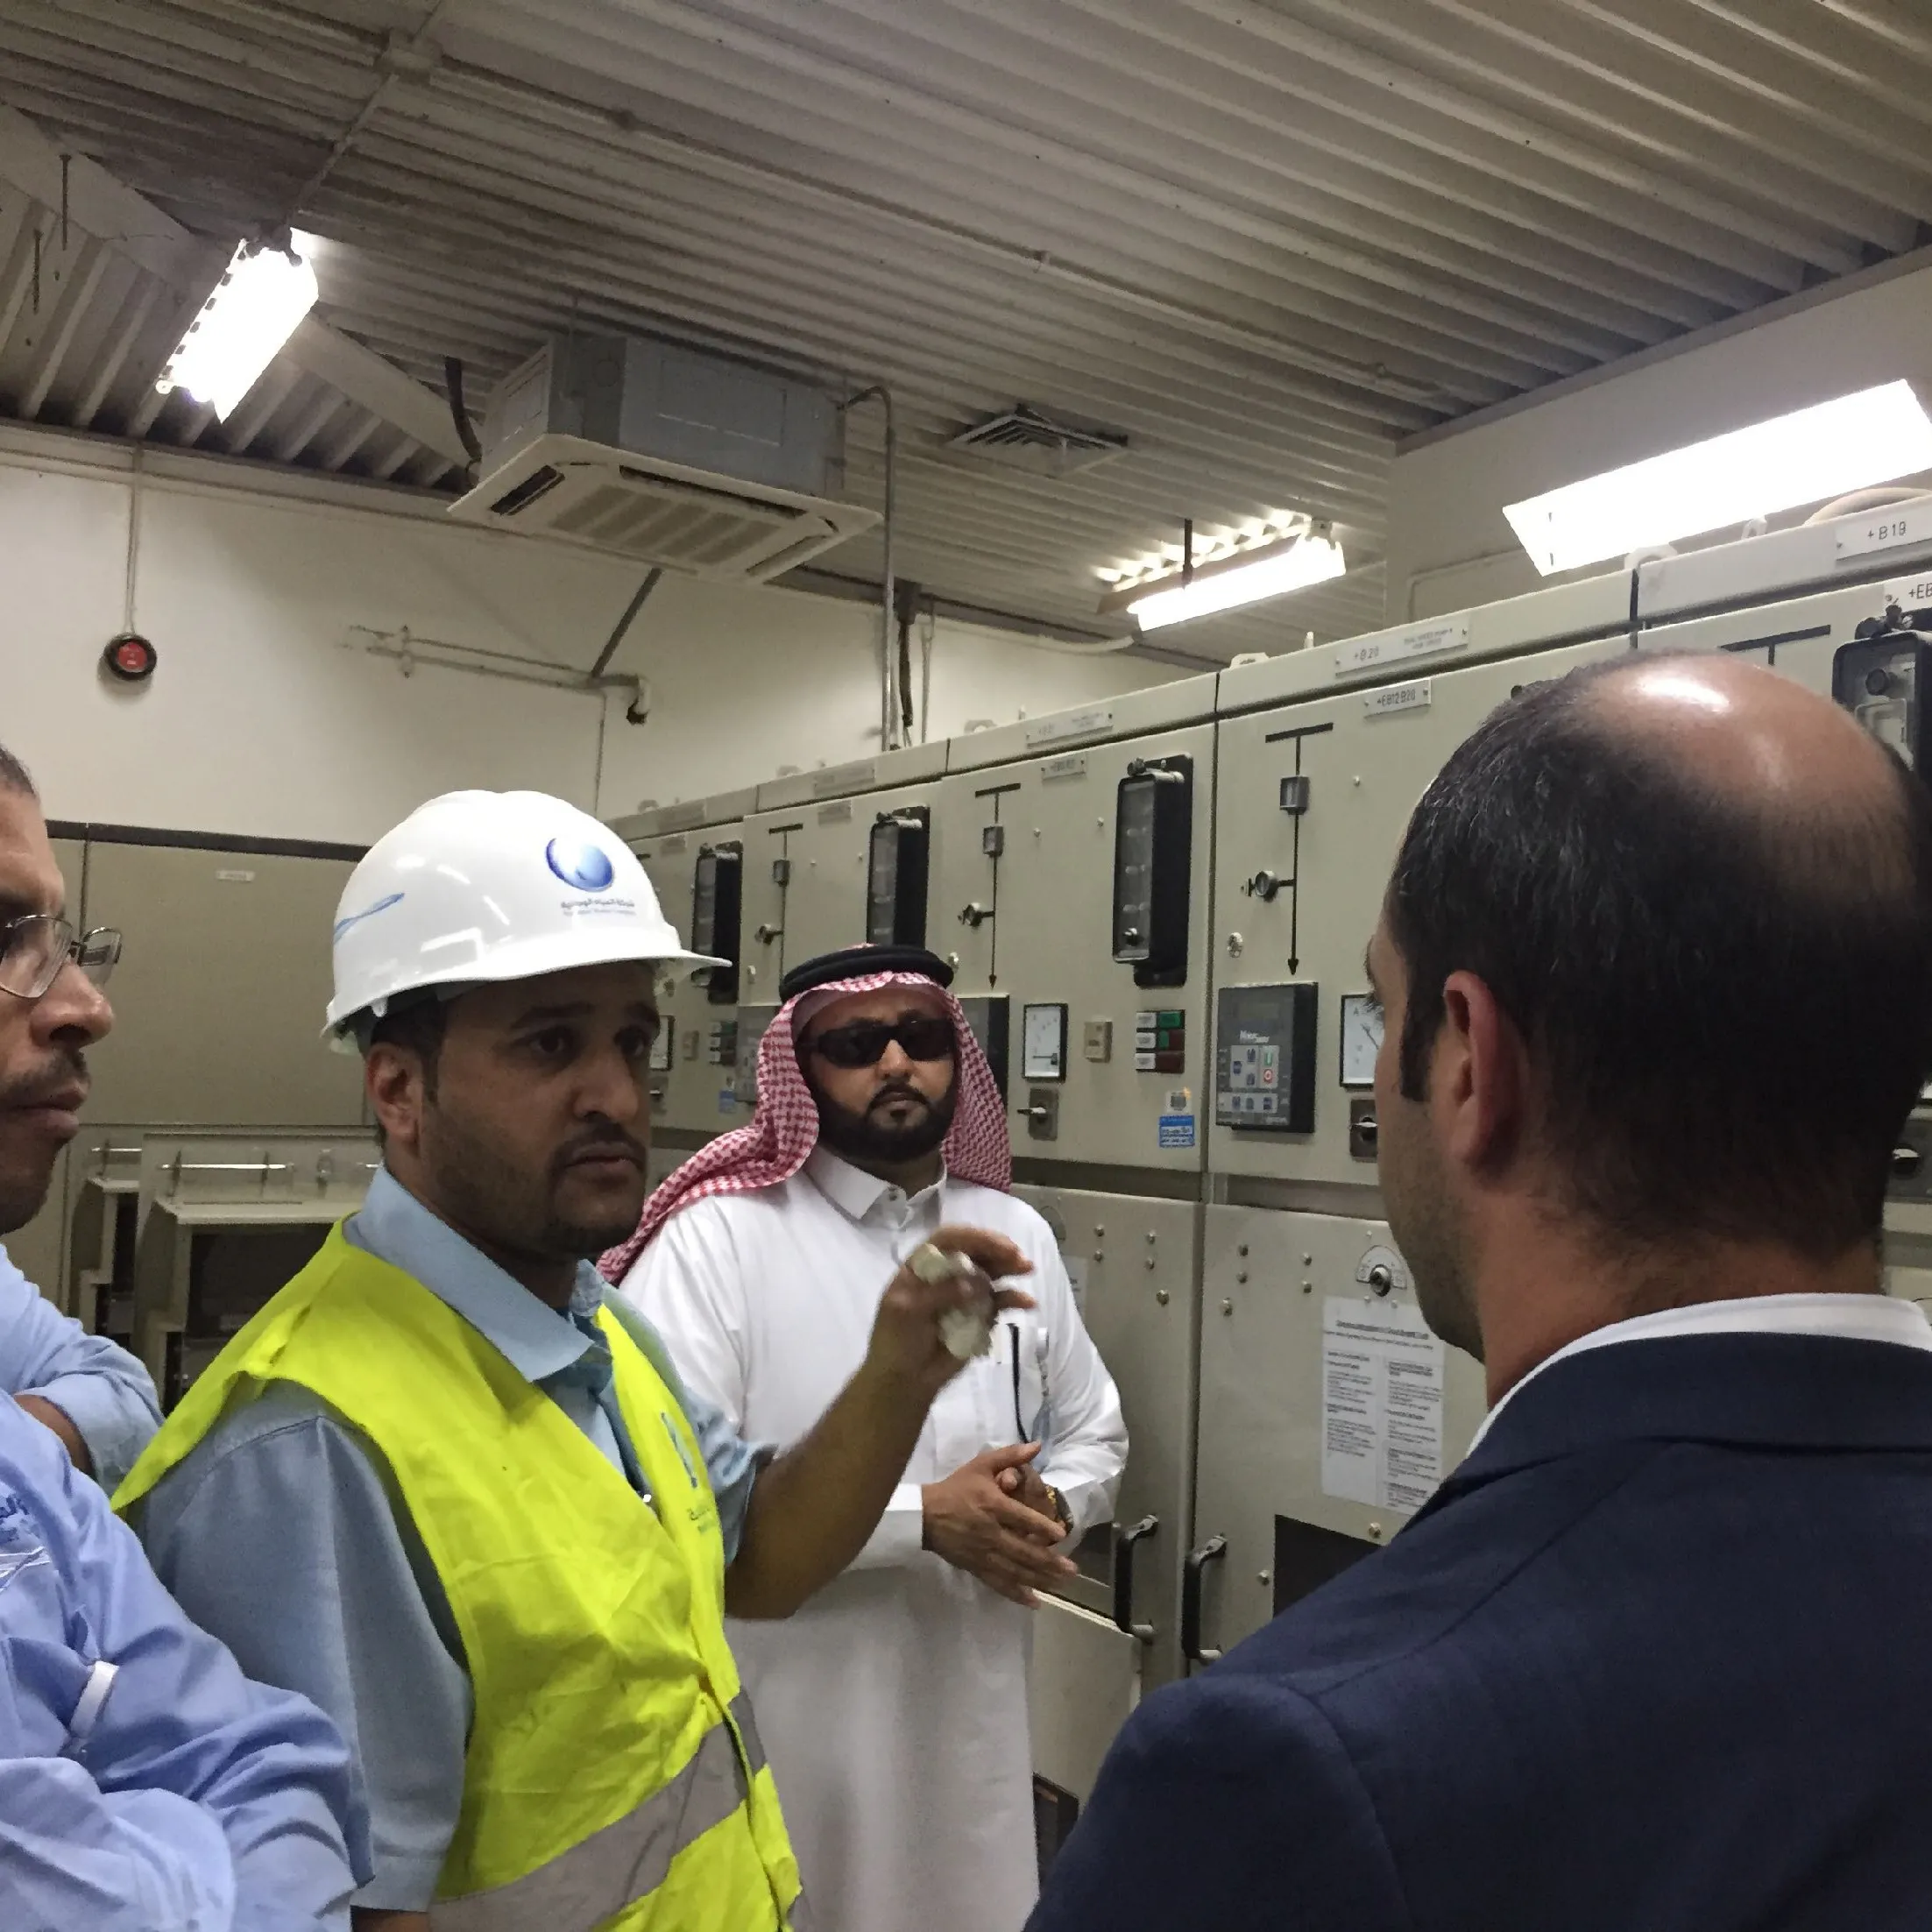
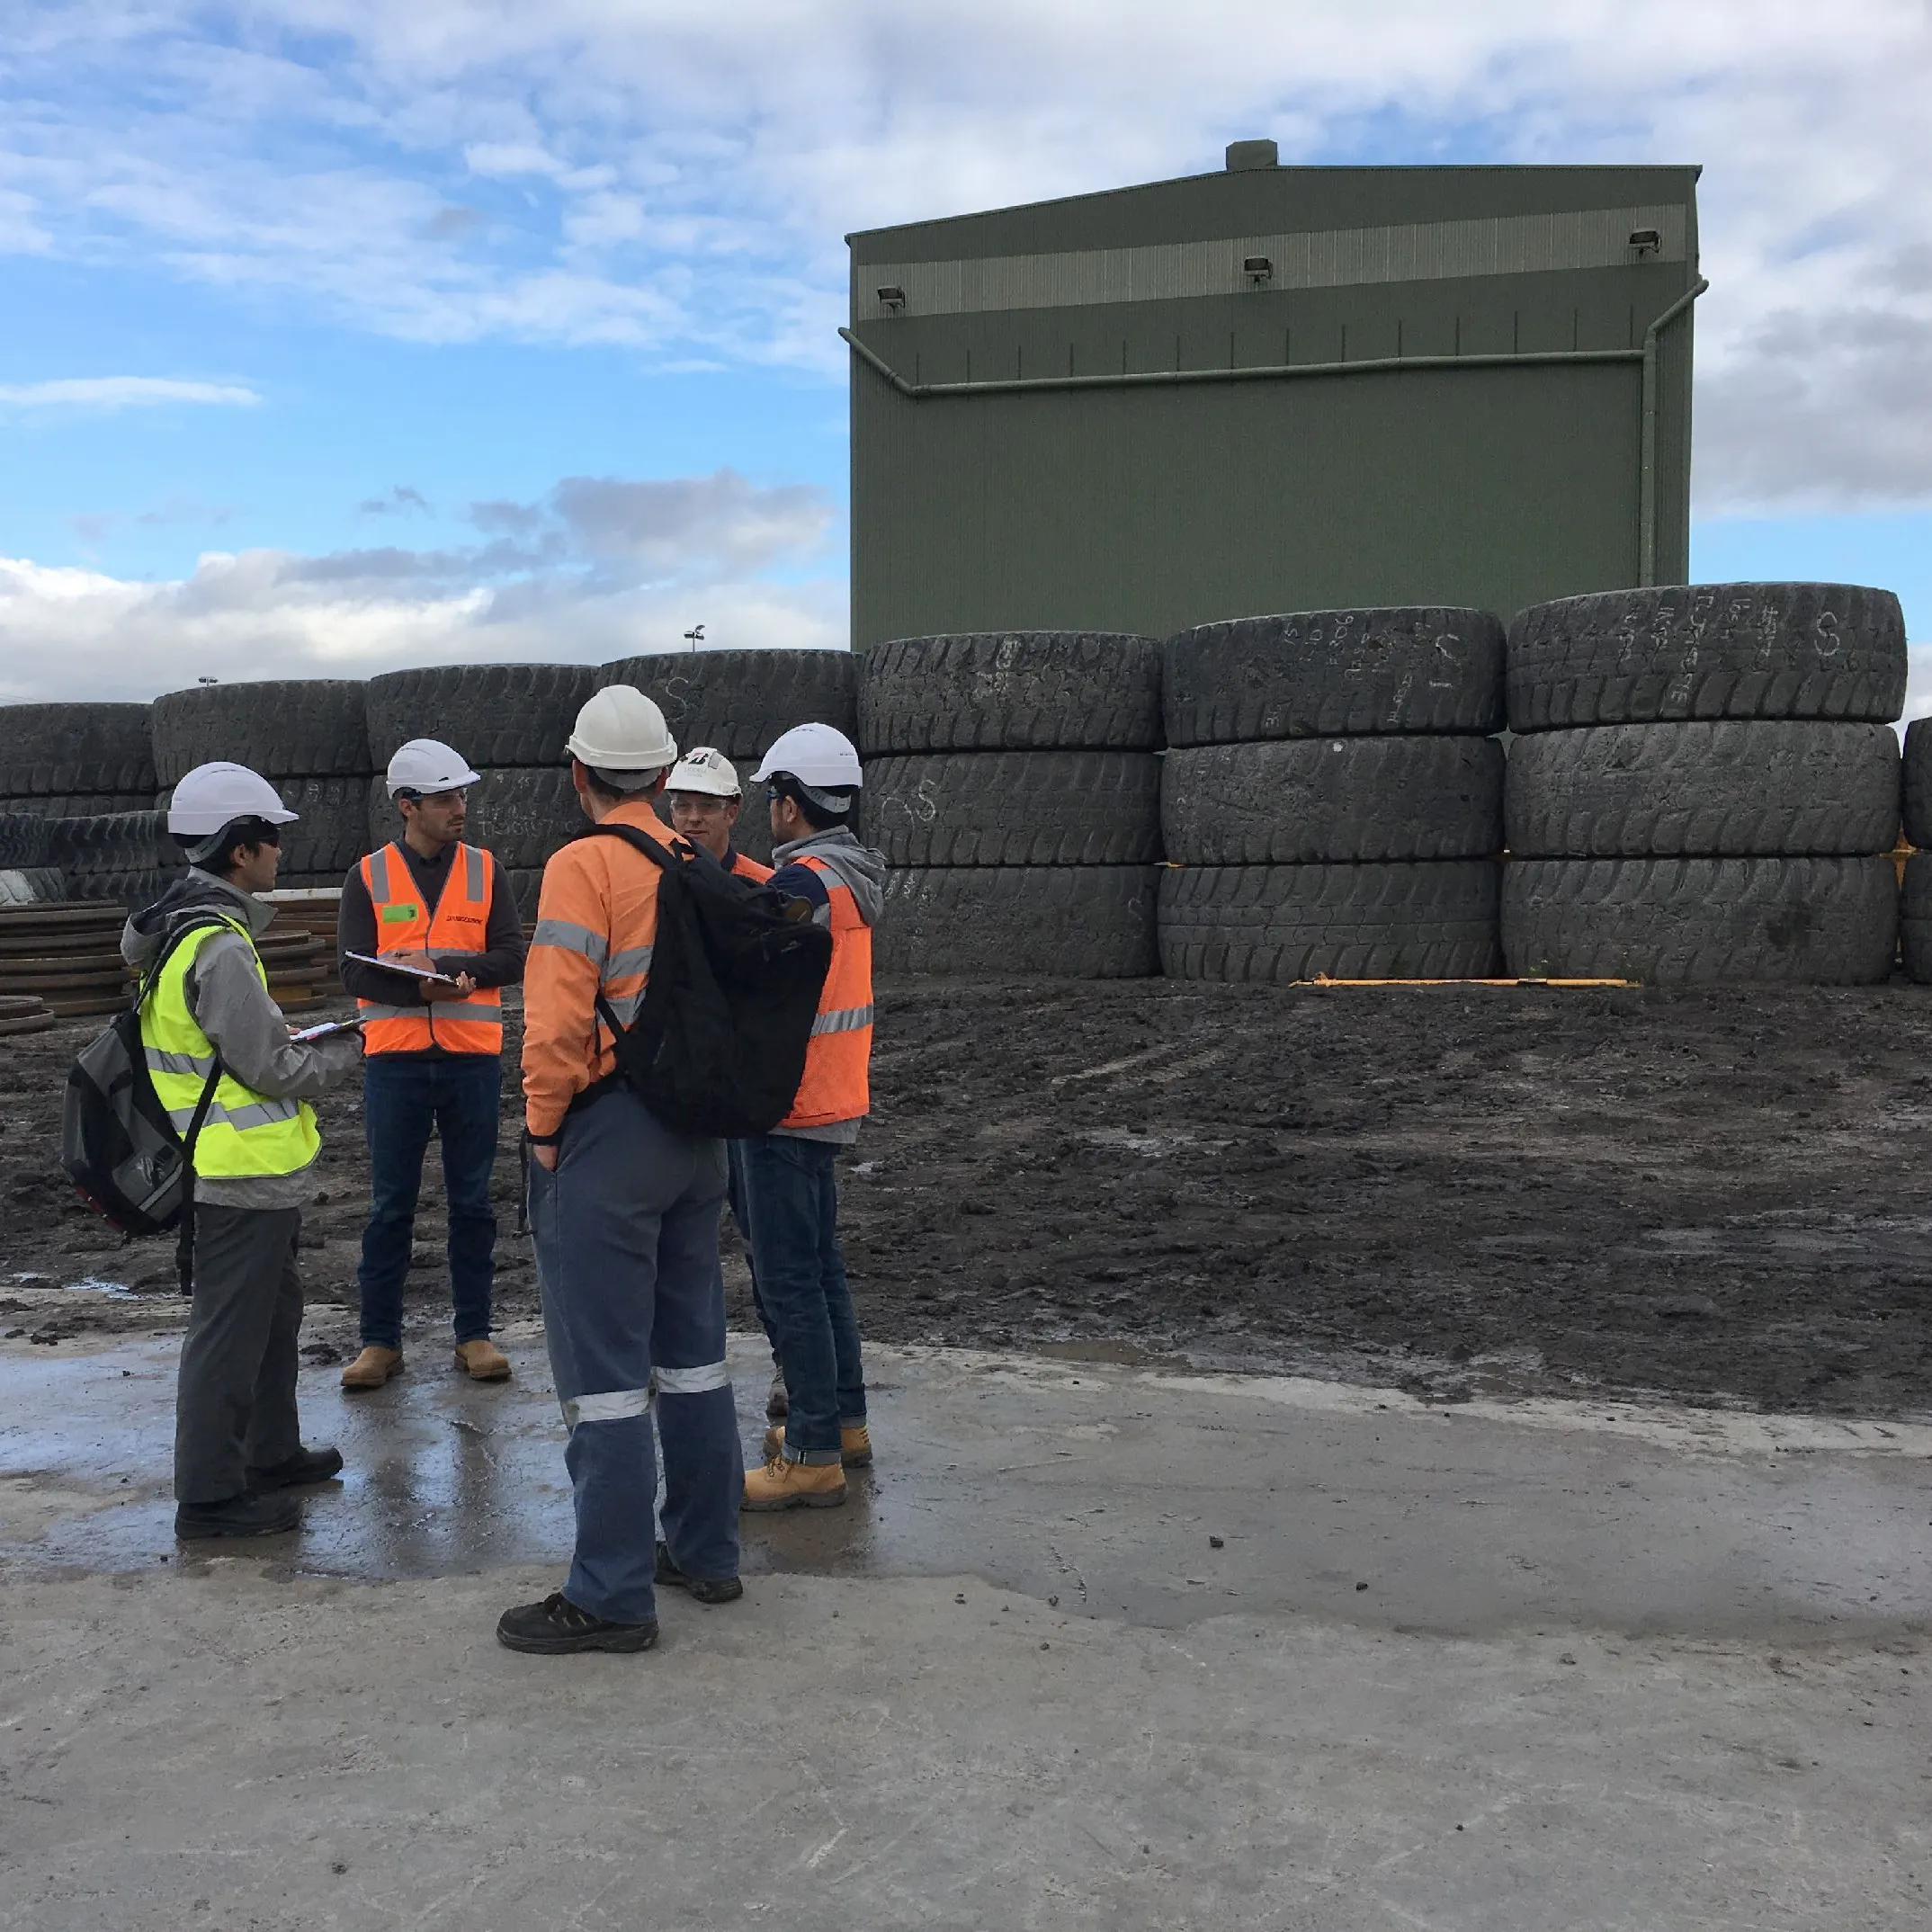
As our practice matured and customers realized the value of this engagement, we conducted most of our sessions on-site and in the customer's work environment. This allowed first-hand, high-context research which improved the quality of the collected data, established deeper empathy, and forged strong working relationships. Cultural sensitivities learned: Japanese want outlines ahead of time and few surprises. The Swiss respect attention to detail in methods and analysis. Saudis will show you all they have accomplished. Australian miners want to see it work.
Case study: Ford Otosan
The case study: two days with Ford Otosan, a truck manufacturer in Istanbul. The building and an engine on display set the scene for the workshop that follows.
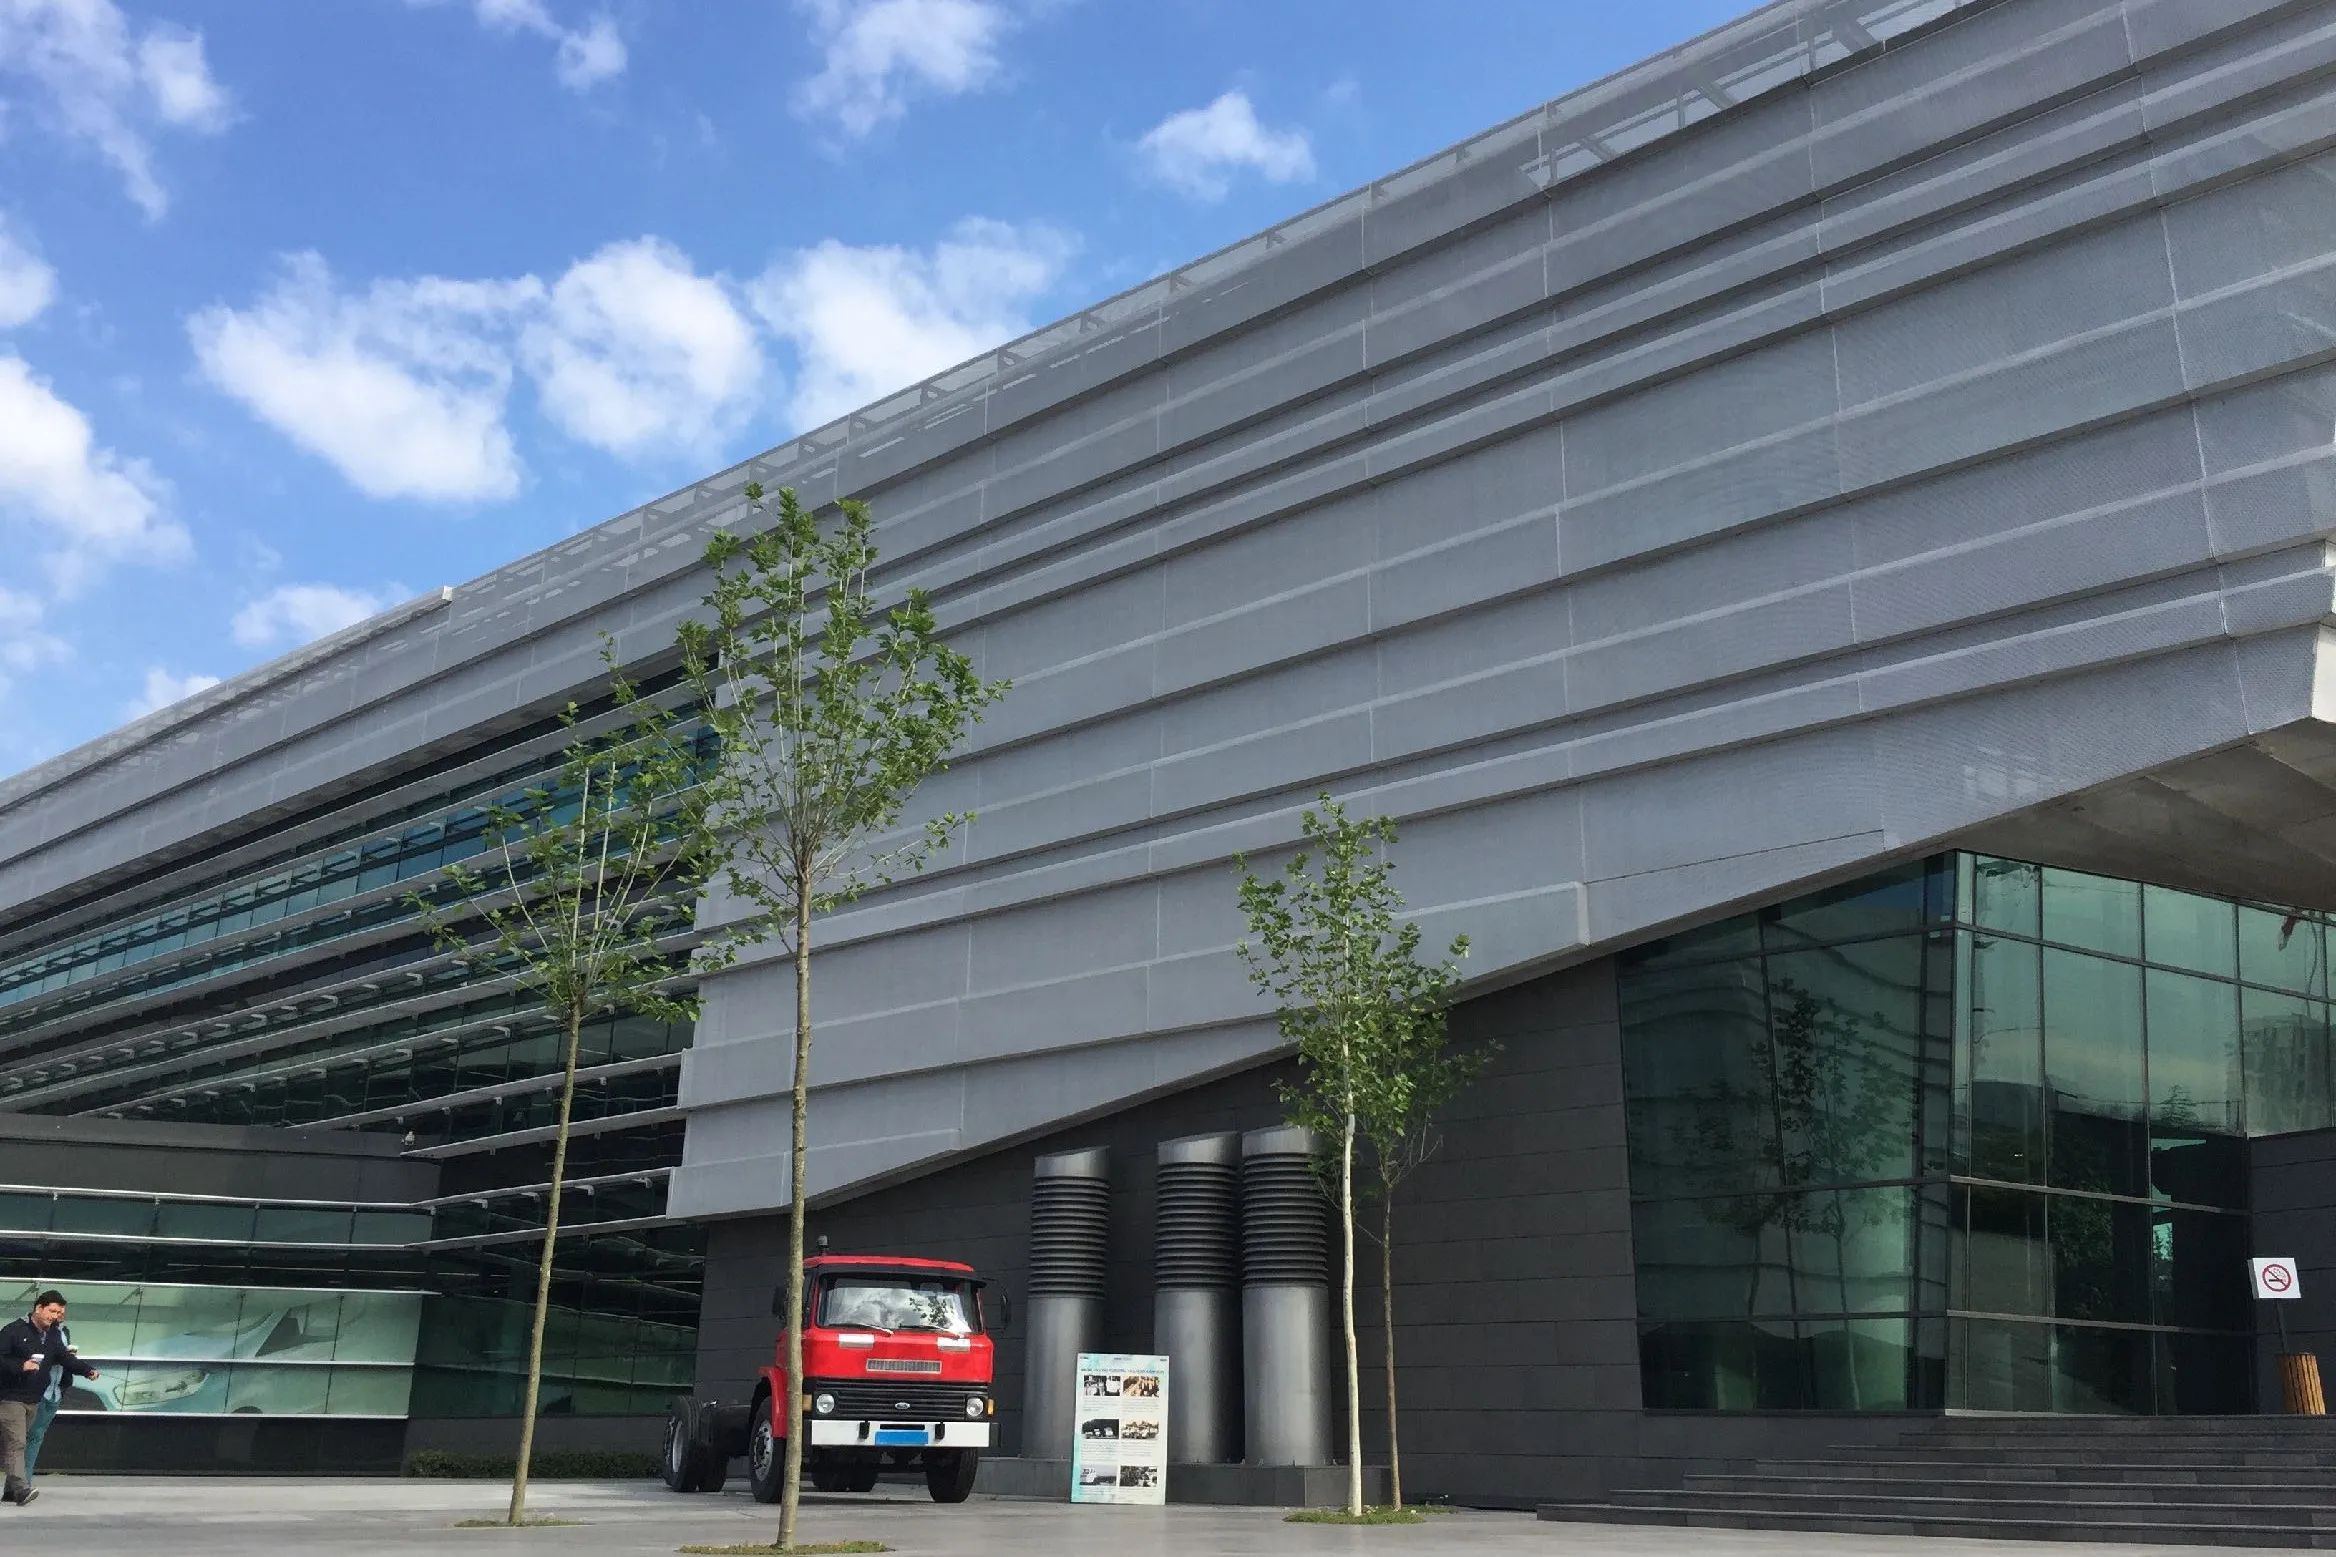
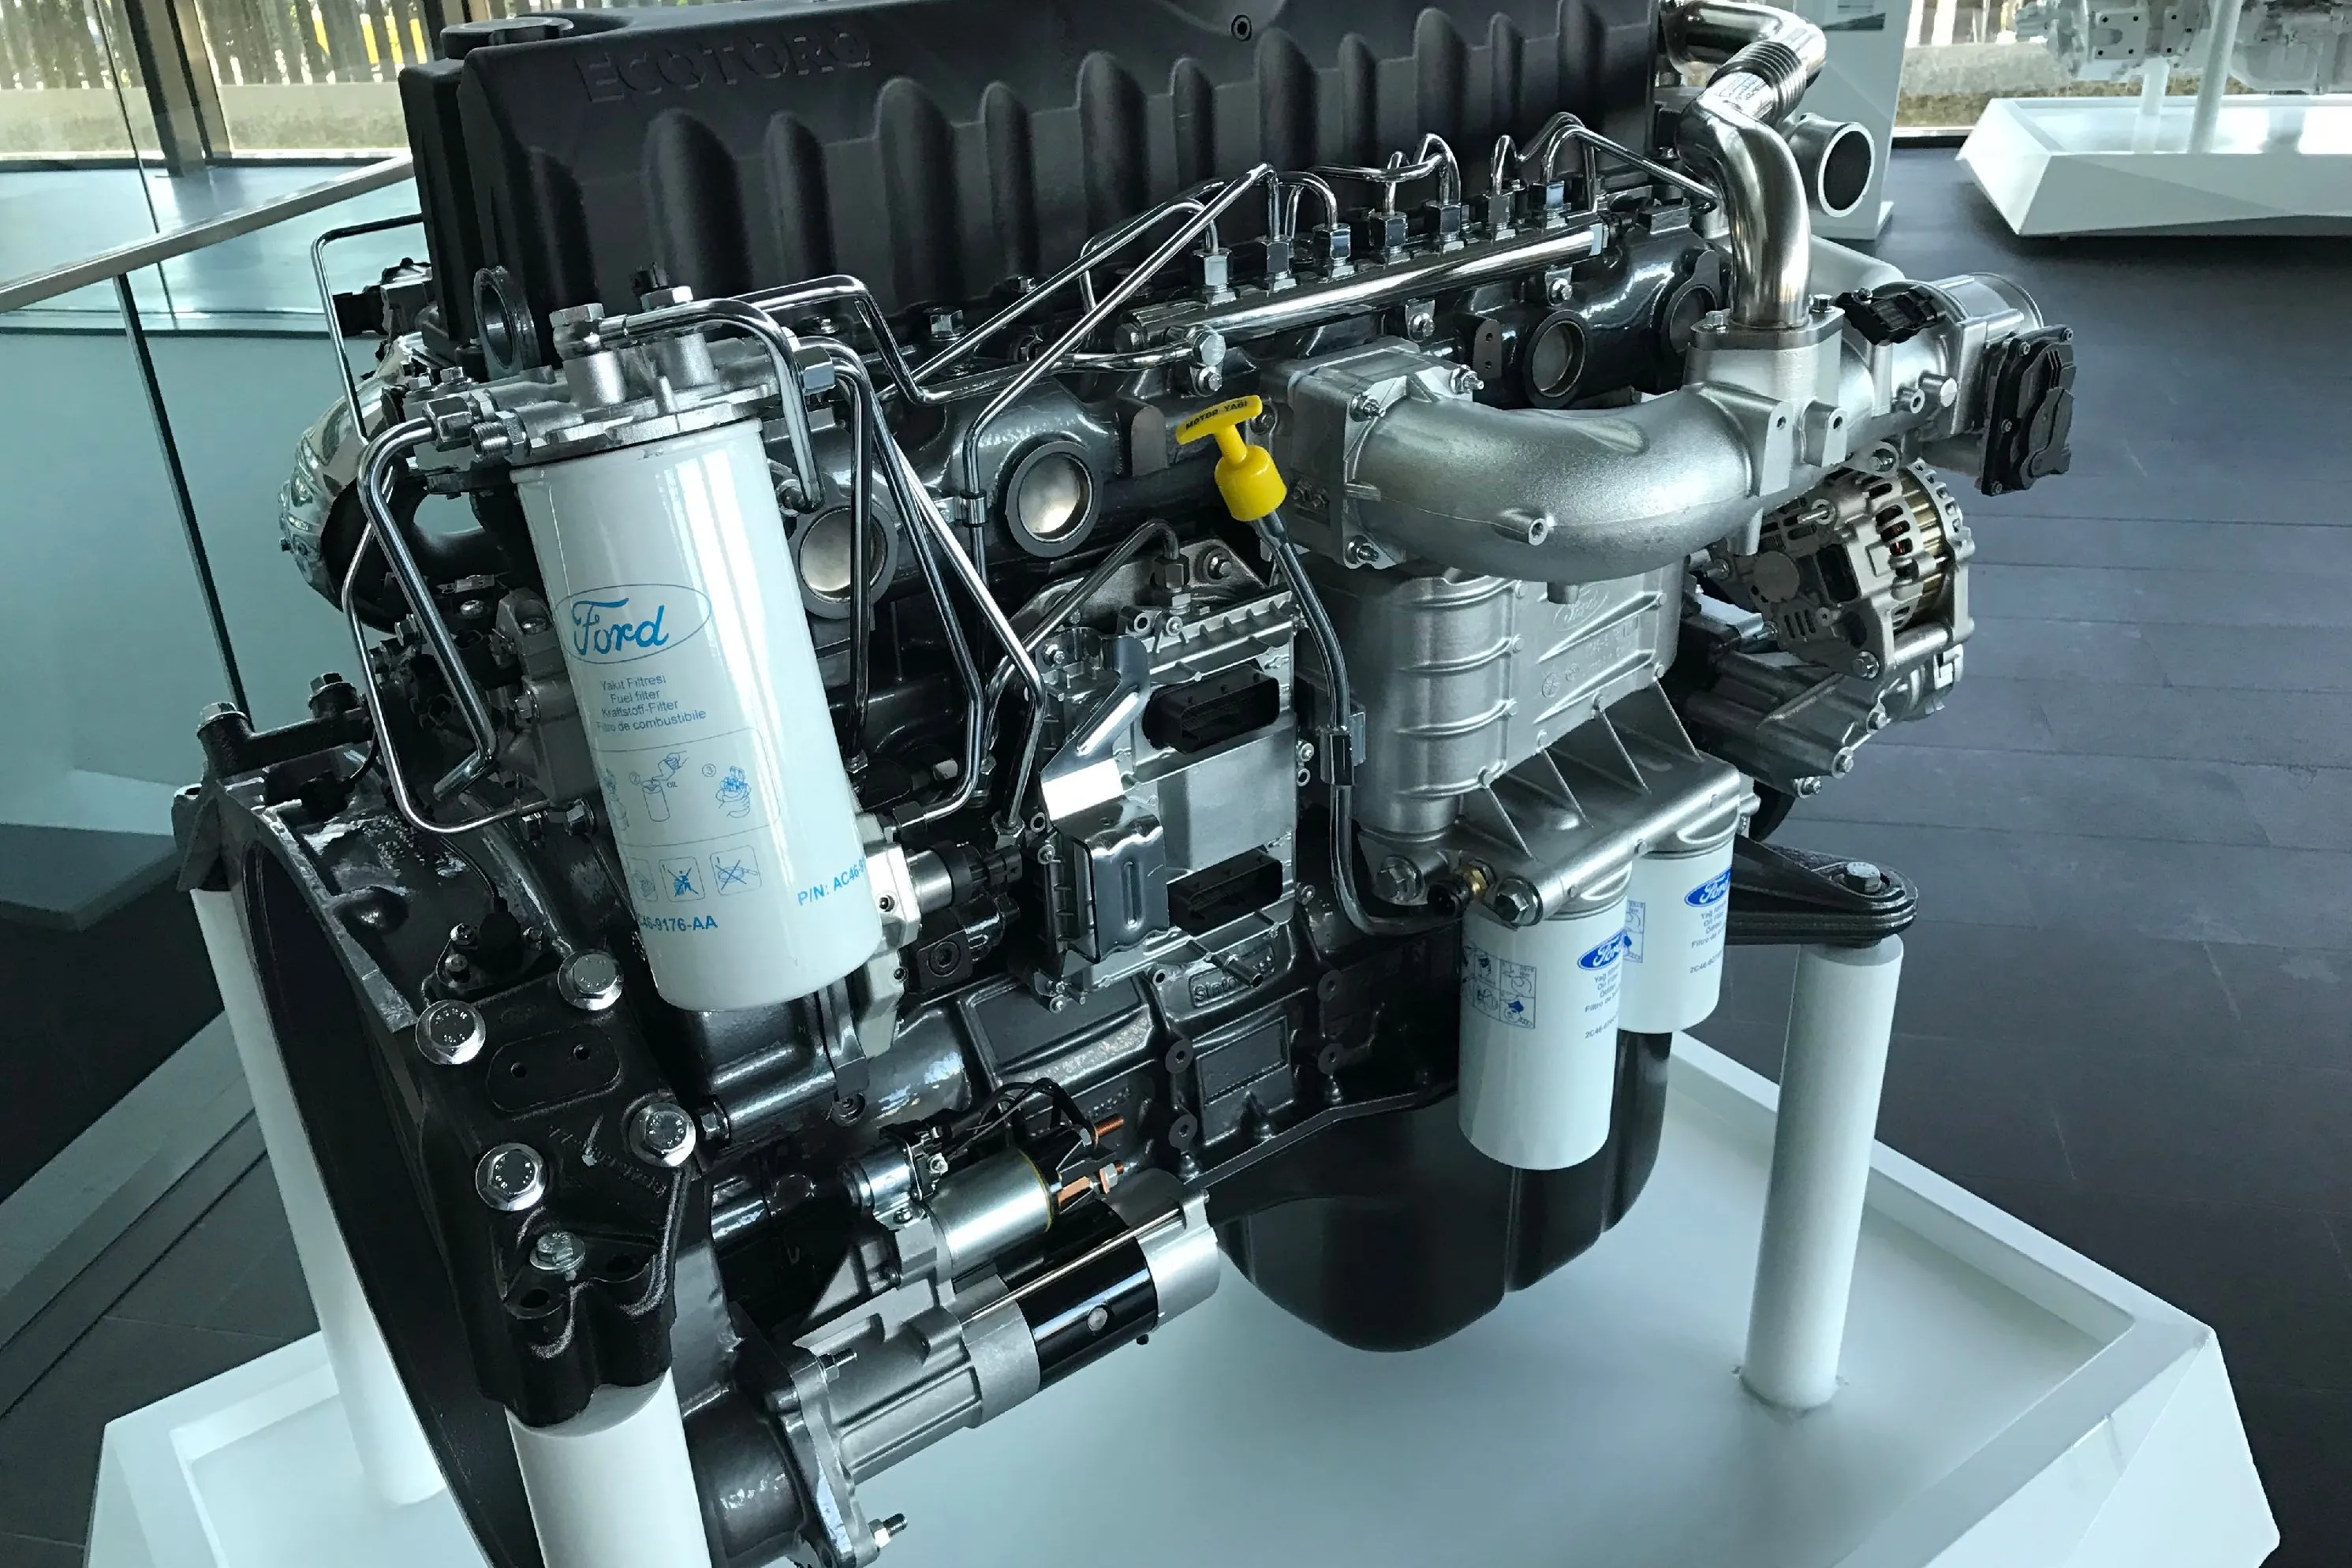
In this case, it was 2 days with a truck manufacturer in Turkey.
Who was in the room and what the two days covered: GE's UX, product management, country leader, account manager and solution architect across from Ford Otosan's CDO and its engineering, communications and cybersecurity leads. The agenda runs from goals and business challenges to use-cases, prioritization and a roadmap.
- Ford Otosan
- JV between Ford & Koç Holding · Located in Istanbul, Turkey · Center for product R&D · Heavy truck, engine, gearbox, and powertrain manufacturing
- Attendees · GE
- User Experience · Product Management · Turkey Country Leader · Account Manager · Solution Architect
- Attendees · Ford Otosan
- CDO · Process Engineering · Communication Systems · Powertrain Engineering · Cybersecurity
- Agenda · Day 1
- Goals & Objectives · GE Digital Overview · Ford Otosan Business Challenges · Customer Ecosystem · Internal Beneficiaries
- Agenda · Day 2
- Marketing and R&D · Cybersecurity · Use-Case Review · Prioritization · Platform & Product Alignment · Roadmap & Nextsteps
- Workshop report
- Download PDF · 16.4 MB
The goals board from day one, with the five goals as typed into the report beside it. Agreeing what both sides wanted from the two days came before any talk of solutions.
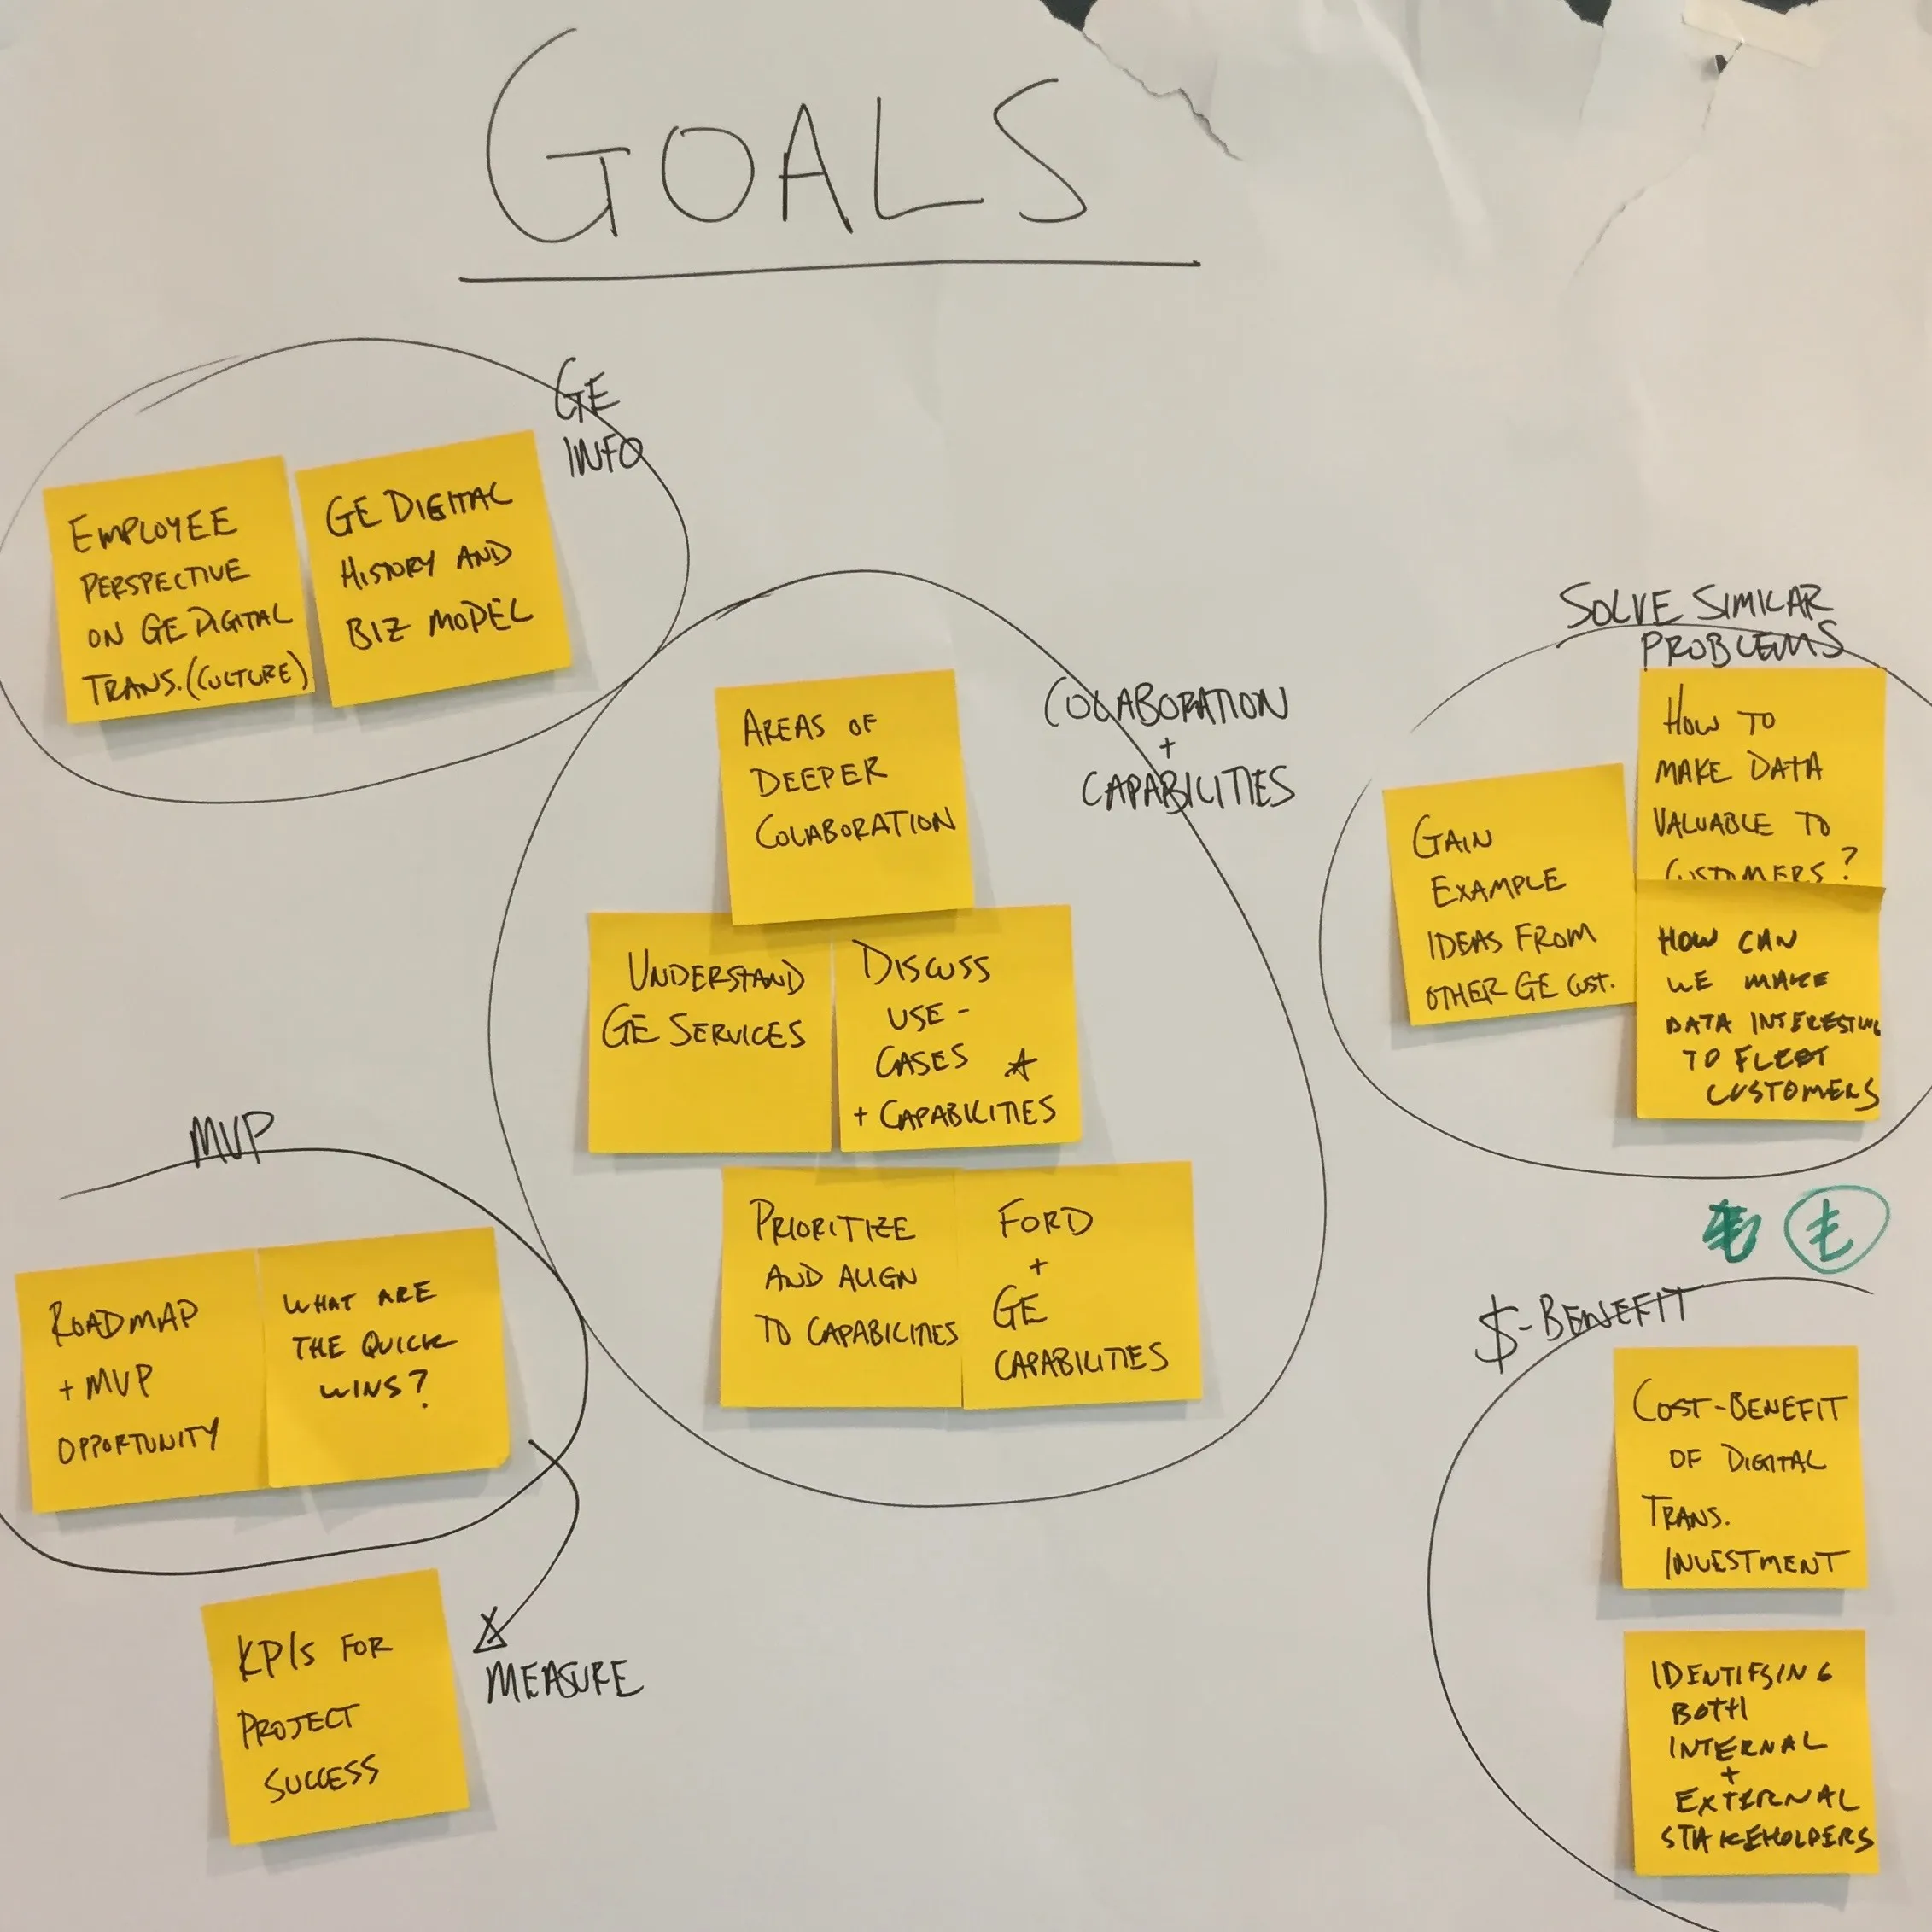
Goals
- GE Info: GE’s transformation and business model
- Collaboration: Mutual capabilities and use-cases
- Problems: Data value to fleet customers
- $-Benefit: Identify stakeholder needs
- MVP: Create a roadmap, opportunities, and KPIs
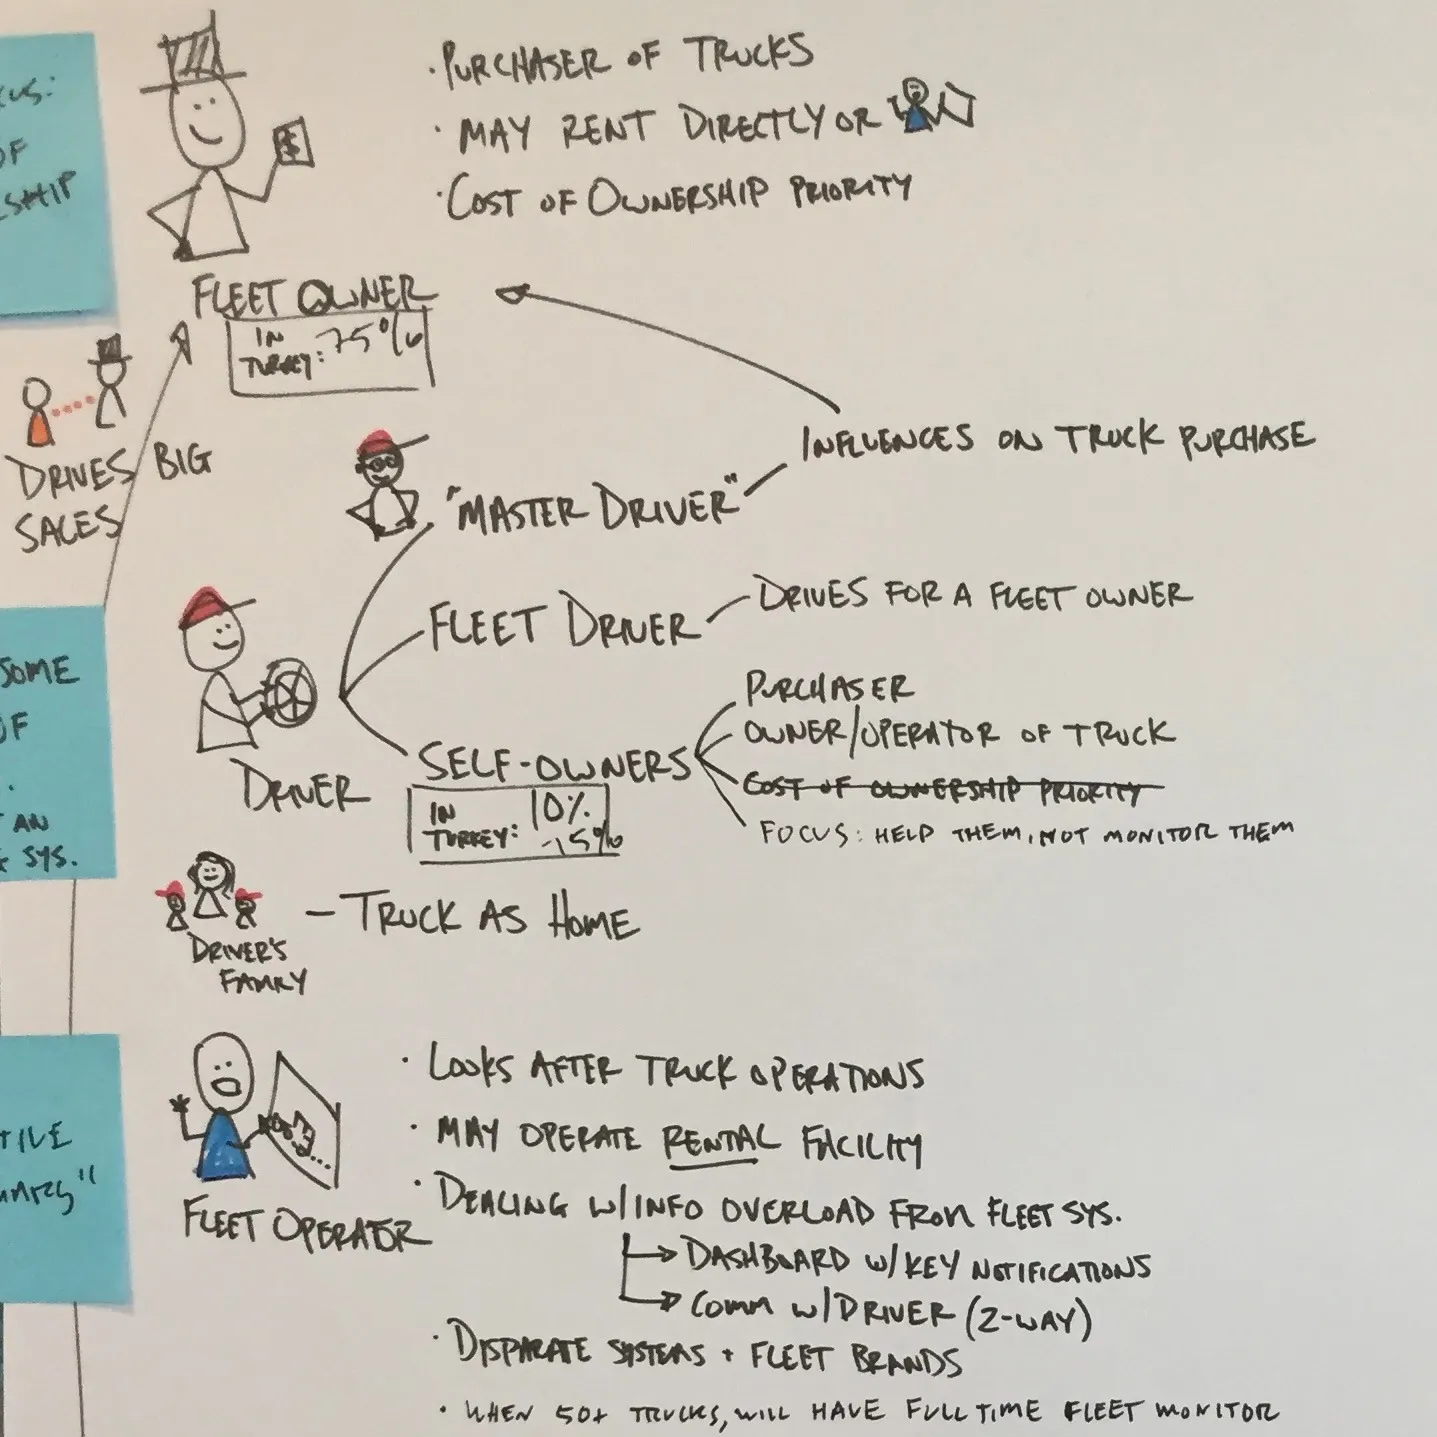
The two ecosystem sheets from Ford Otosan: the people in the domain, each drawn as a doodle-person icon with notes, then the scenarios that connect them. Drawing the people first makes a large amount of information holdable at a glance.
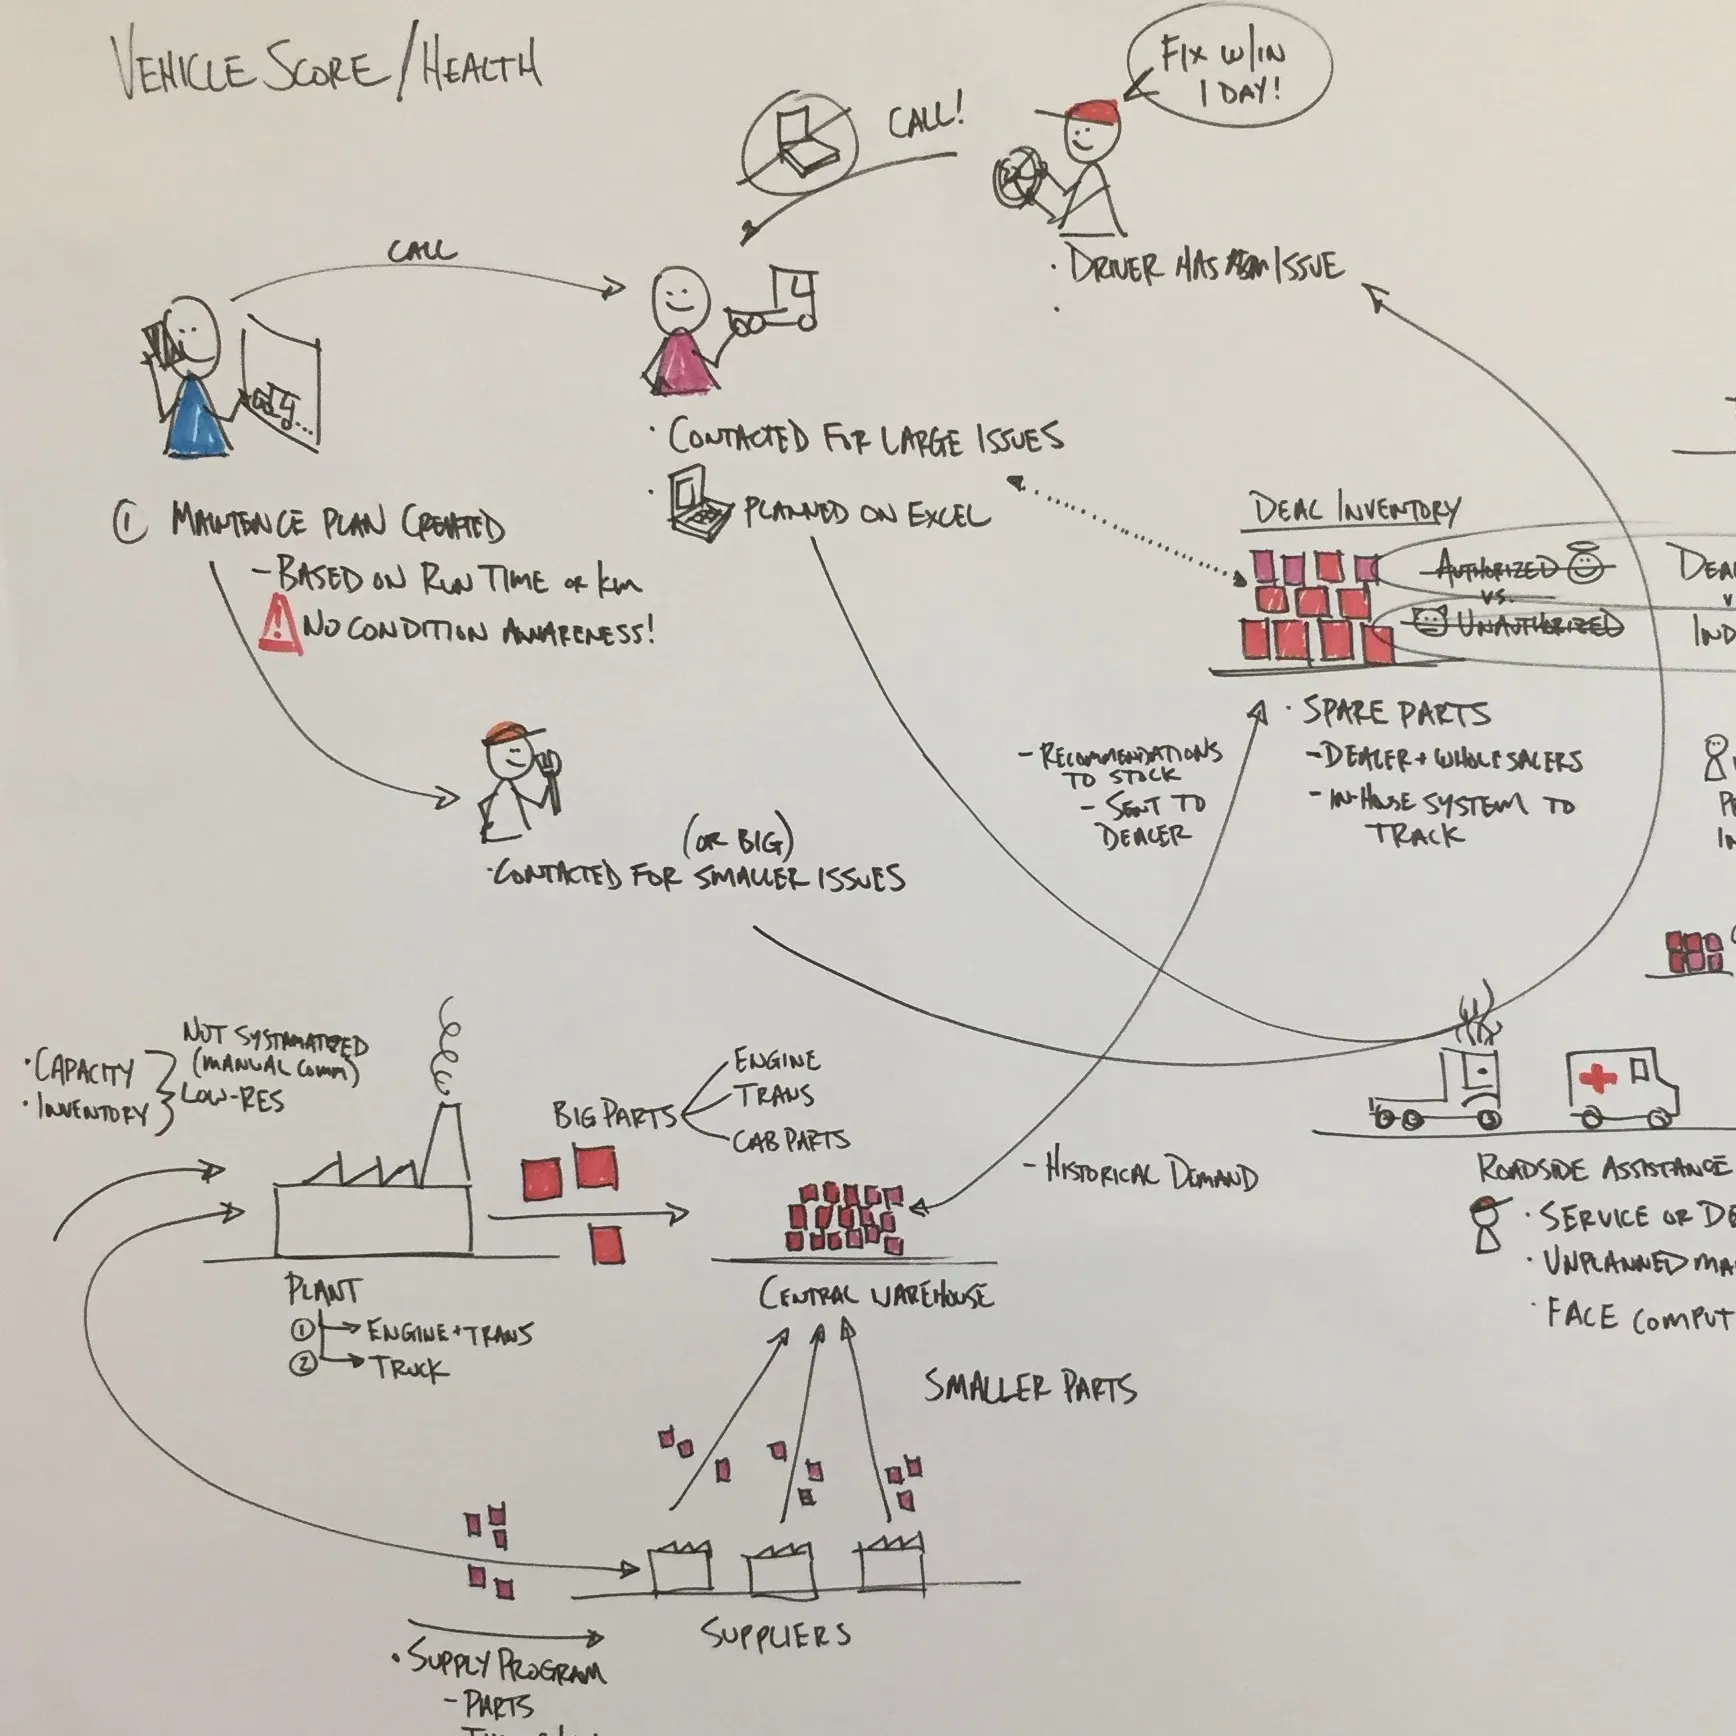
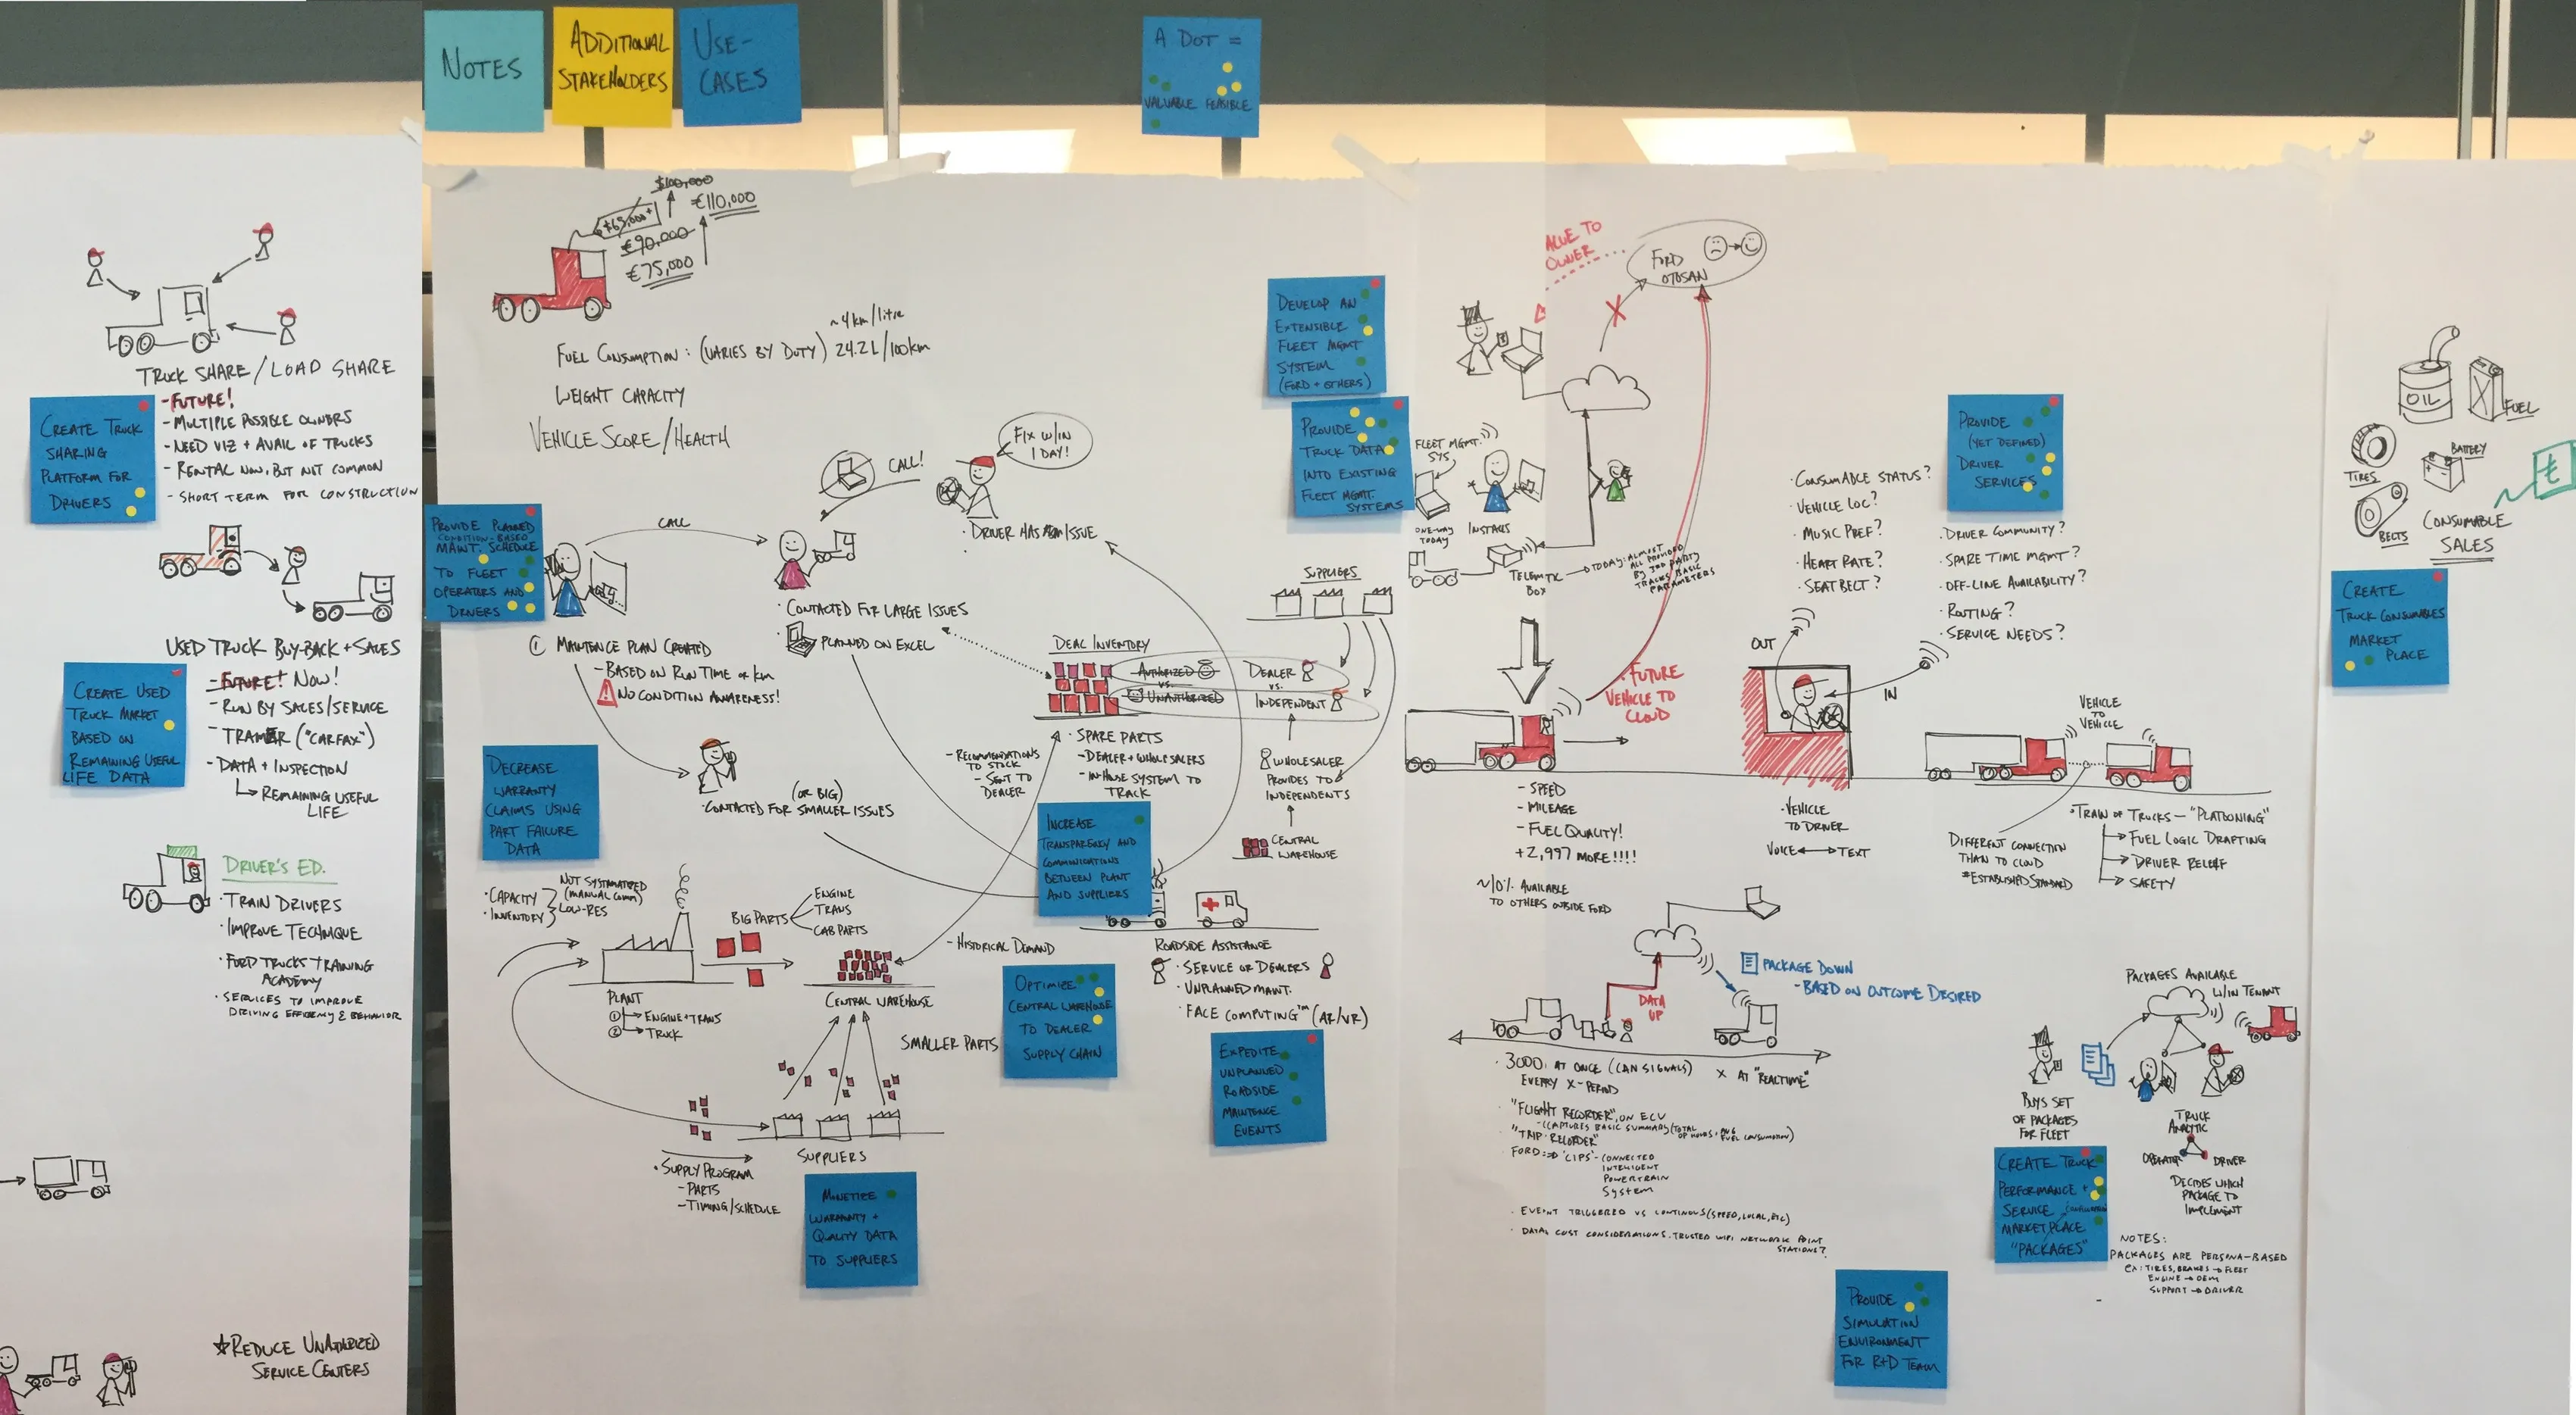
The whole use-case wall and three details. The use-cases were written on blue notes and placed on the ecosystem map where they belonged, so each sat in its context; the three shown ranked first, second and third in the vote.
 123
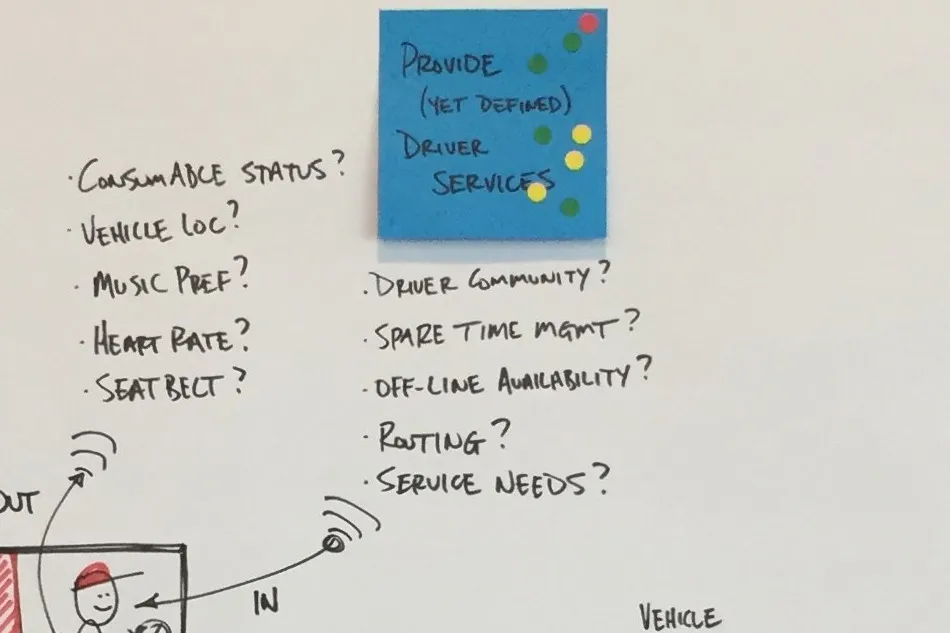 1
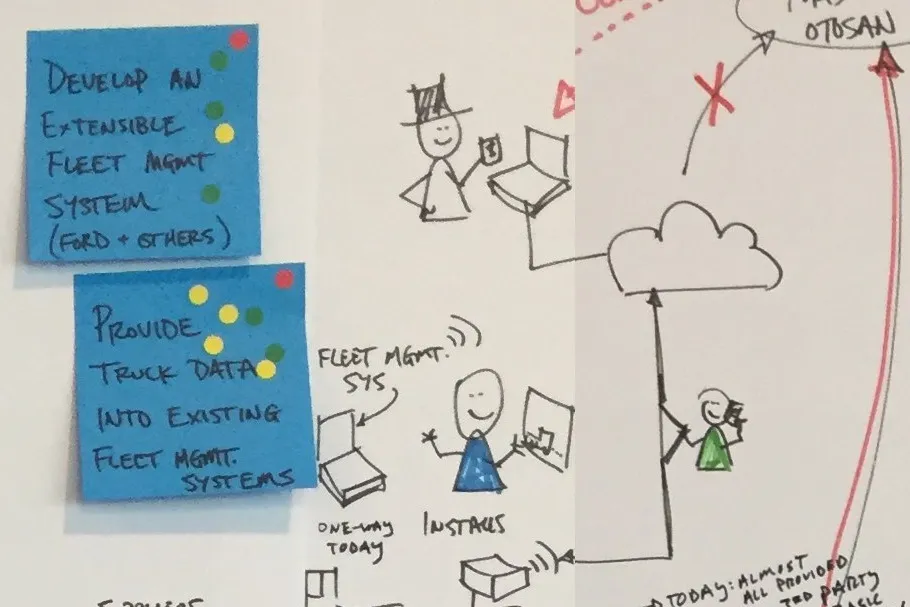 2
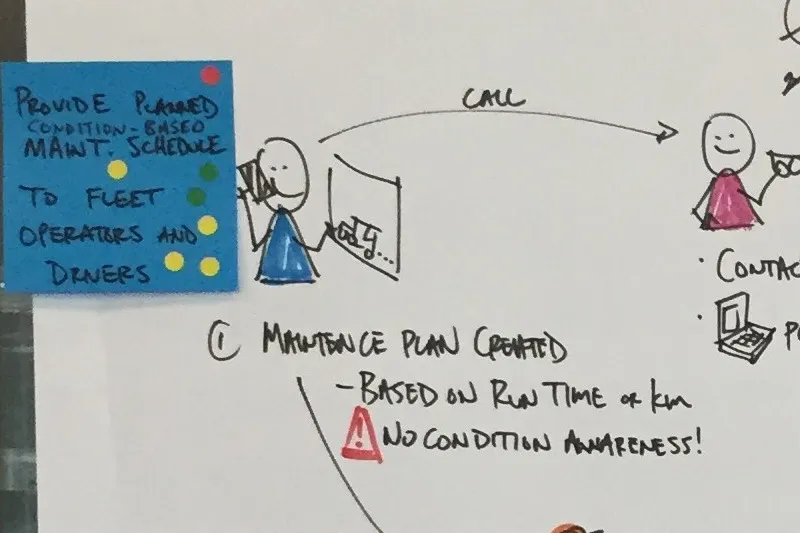 3
The prioritization board: fifteen use-cases placed by value and feasibility and dot-voted by the room, the top twelve transcribed in the ranked order. The vote was the room's, not mine; my job was to structure it so a ranking came out.
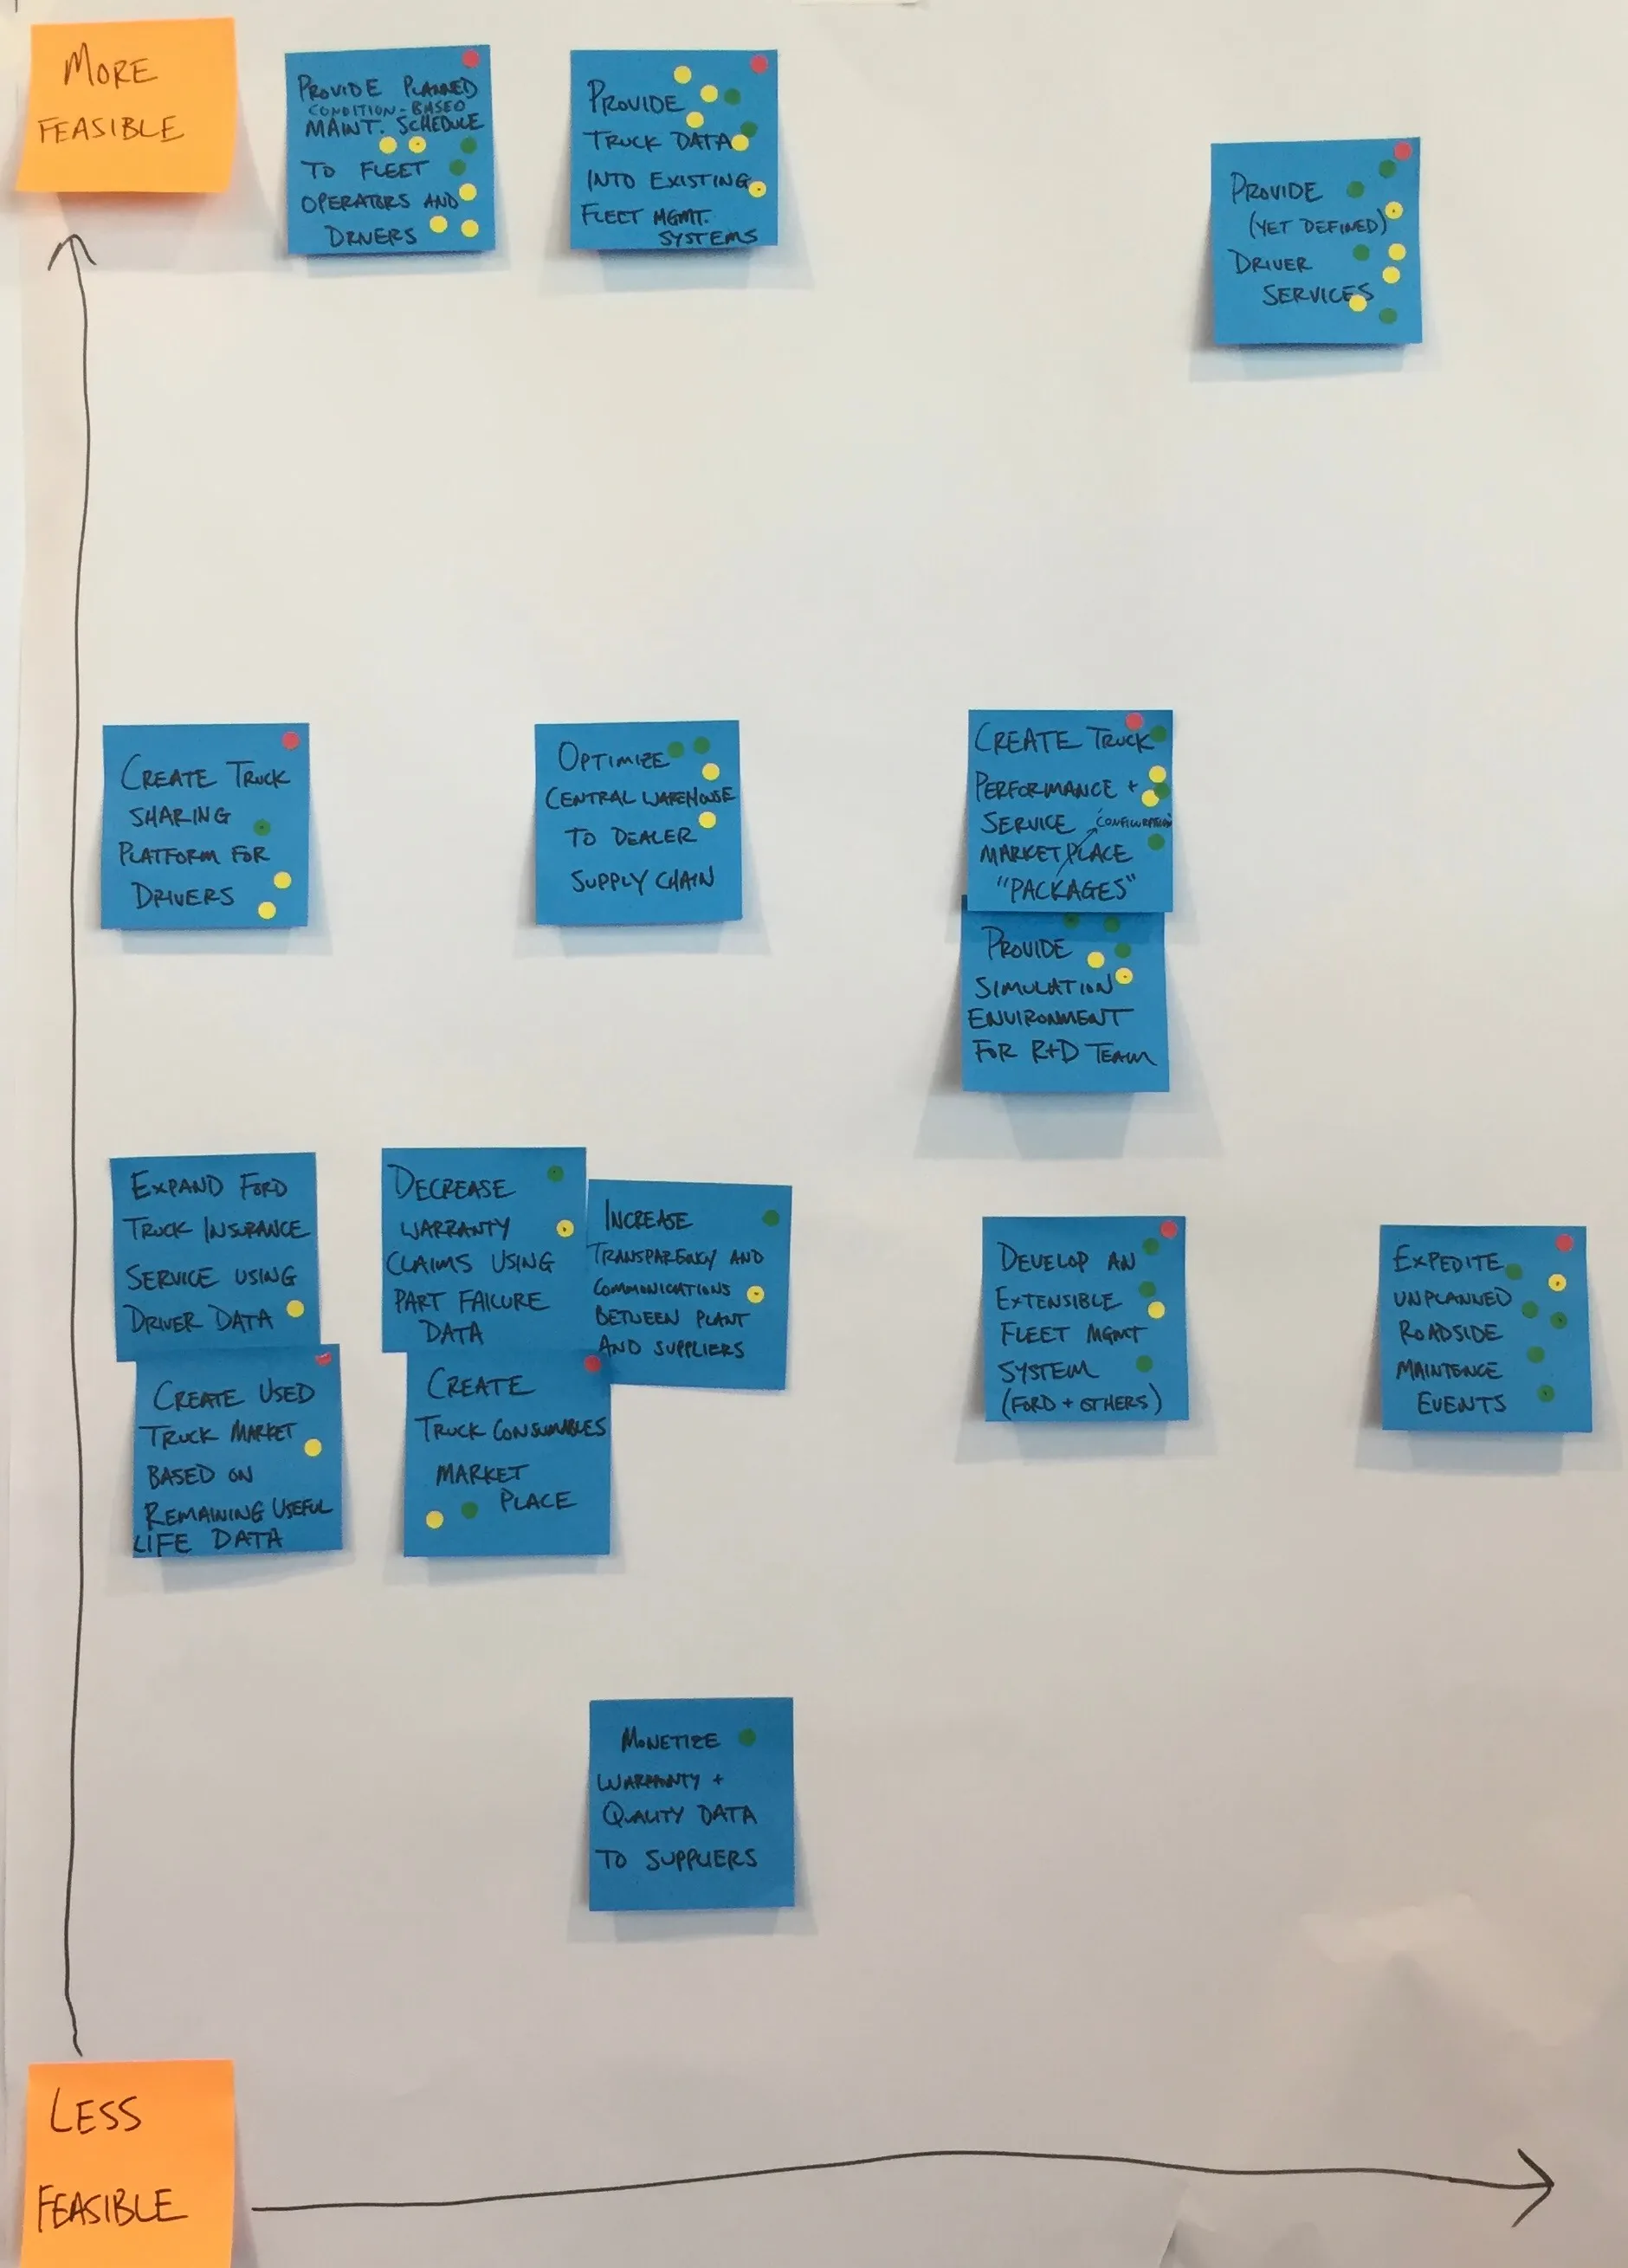
Transcribed
- Provide driver services.
- Provide truck data into existing fleet mgmt systems.
- Provide condition-based maintenance to fleet operators.
- Create performance + services package marketplace.
- Provide simulation environment for R&D team.
- Optimize supply chain from central warehouse to dealer.
- Create truck sharing platform for drivers.
- Expedite unplanned roadside maintenance events.
- Develop an extensible fleet mgmt system (Co + others).
- Increase transparency and communications between plant and suppliers.
- Decrease warranty claims using part failure data.
- Create truck consumables marketplace.
The connected plan I produced after the workshop: the top five use-cases as work streams with their outputs, dependencies and decision points over the following months. The report packaged this with the proposal, so the design and development resourcing could be argued for.
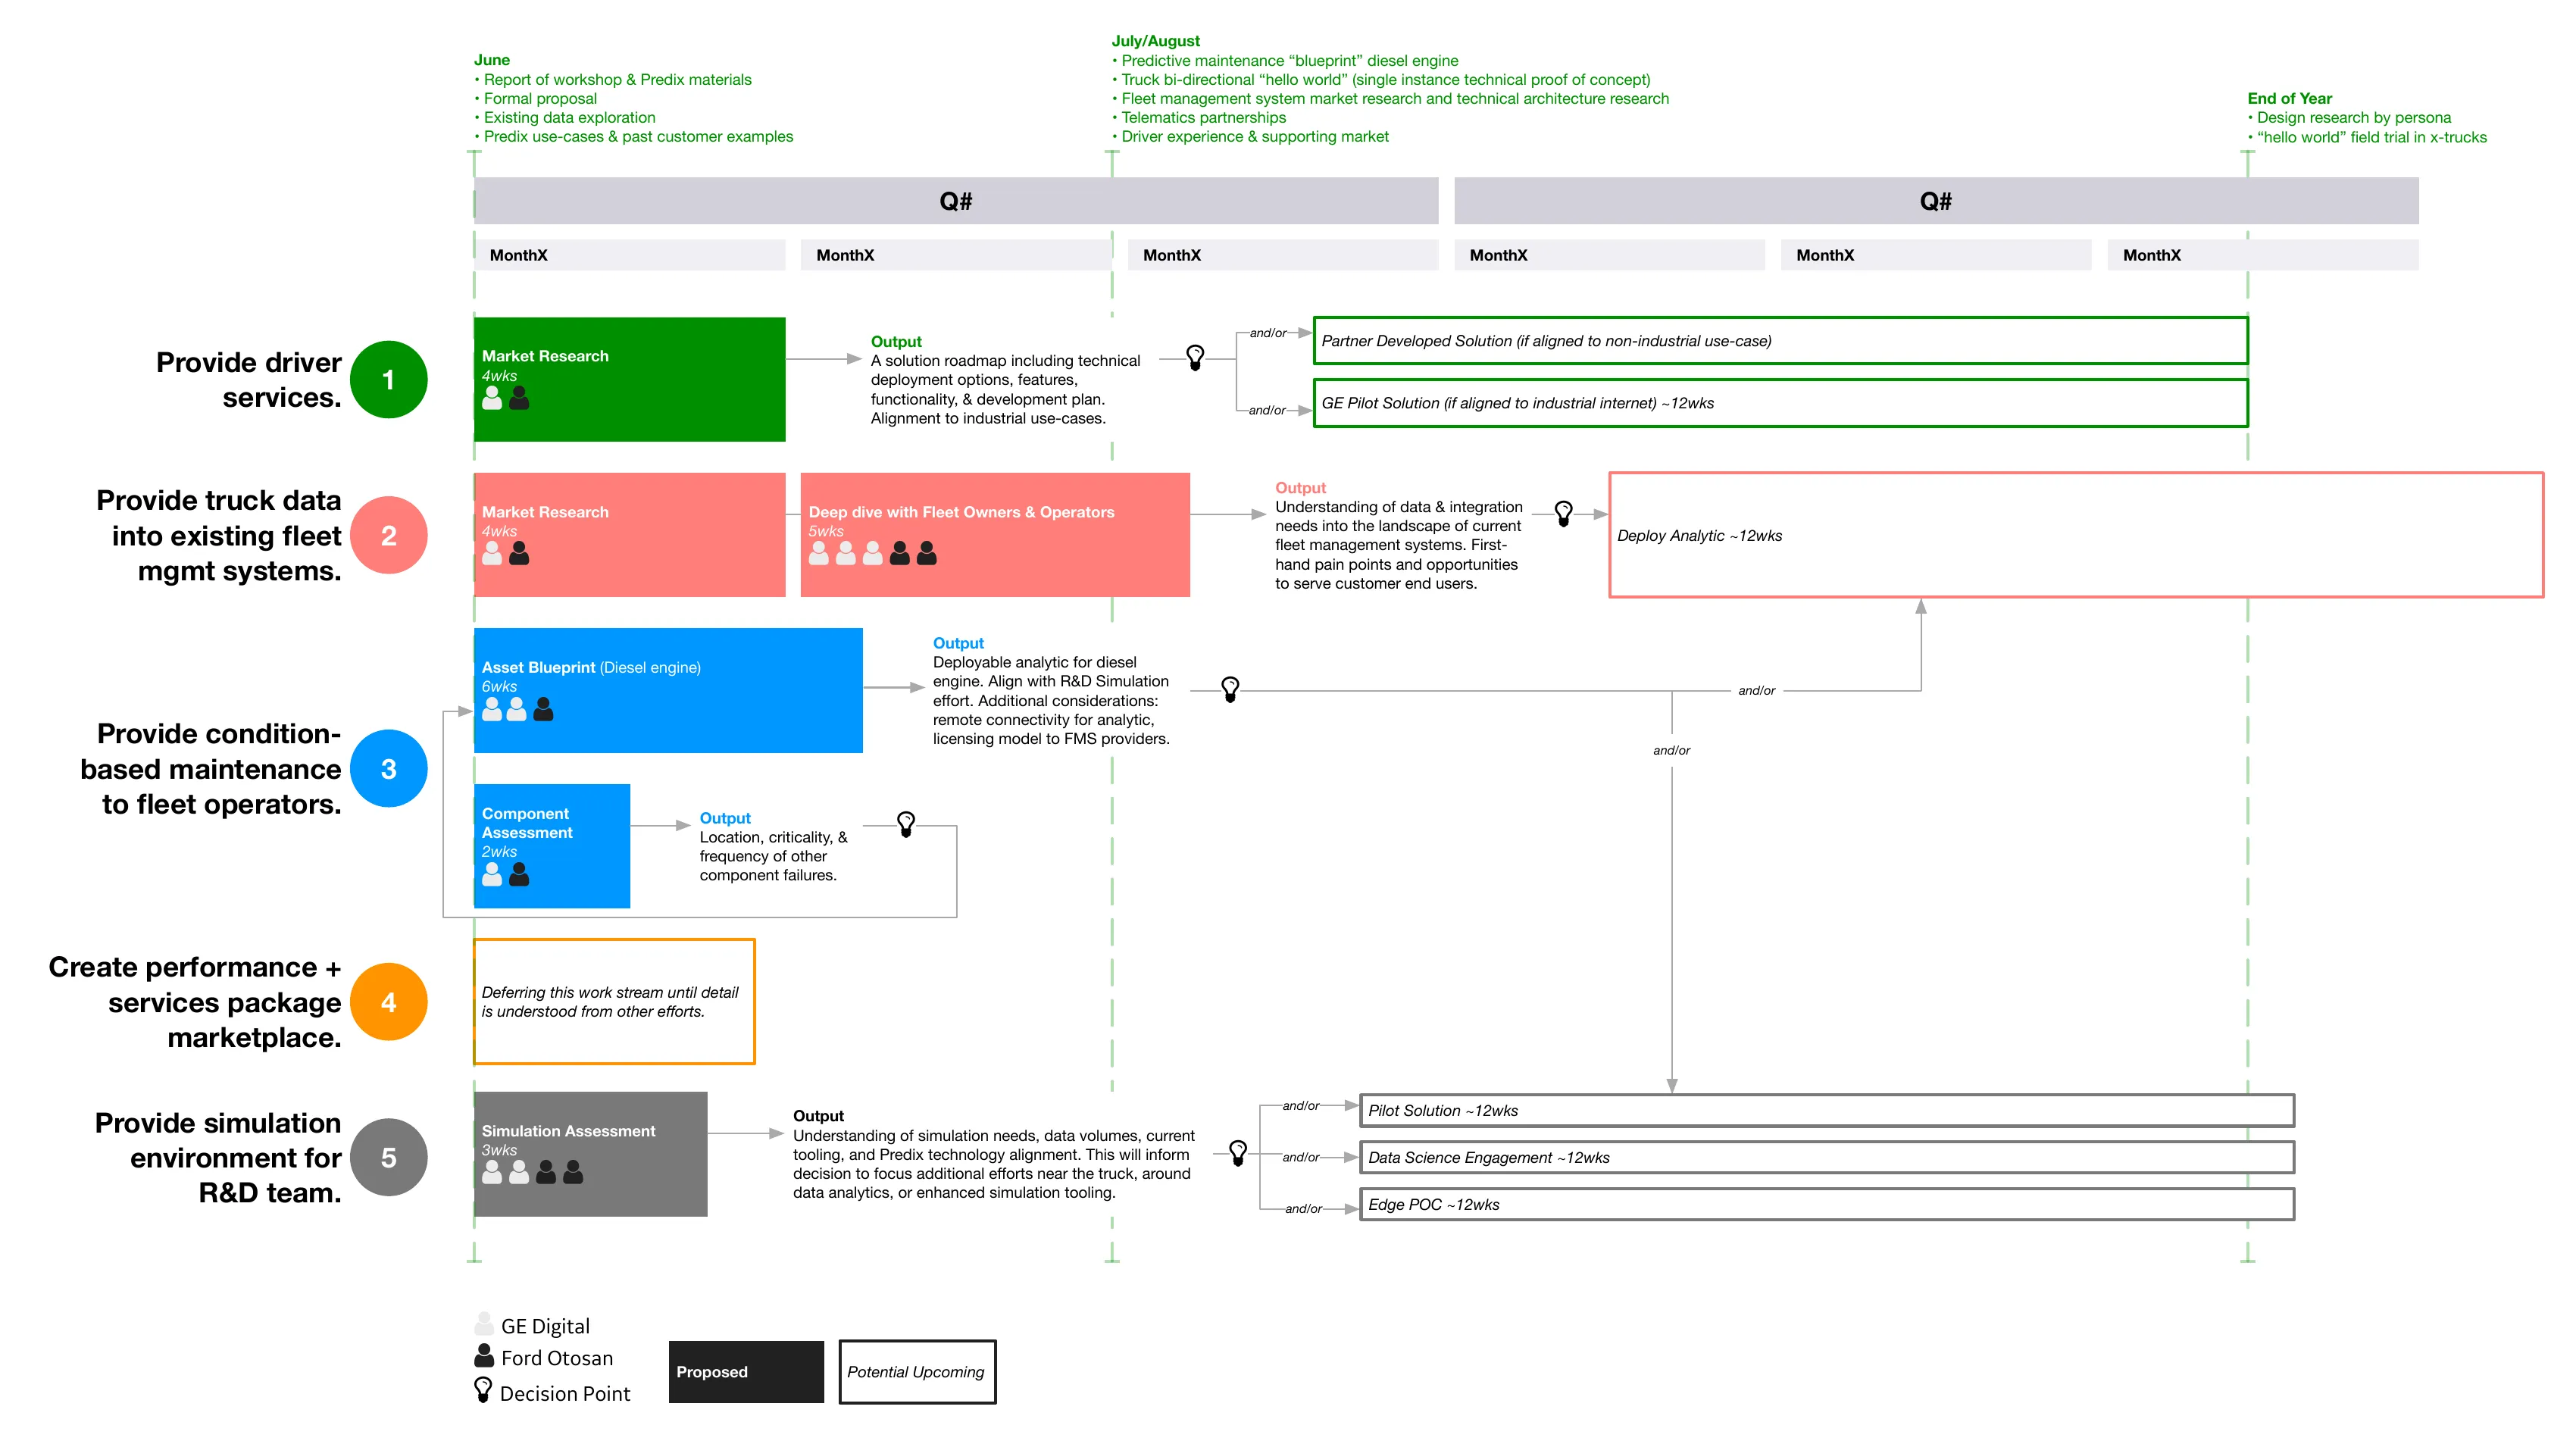
I aligned use-cases and their inter-dependencies. The workshop report is packaged to complement the formal proposal and inform additional design and development resourcing requirements.
Example 1: Pitney Bowes
The first example: print process optimization with Pitney Bowes, which became the first application publicly deployed on Predix. The screen is the Clarity Advisor product; the figures are the machine efficiency and yield gains it reported.
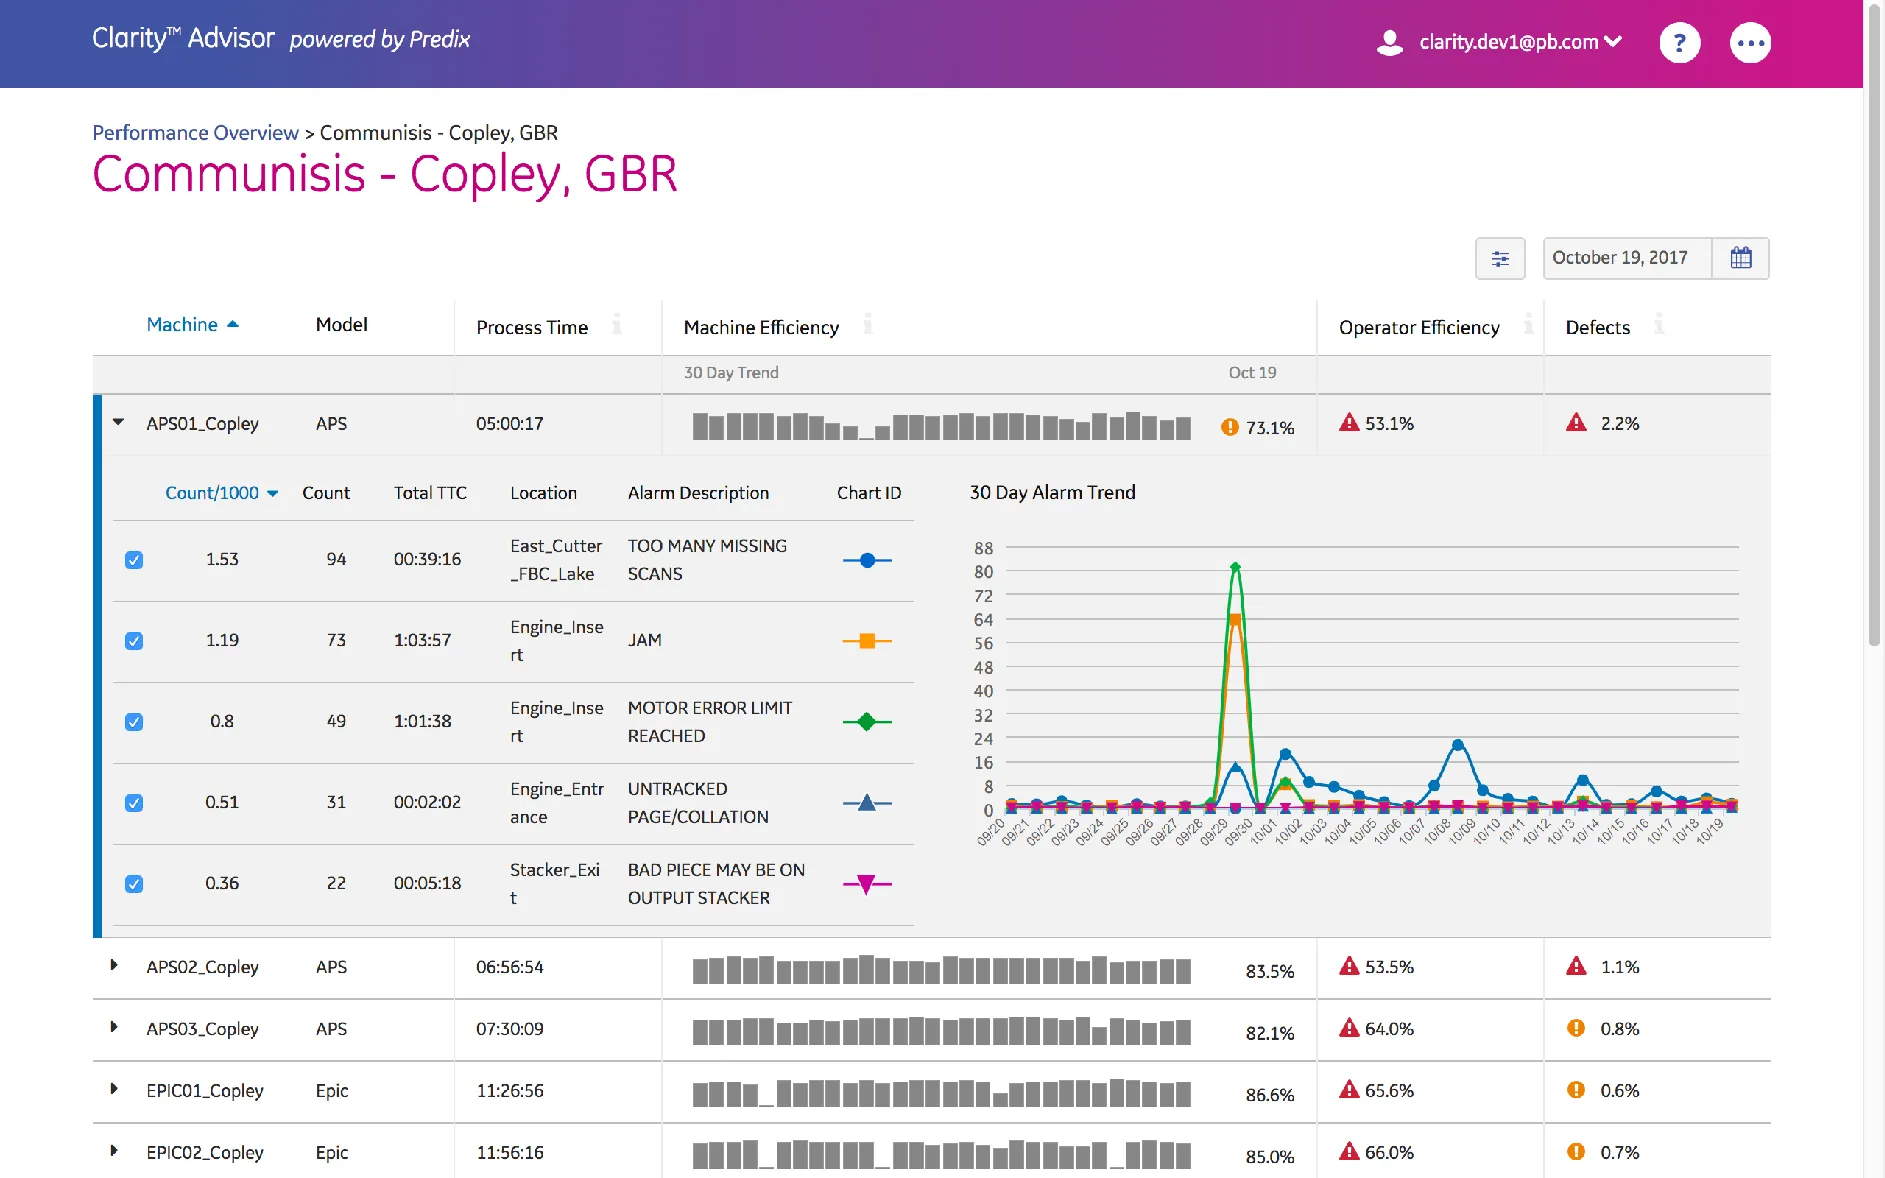
Print Process Optimization
- First application publicly deployed onto Predix
- +10% Machine Efficiency
- +20% Machine Yield
- Mail: Print, Insert, Sort
- Outcome: Maximize SLA fulfillment
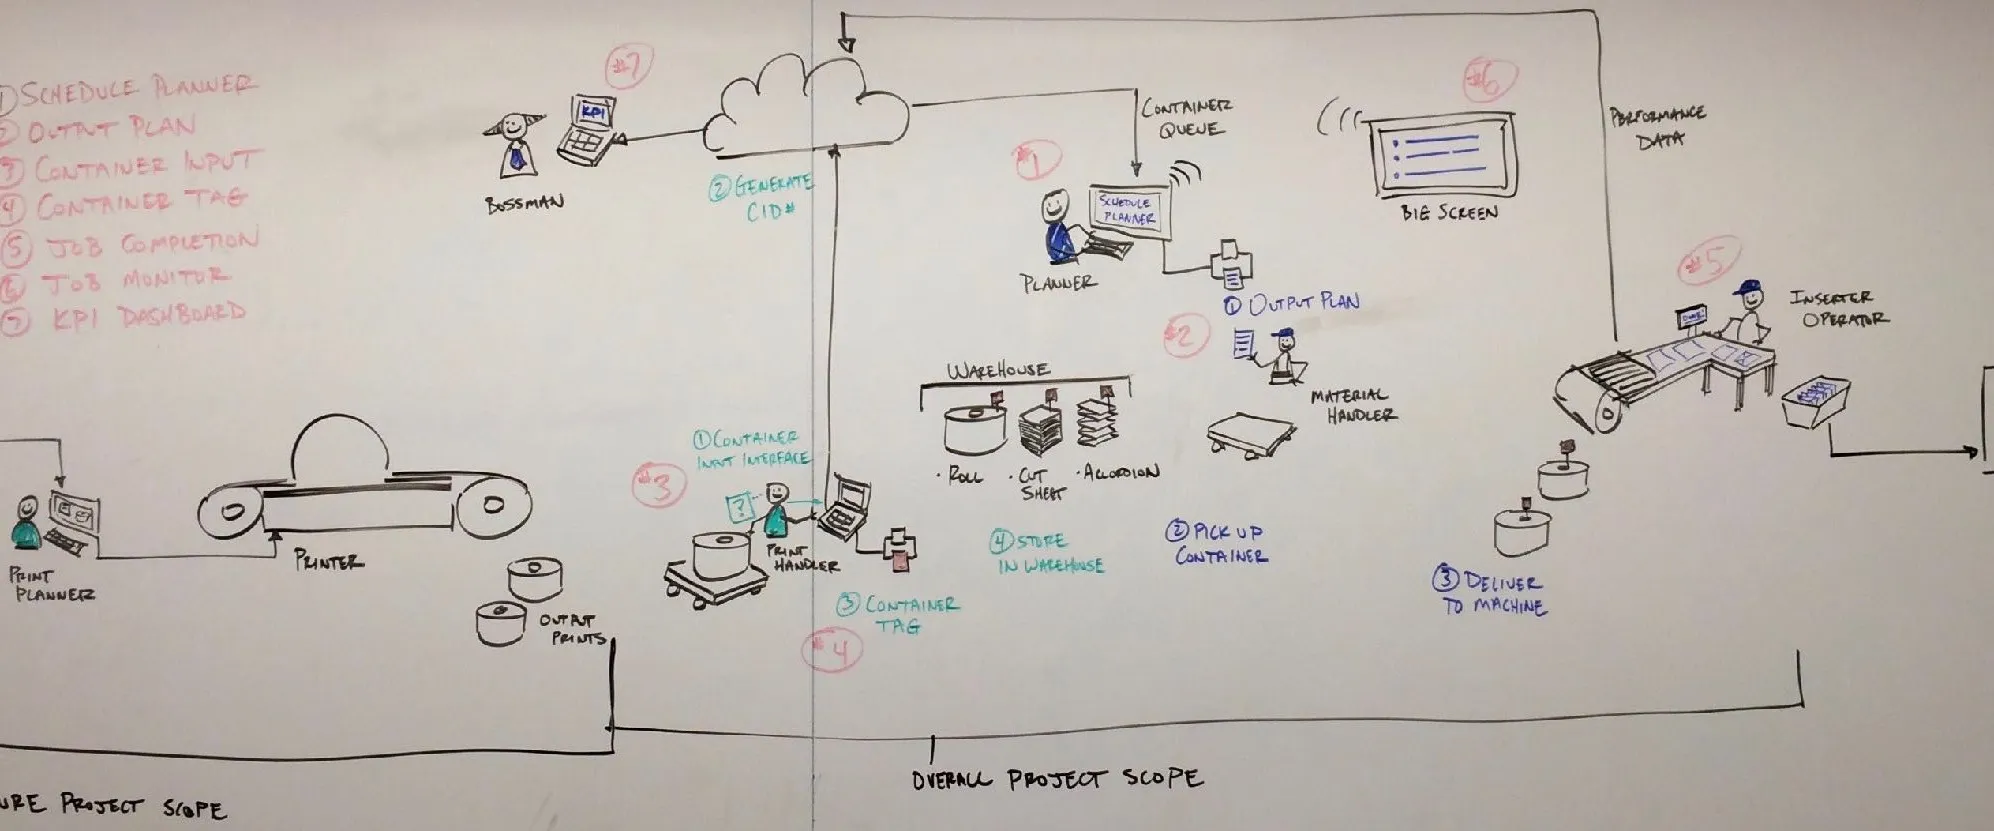
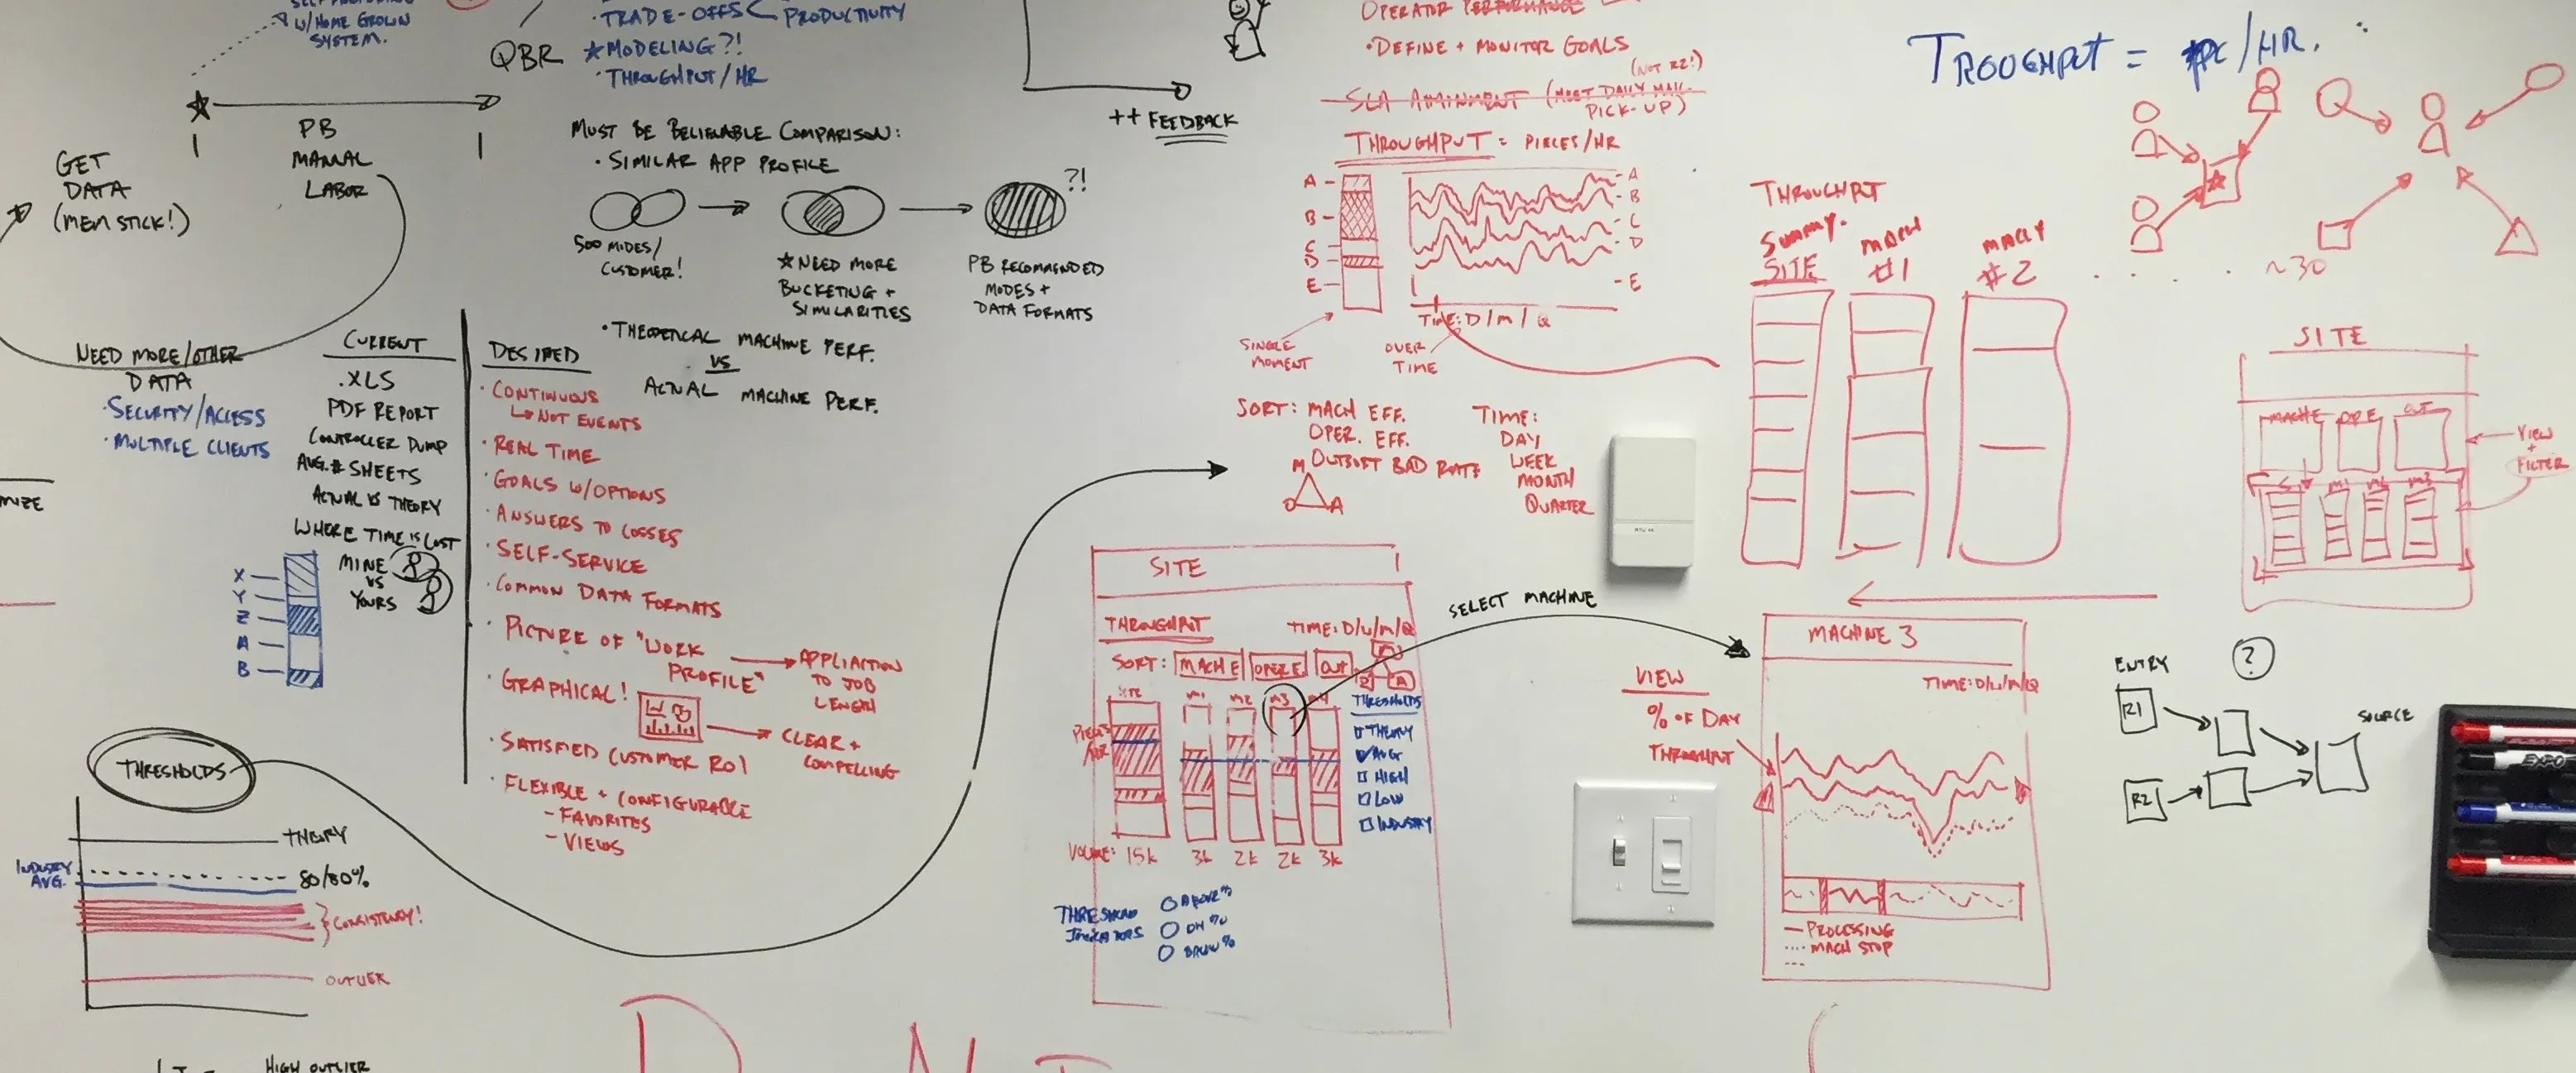
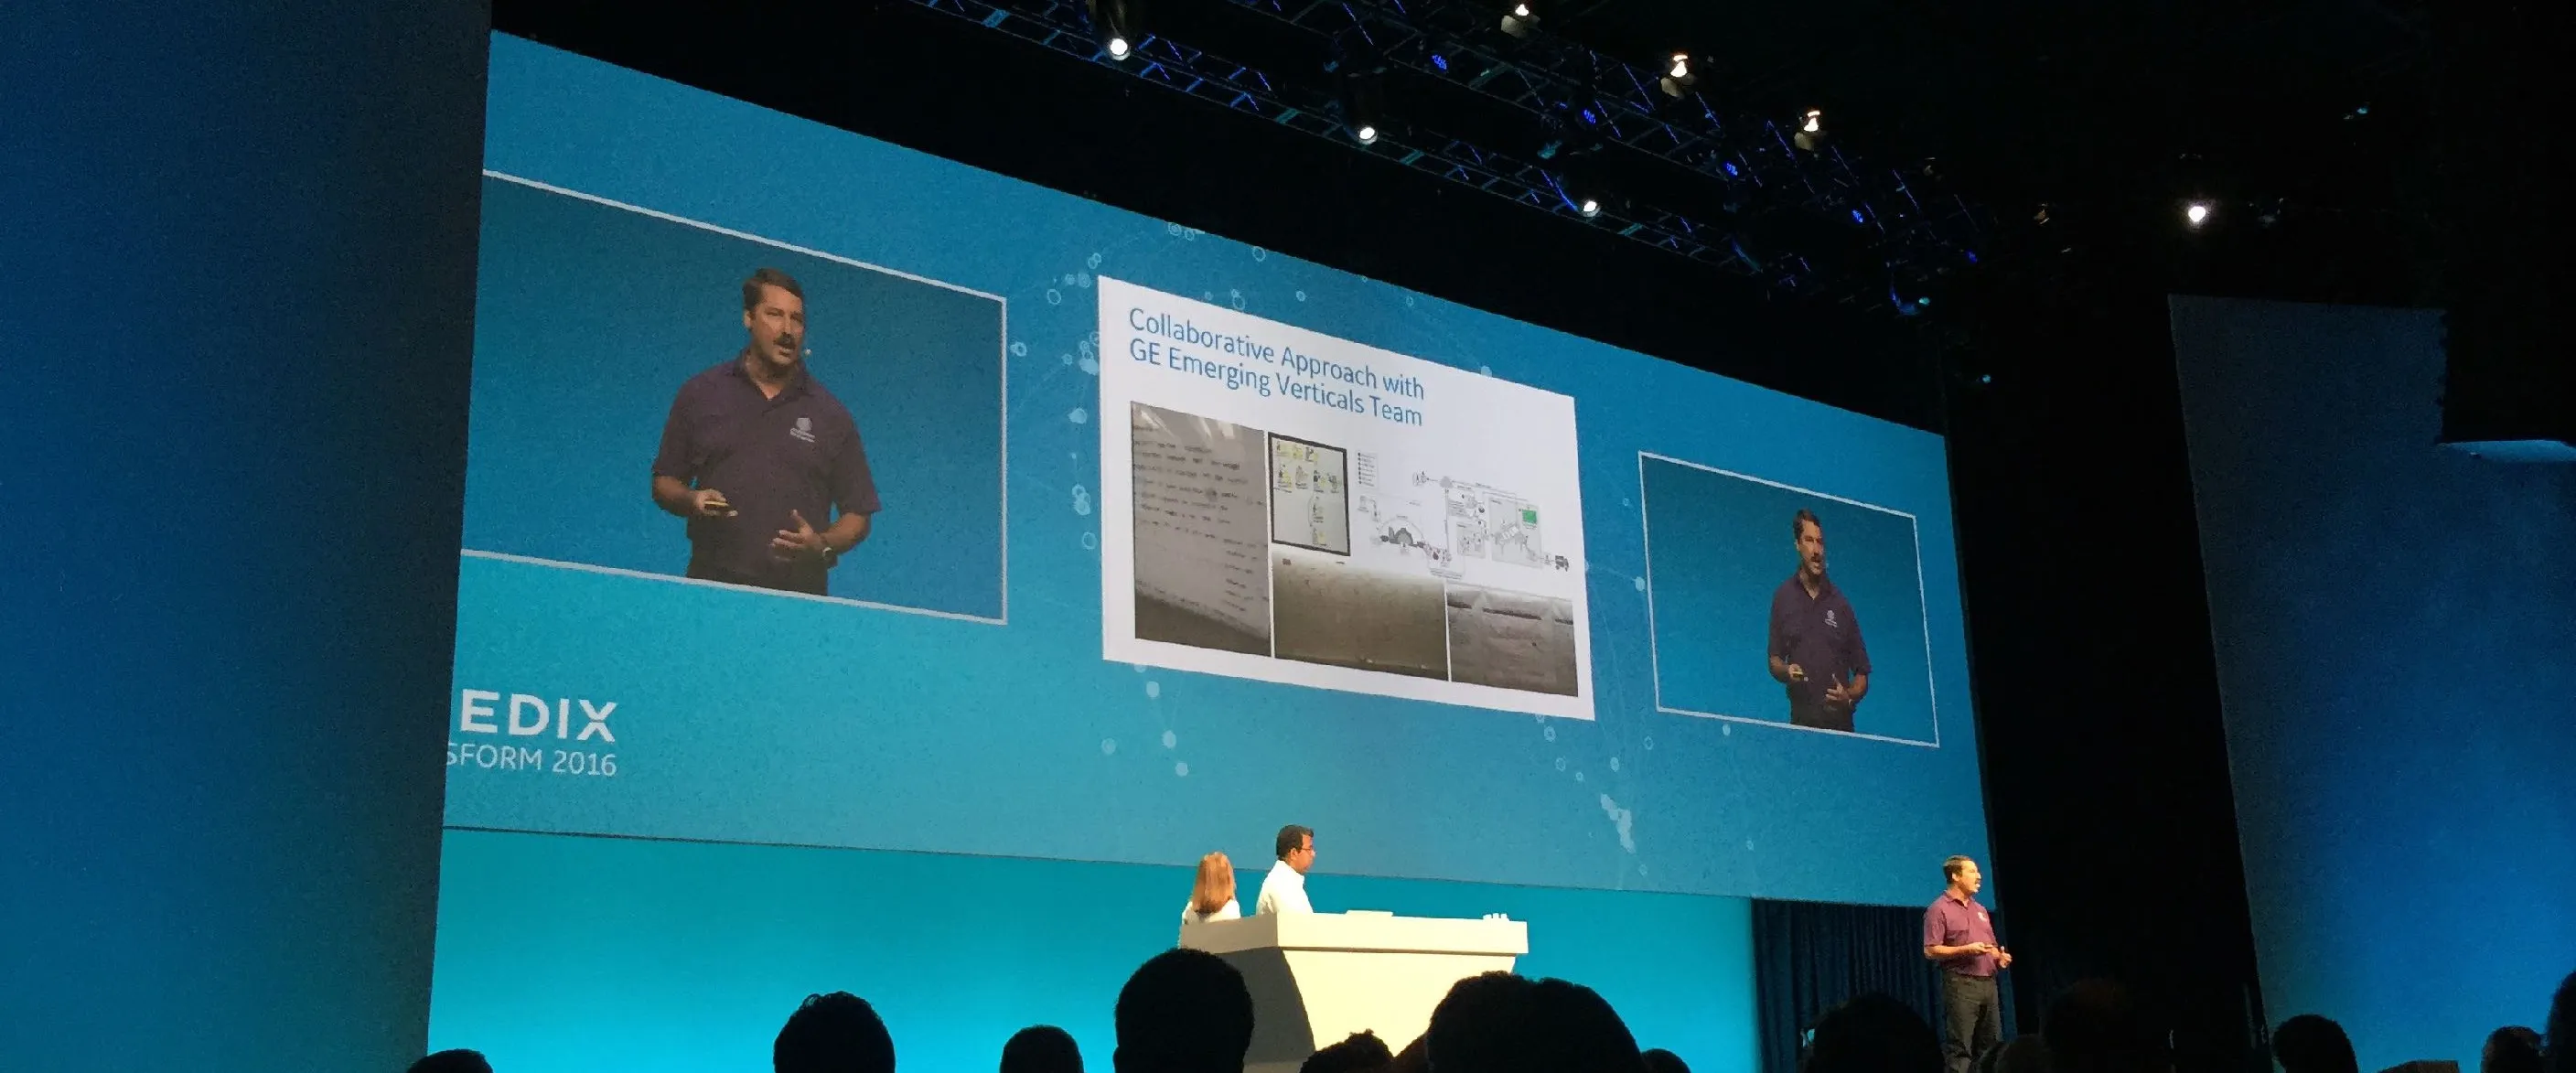
The working material behind the print example: the mail process drawn as one line from planner to inserter, the discovery whiteboard with the first product screens sketched on it, and the work presented on the Predix Transform stage in 2016.
Example 2: Lixil
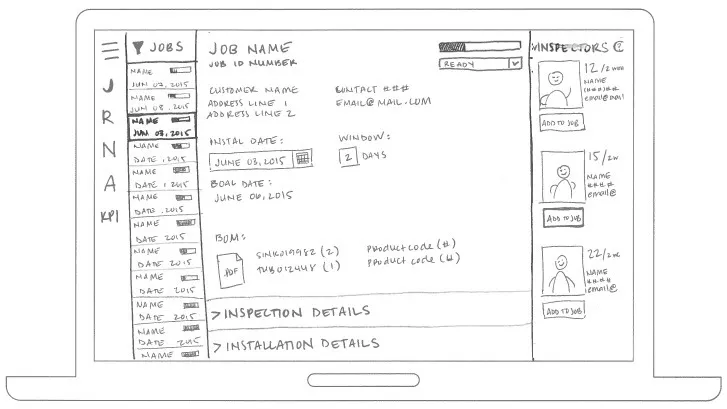
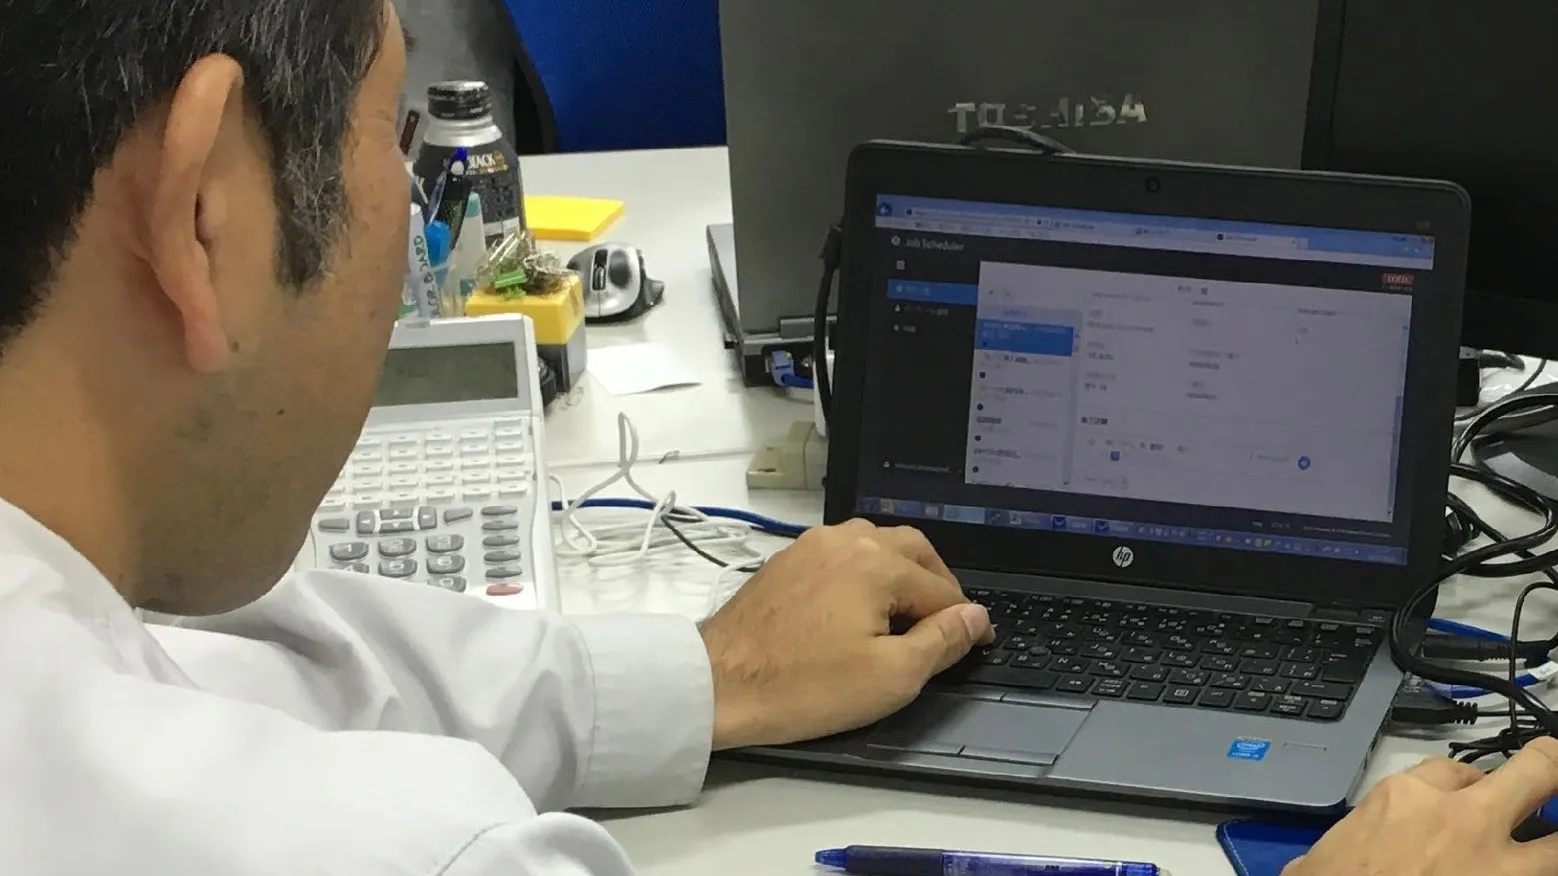
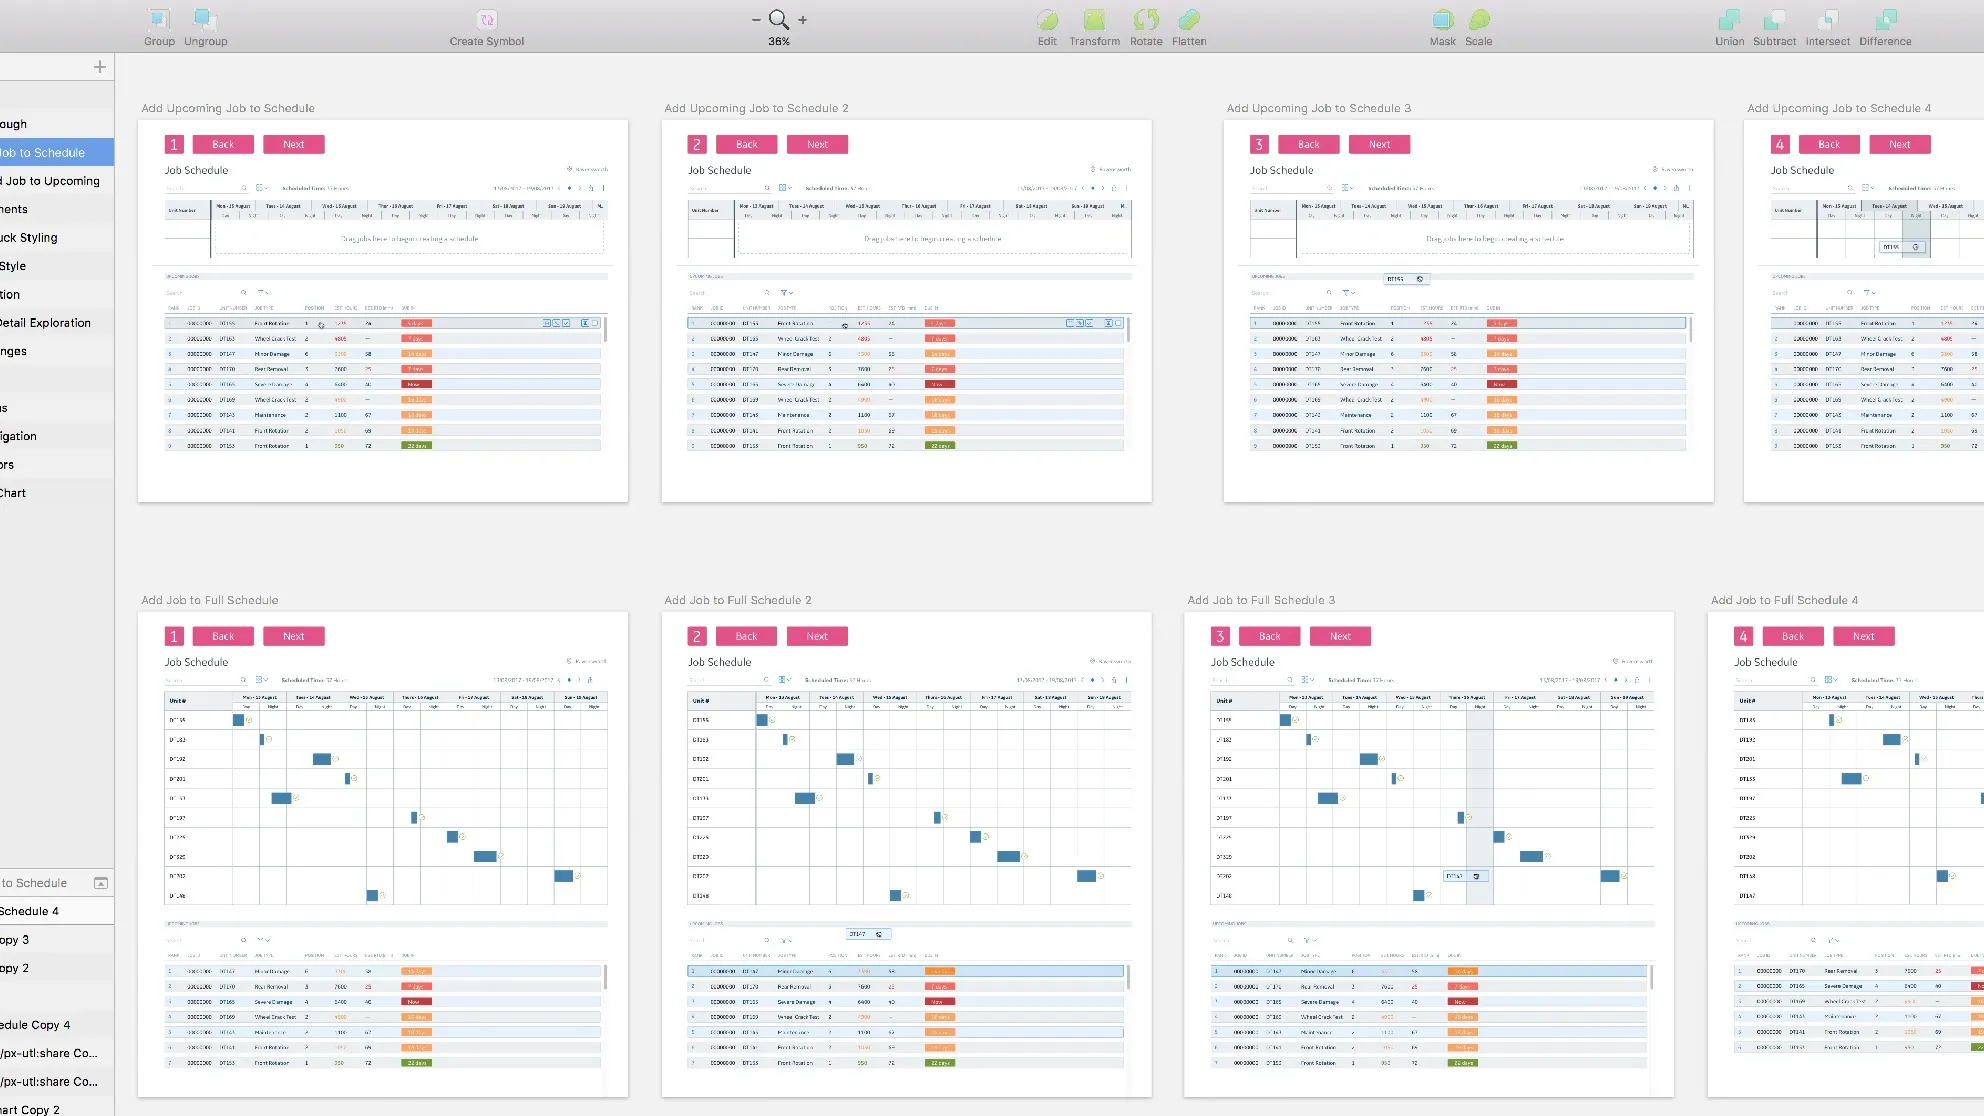
The second example: construction service scheduling with Lixil in Japan, where the team stayed engaged from pre-sales through eight releases. The wireframe is the Job Scheduler; the figures are the scheduling accuracy and cost reduction it reached, and the original users stayed in the decisions throughout.
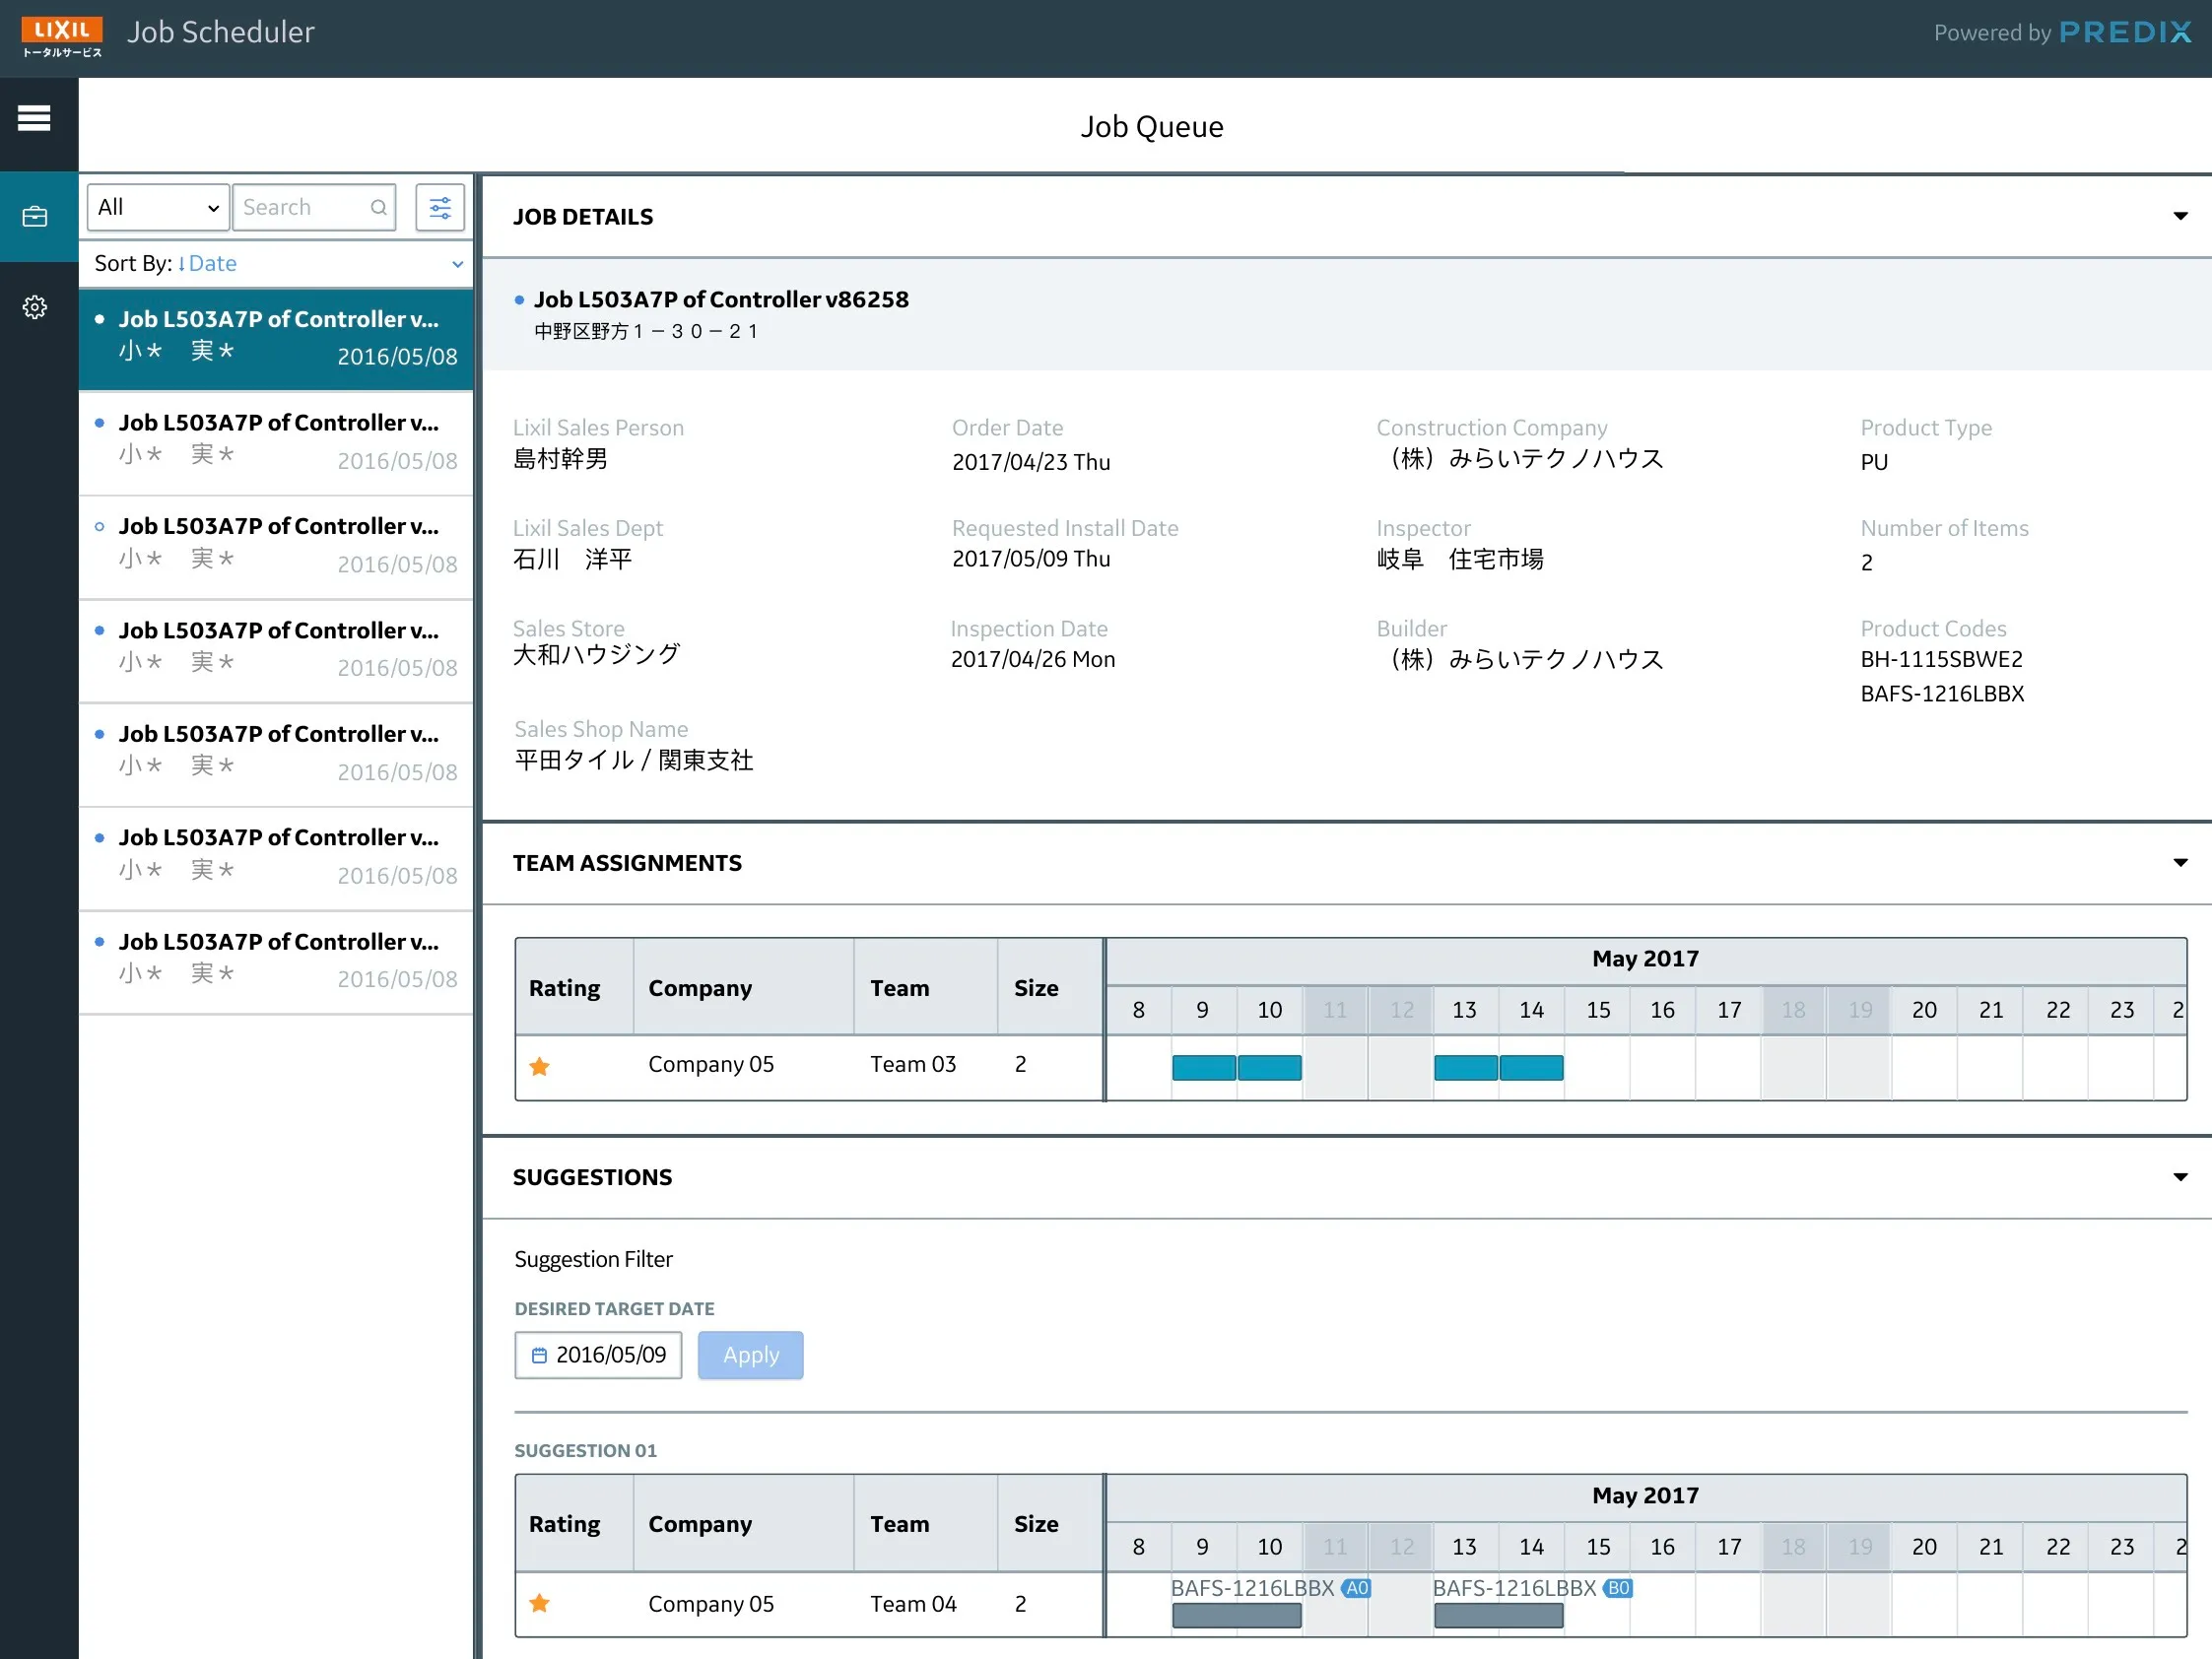
Construction Service Scheduling
- Team engaged from pre-sales through delivering 8 releases
- 90% scheduling accuracy
- 85% cost reduction
- Outcome: Align job parameters to matched installation teams
- Validation: Keeping original users involved in decision making through/beyond delivery
- Workshop report · PDF · 32.9 MB
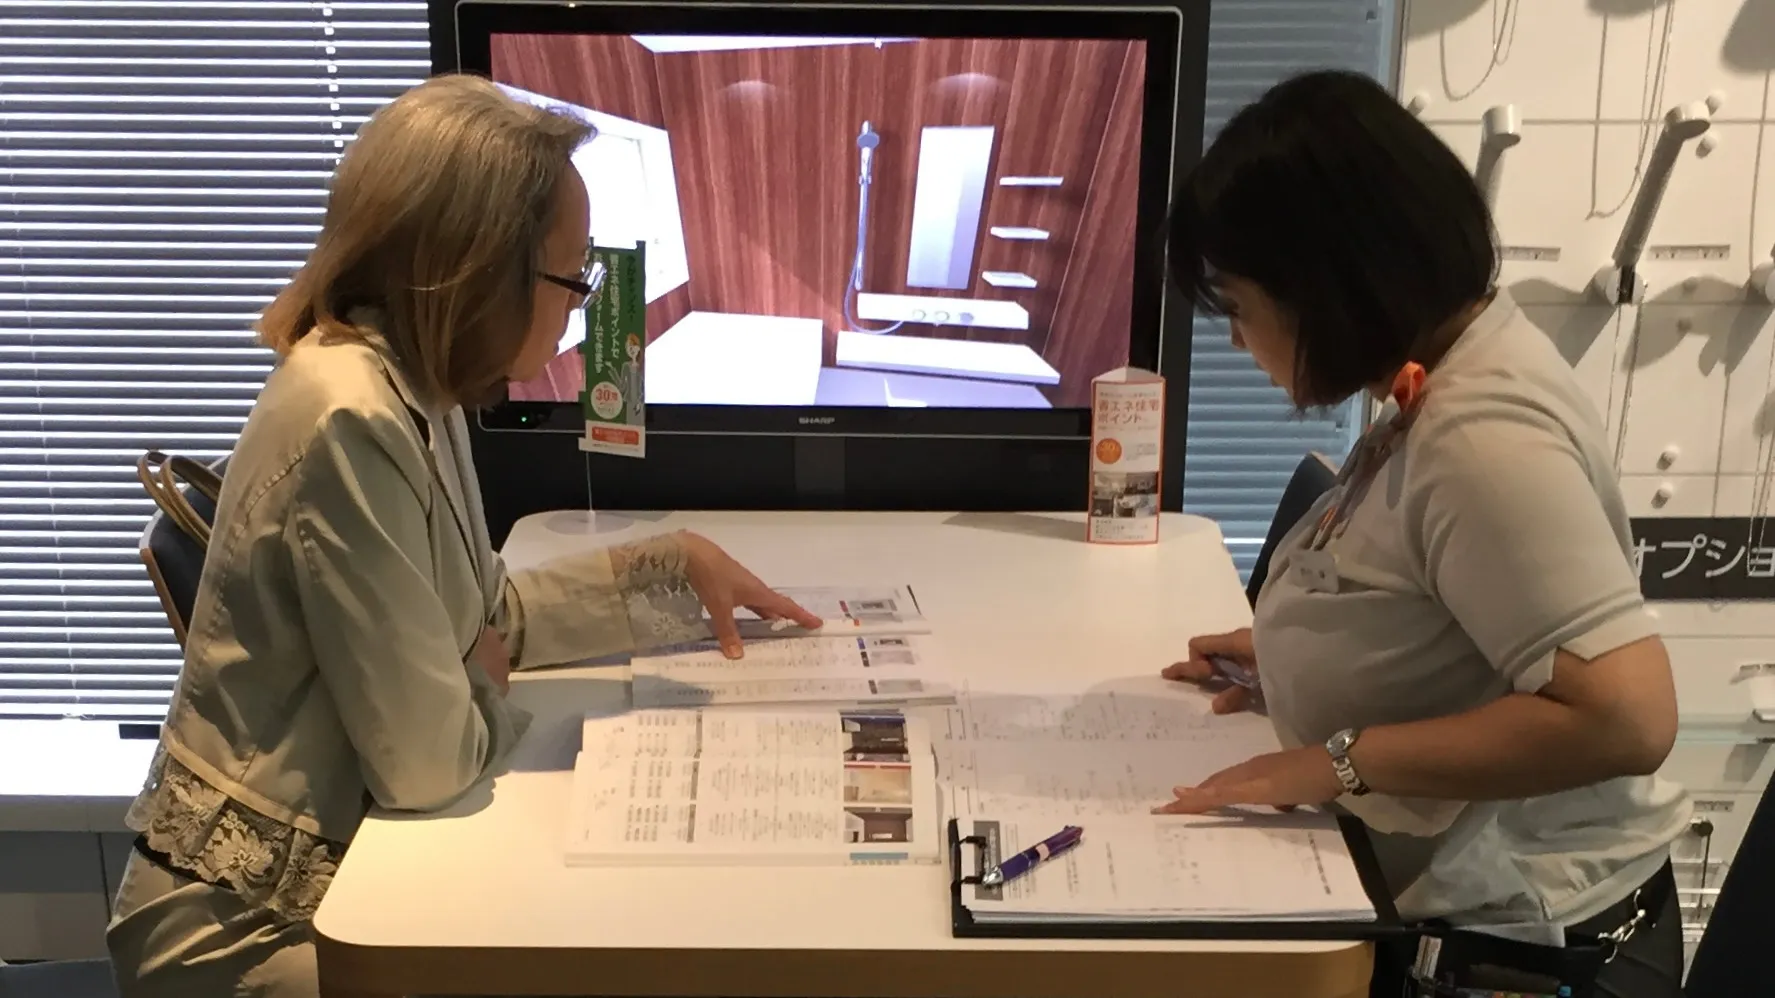
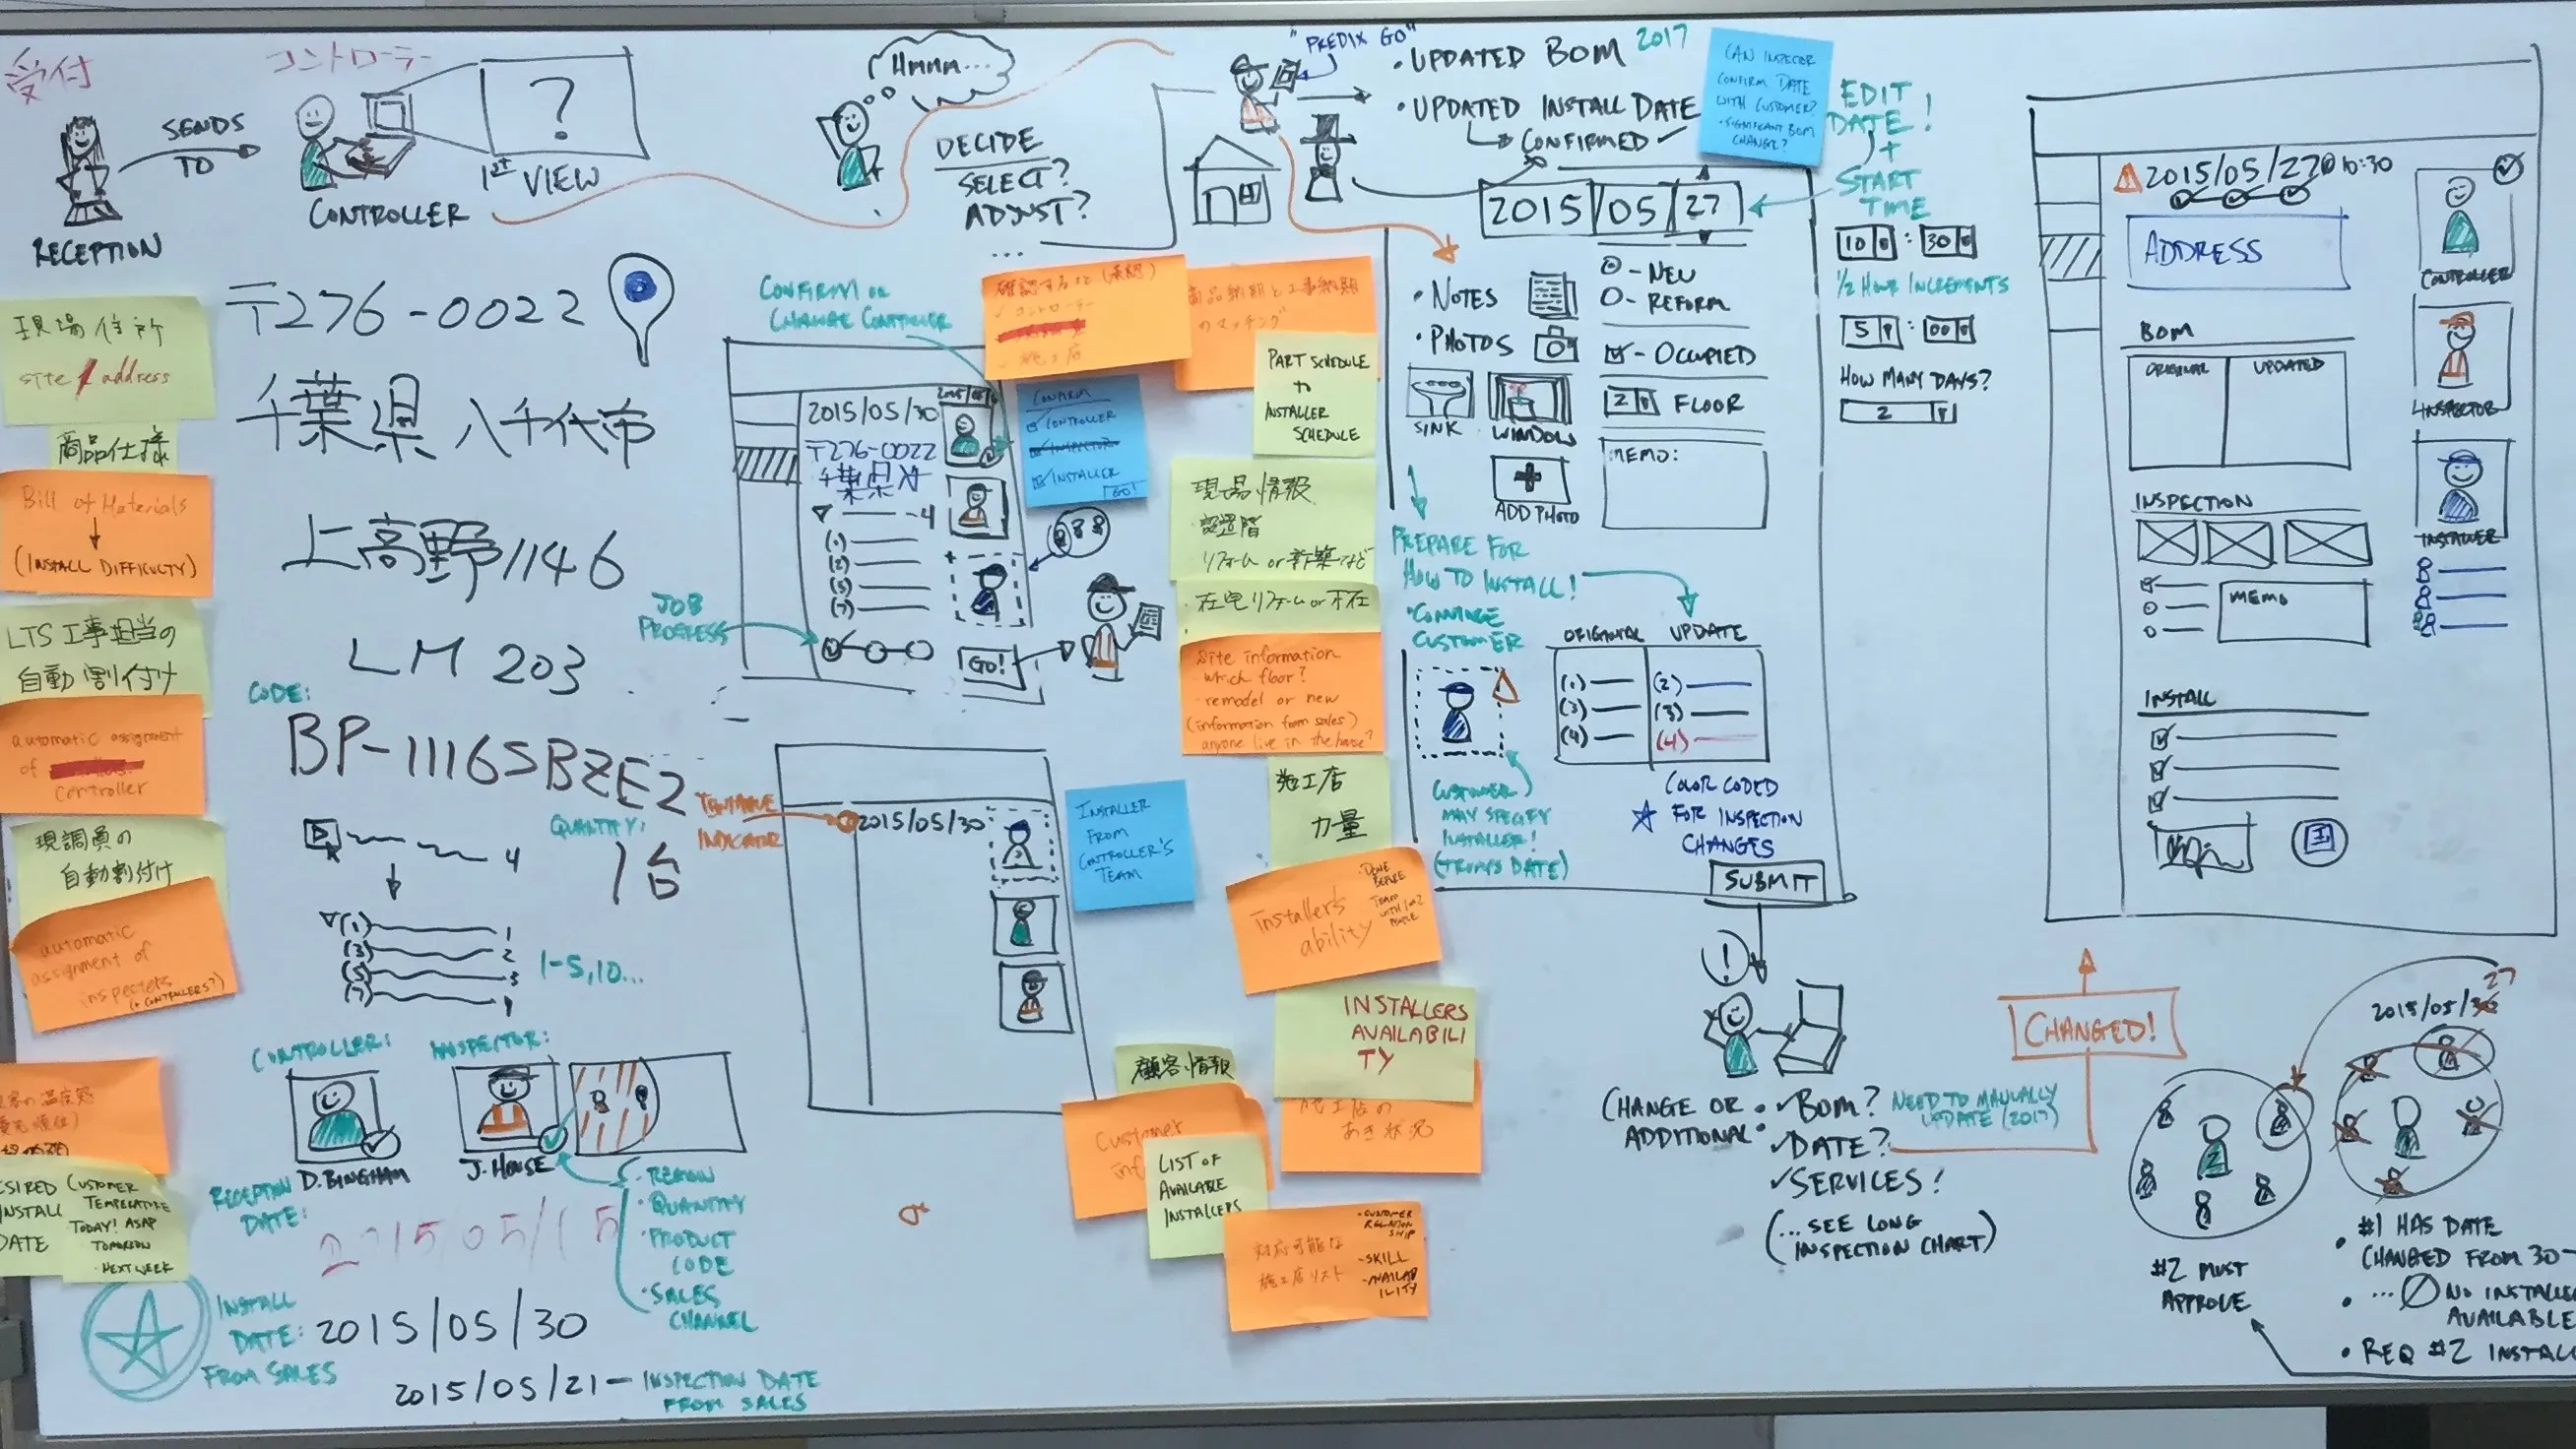
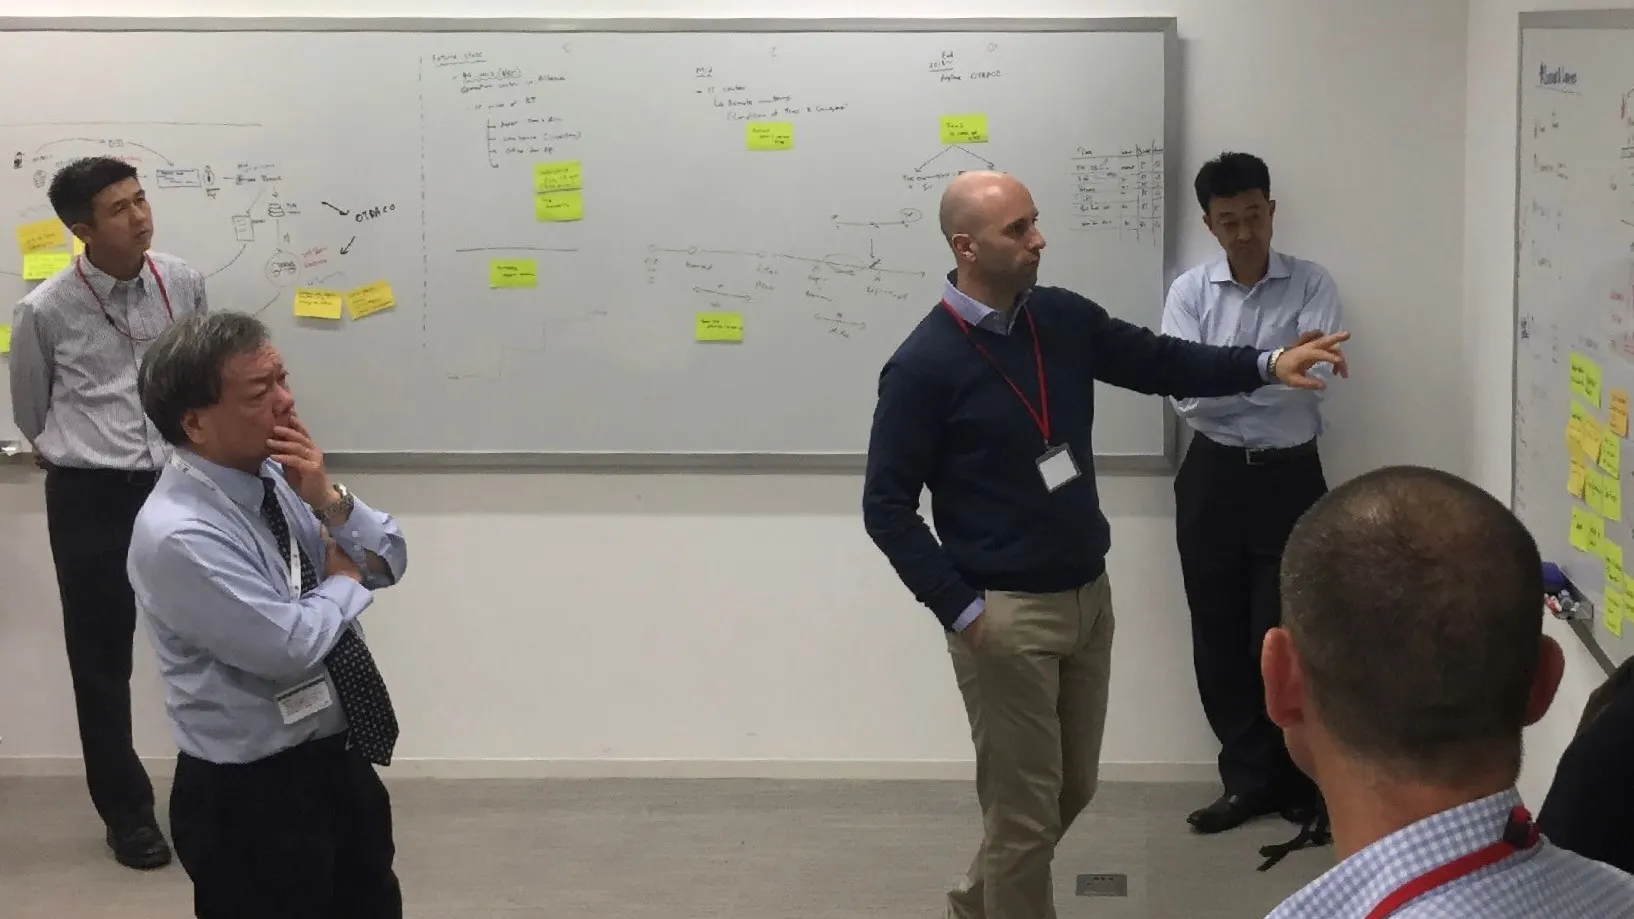
The scheduling work from sale to launch: a consultation at a Lixil showroom, the whiteboard from the design-thinking workshop, the refined sketch of the Job Details screen, and the launched product tested with a user at his desk.
Example 3: Bridgestone
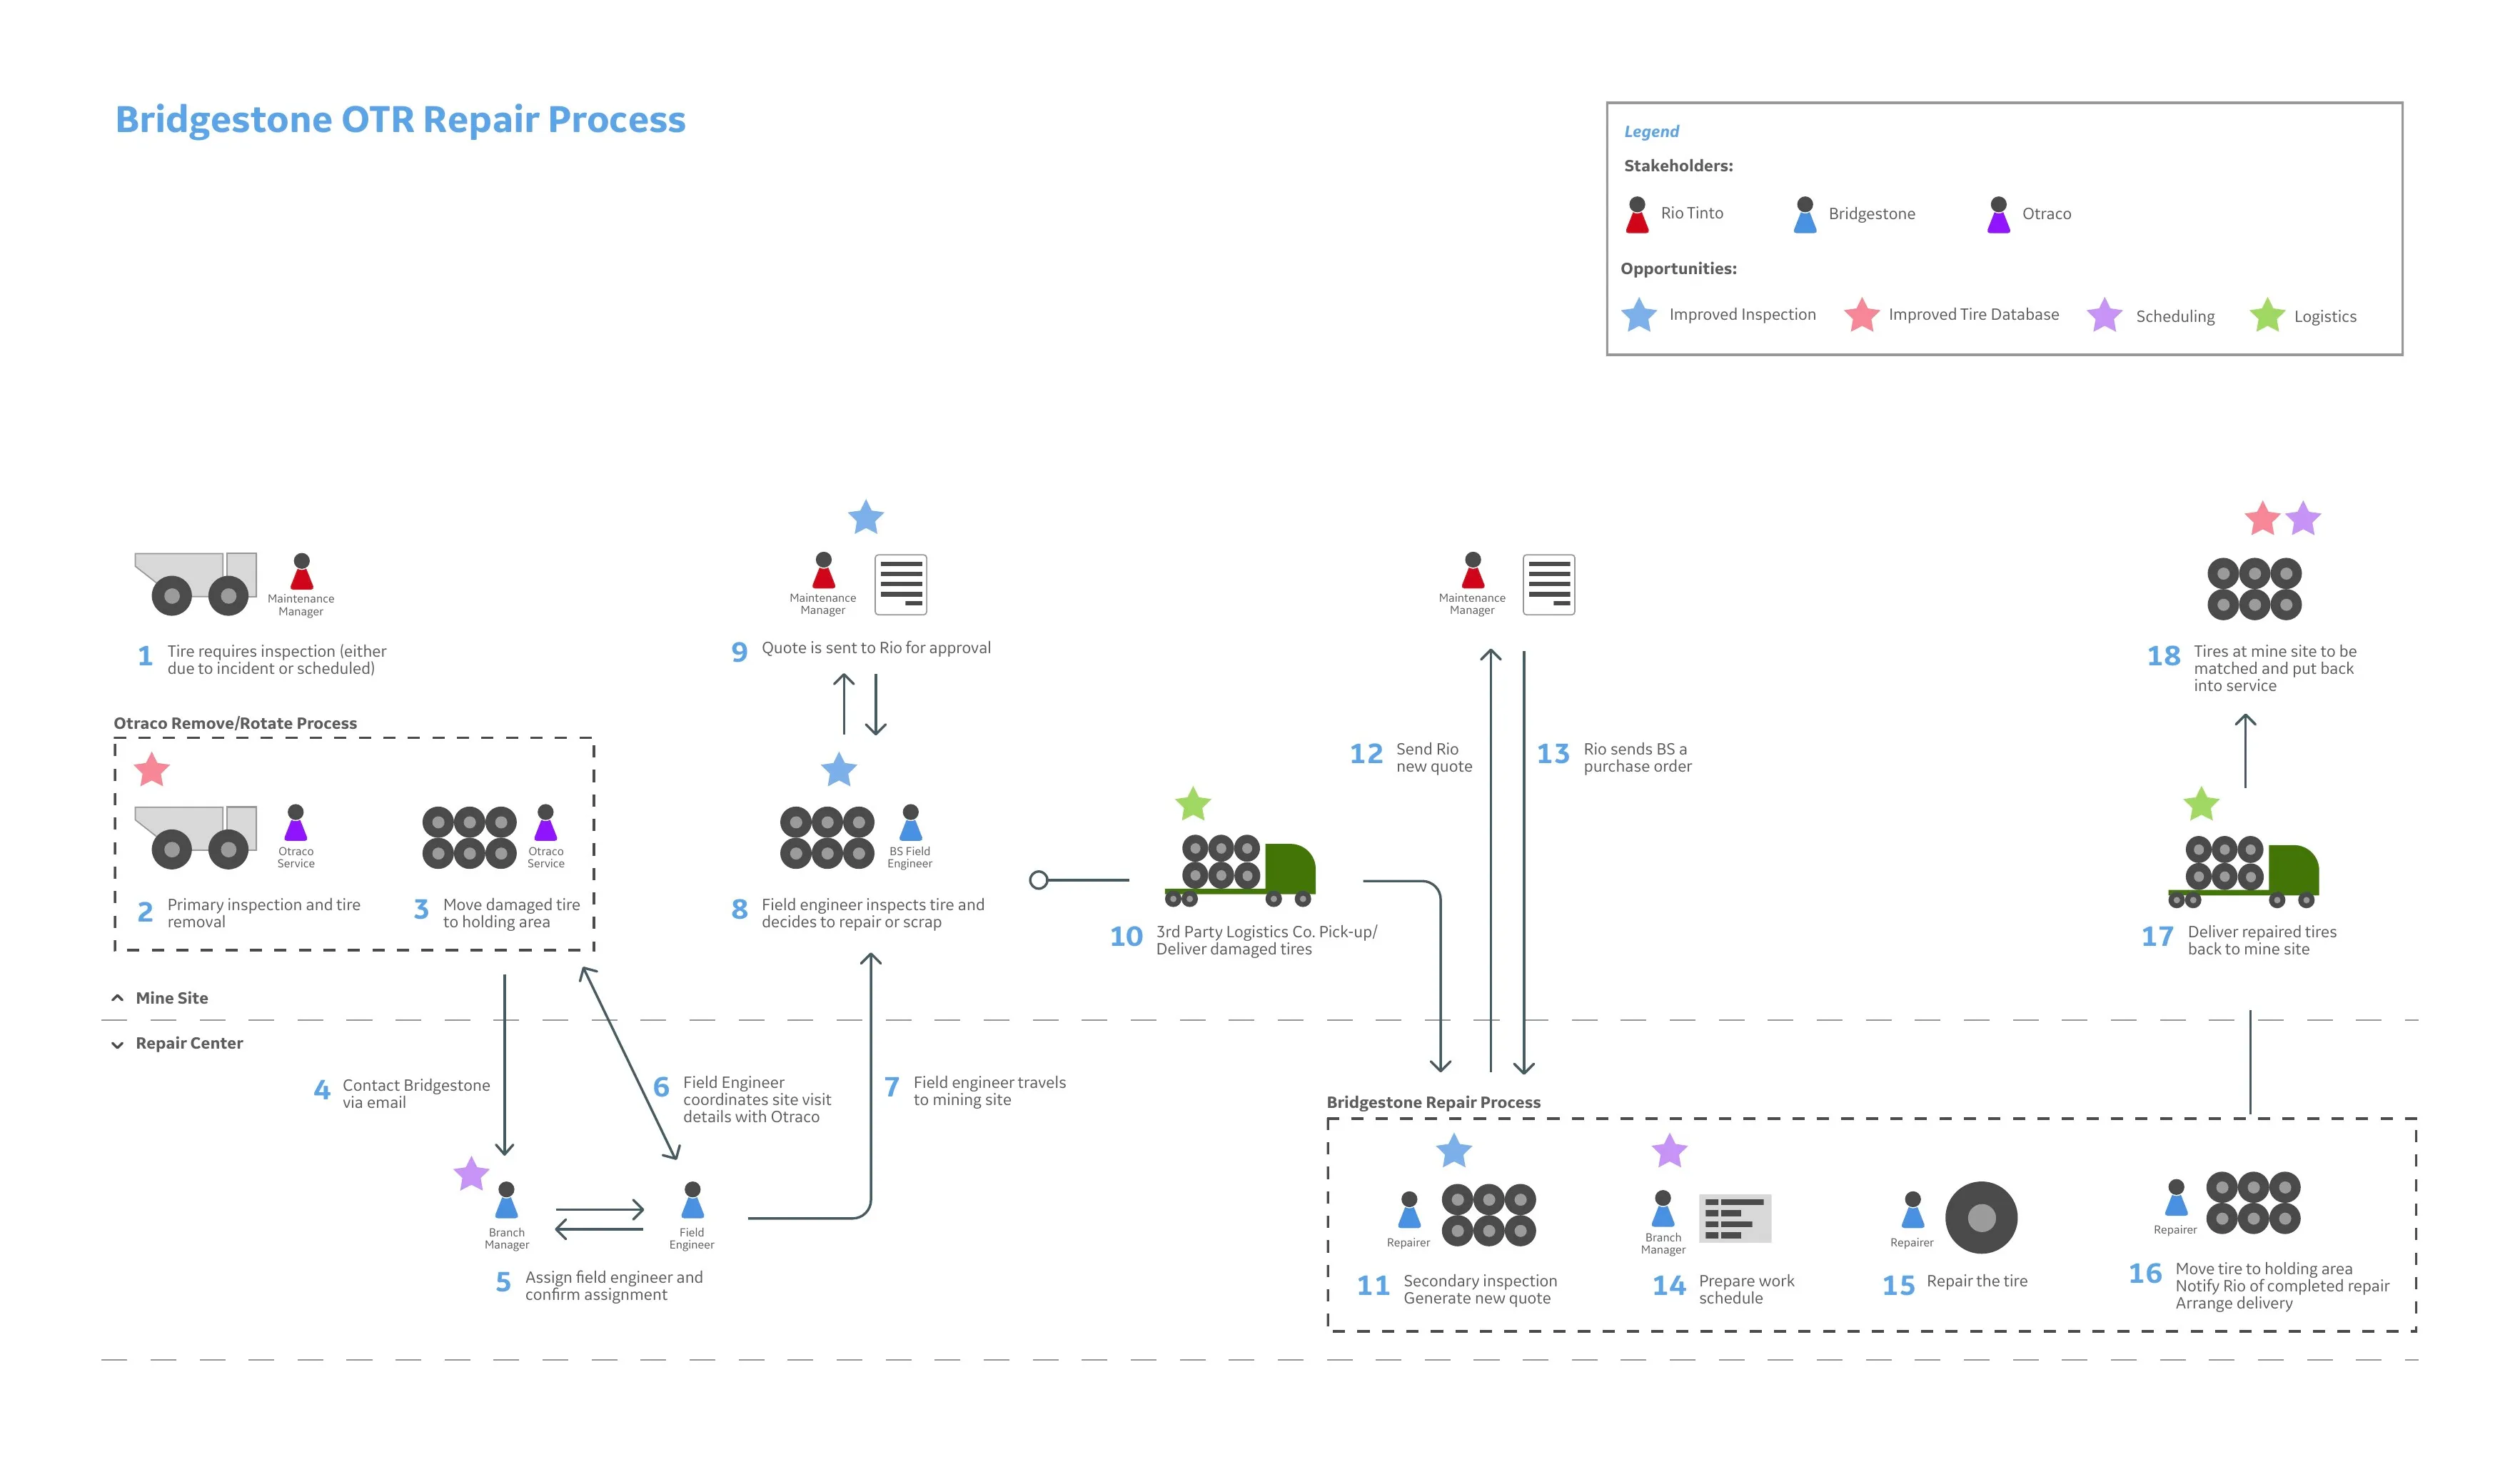
The third example: mining truck tire repair with Bridgestone, mapped end to end across the mine site, the repair center and the logistics between them. The deal aligned the work into GE ServiceMax and cut repair time and carried inventory.
Mining Truck Tire Repair
- Multi-million dollar deal
- Reduced tire repair time and carried inventory
- Aligned into GE ServiceMax
- Workshop report · PDF · 7.2 MB
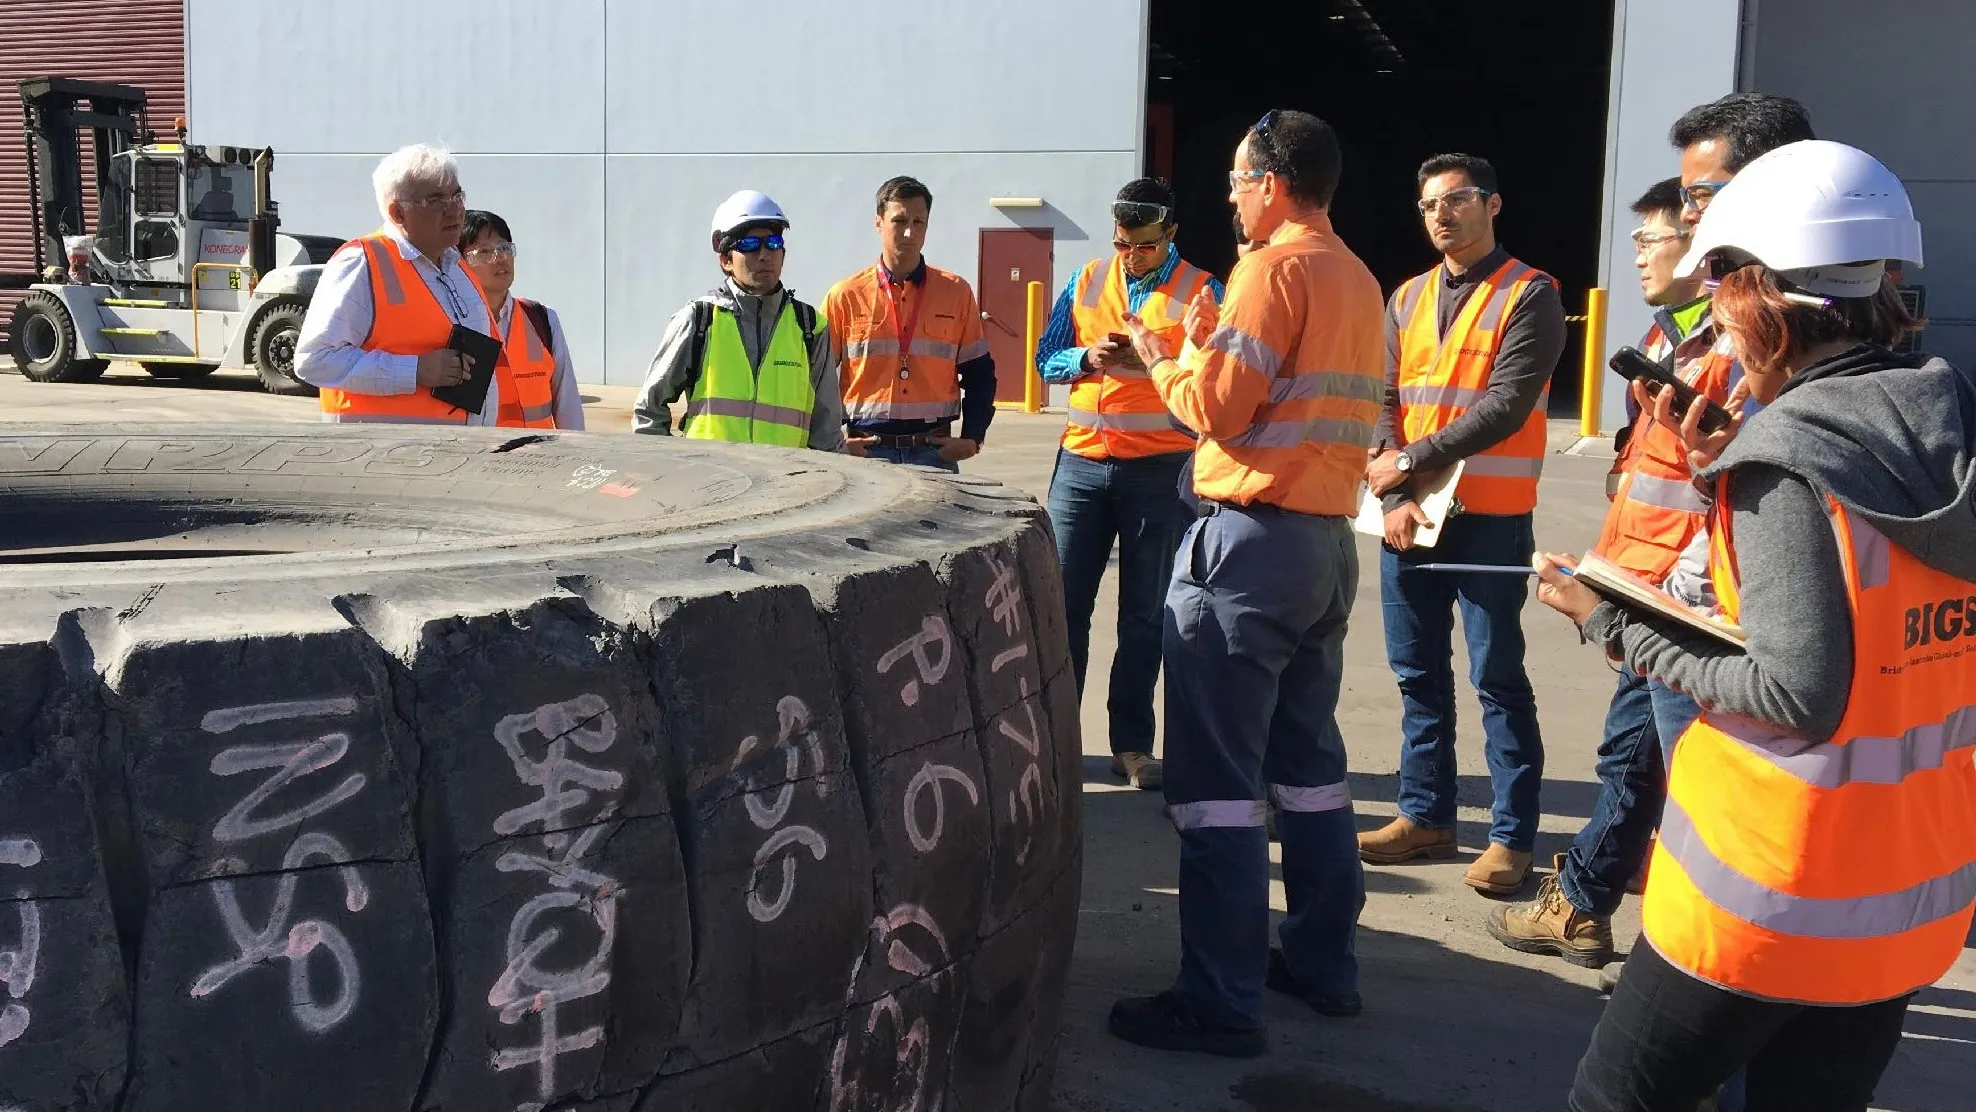
The tire-repair work in the field and the studio: on-site research at the tire repair facility, the workshop reviewed with senior leadership, and the scheduling screens refined in Sketch. The flows came straight from what the yard showed us.
Company engagements
The fifteen market verticals the practice worked across, from aerospace to transportation. It is the breadth the emerging-verticals mandate turned into.
Company Engagements
Market Verticals
Aerospace · Agriculture · Automotive · Construction · Consumer Packaged Goods · Energy · Fleet Vehicles · Food & Beverage · Heavy Equipment · Manufacturing · Marine · Mining · Semiconductor · Telecommunications · Transportation
The thirty-three companies named on the slide as engagements, shown as their marks in alphabetical order. The breadth is the point: the same method ran in mining, airlines, shipbuilding and consumer goods.








Playbook
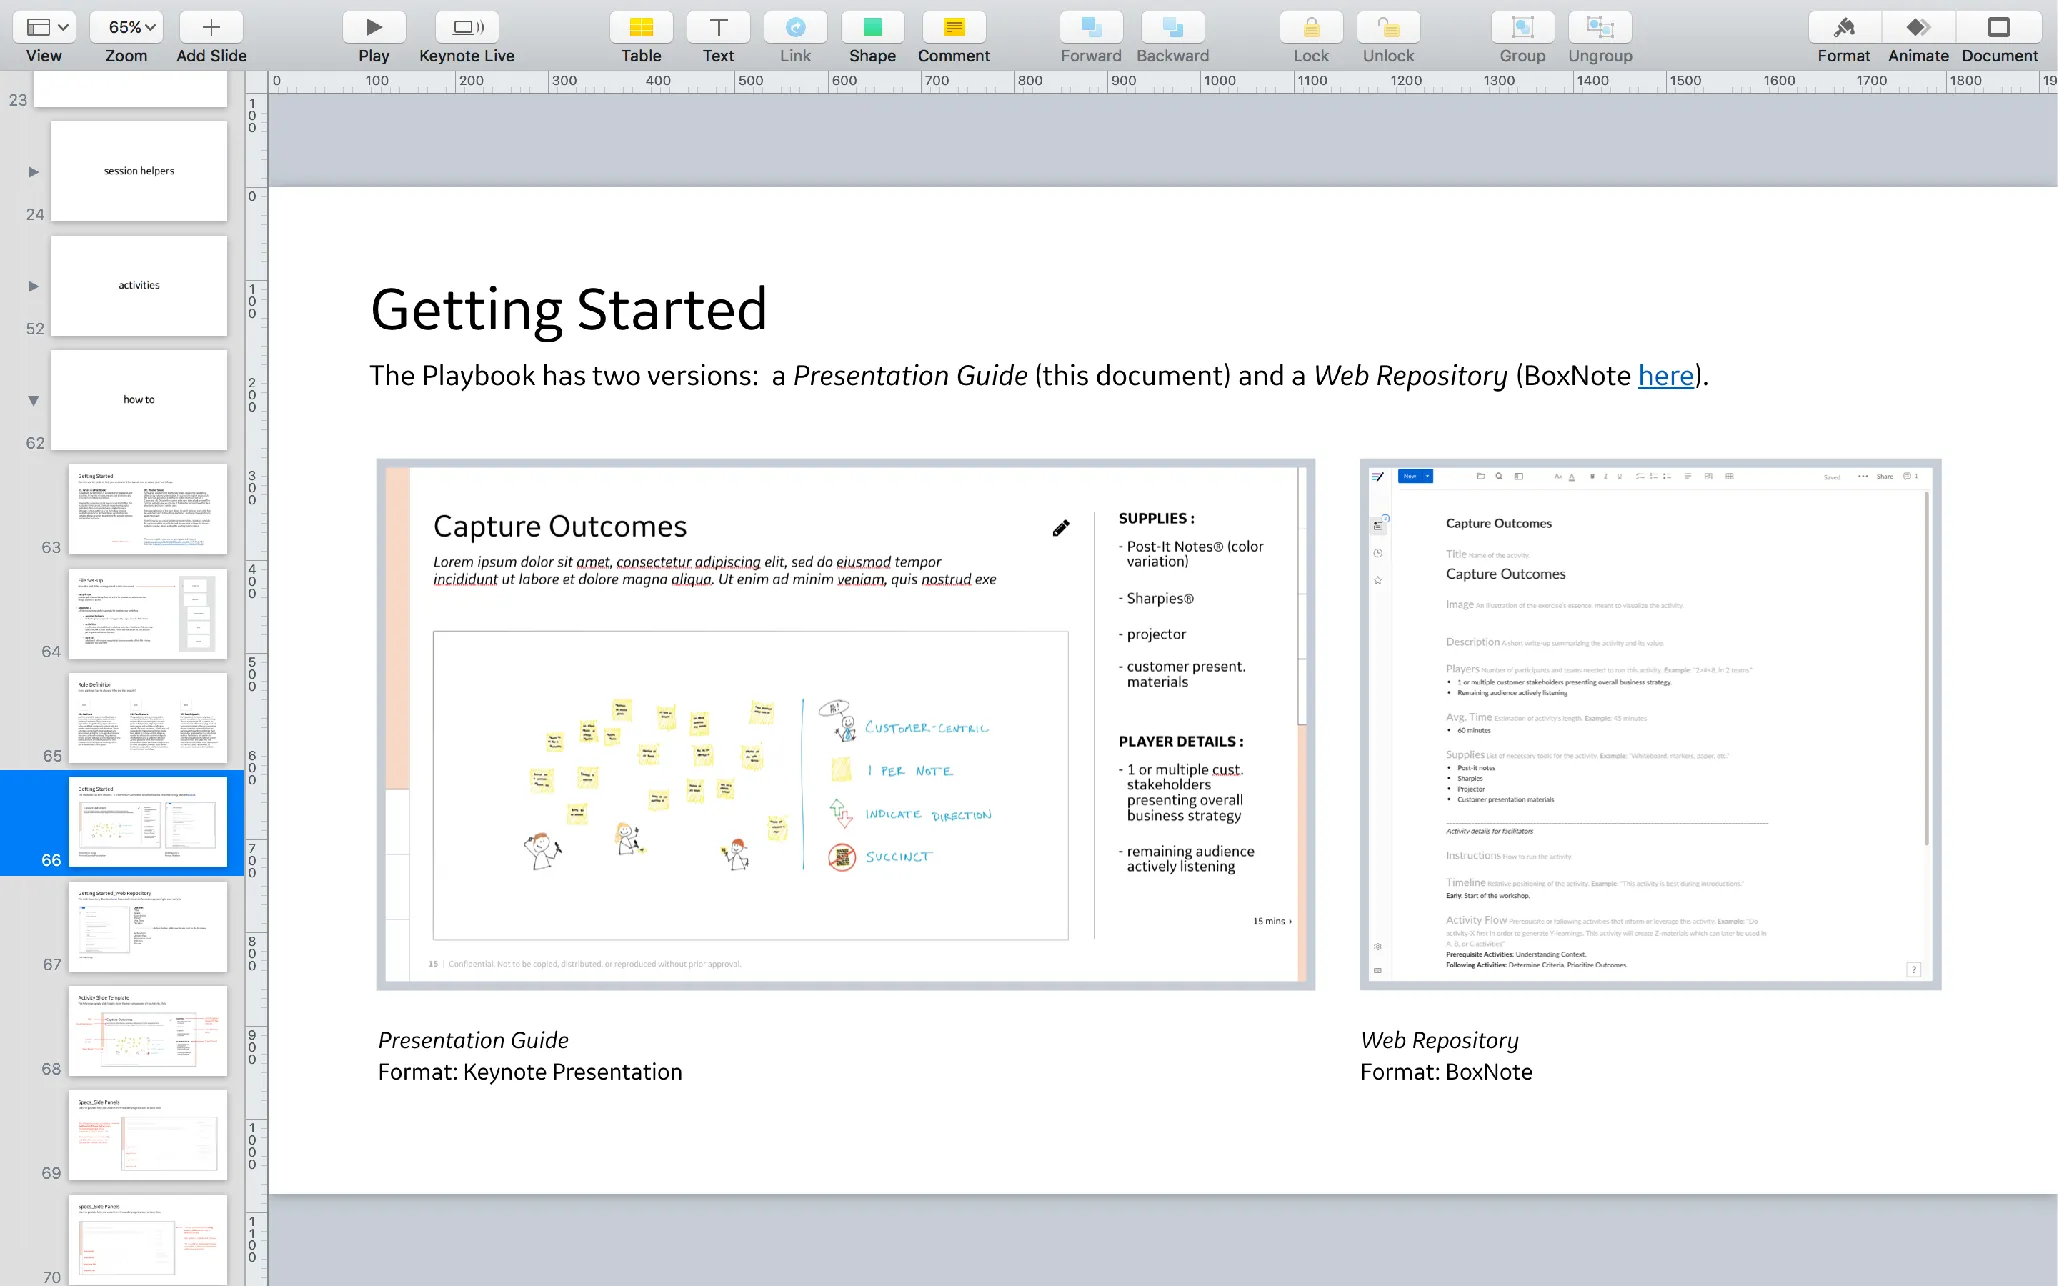
The two tools we made around the workshop: a playbook that lets facilitators structure agendas and add activities, and a report theme that speeds the synthesized results to customers. Both were about making the method teachable and repeatable beyond me.
We created two tools for use before and after the workshop. The playbook assists facilitators in structuring agendas and gives expert facilitators an authoring outline for adding new activities. Box Notes document each activity in high detail and are paired with a Keynote presentation slide for in-session guidance with participants. To speed delivery of synthesized results, a report theme was created with a variety of lightly branded slide templates. This allows the team to focus on delivering clear content to customer and GE stakeholders.
The playbook's Getting Started page and nine of its activities. Each activity has a Keynote slide for the room and a Box Note that documents it in detail, so another facilitator can run it.
Design Thinking & Research Playbook
- Stakeholder Alignment
- Ice Breakers
- Capturing Outcomes
- Decision Criteria Harvesting
- Prioritization Frameworks
- User Interviews
- Persona Definition
- Role Transformation
- Ecosystem Mapping
Knowledge sharing
Presenting the ecosystem-mapping method at GE Digital Day in Tokyo in 2016, with a customer map on screen. Sharing the practice with GE's commercial teams was part of the job.
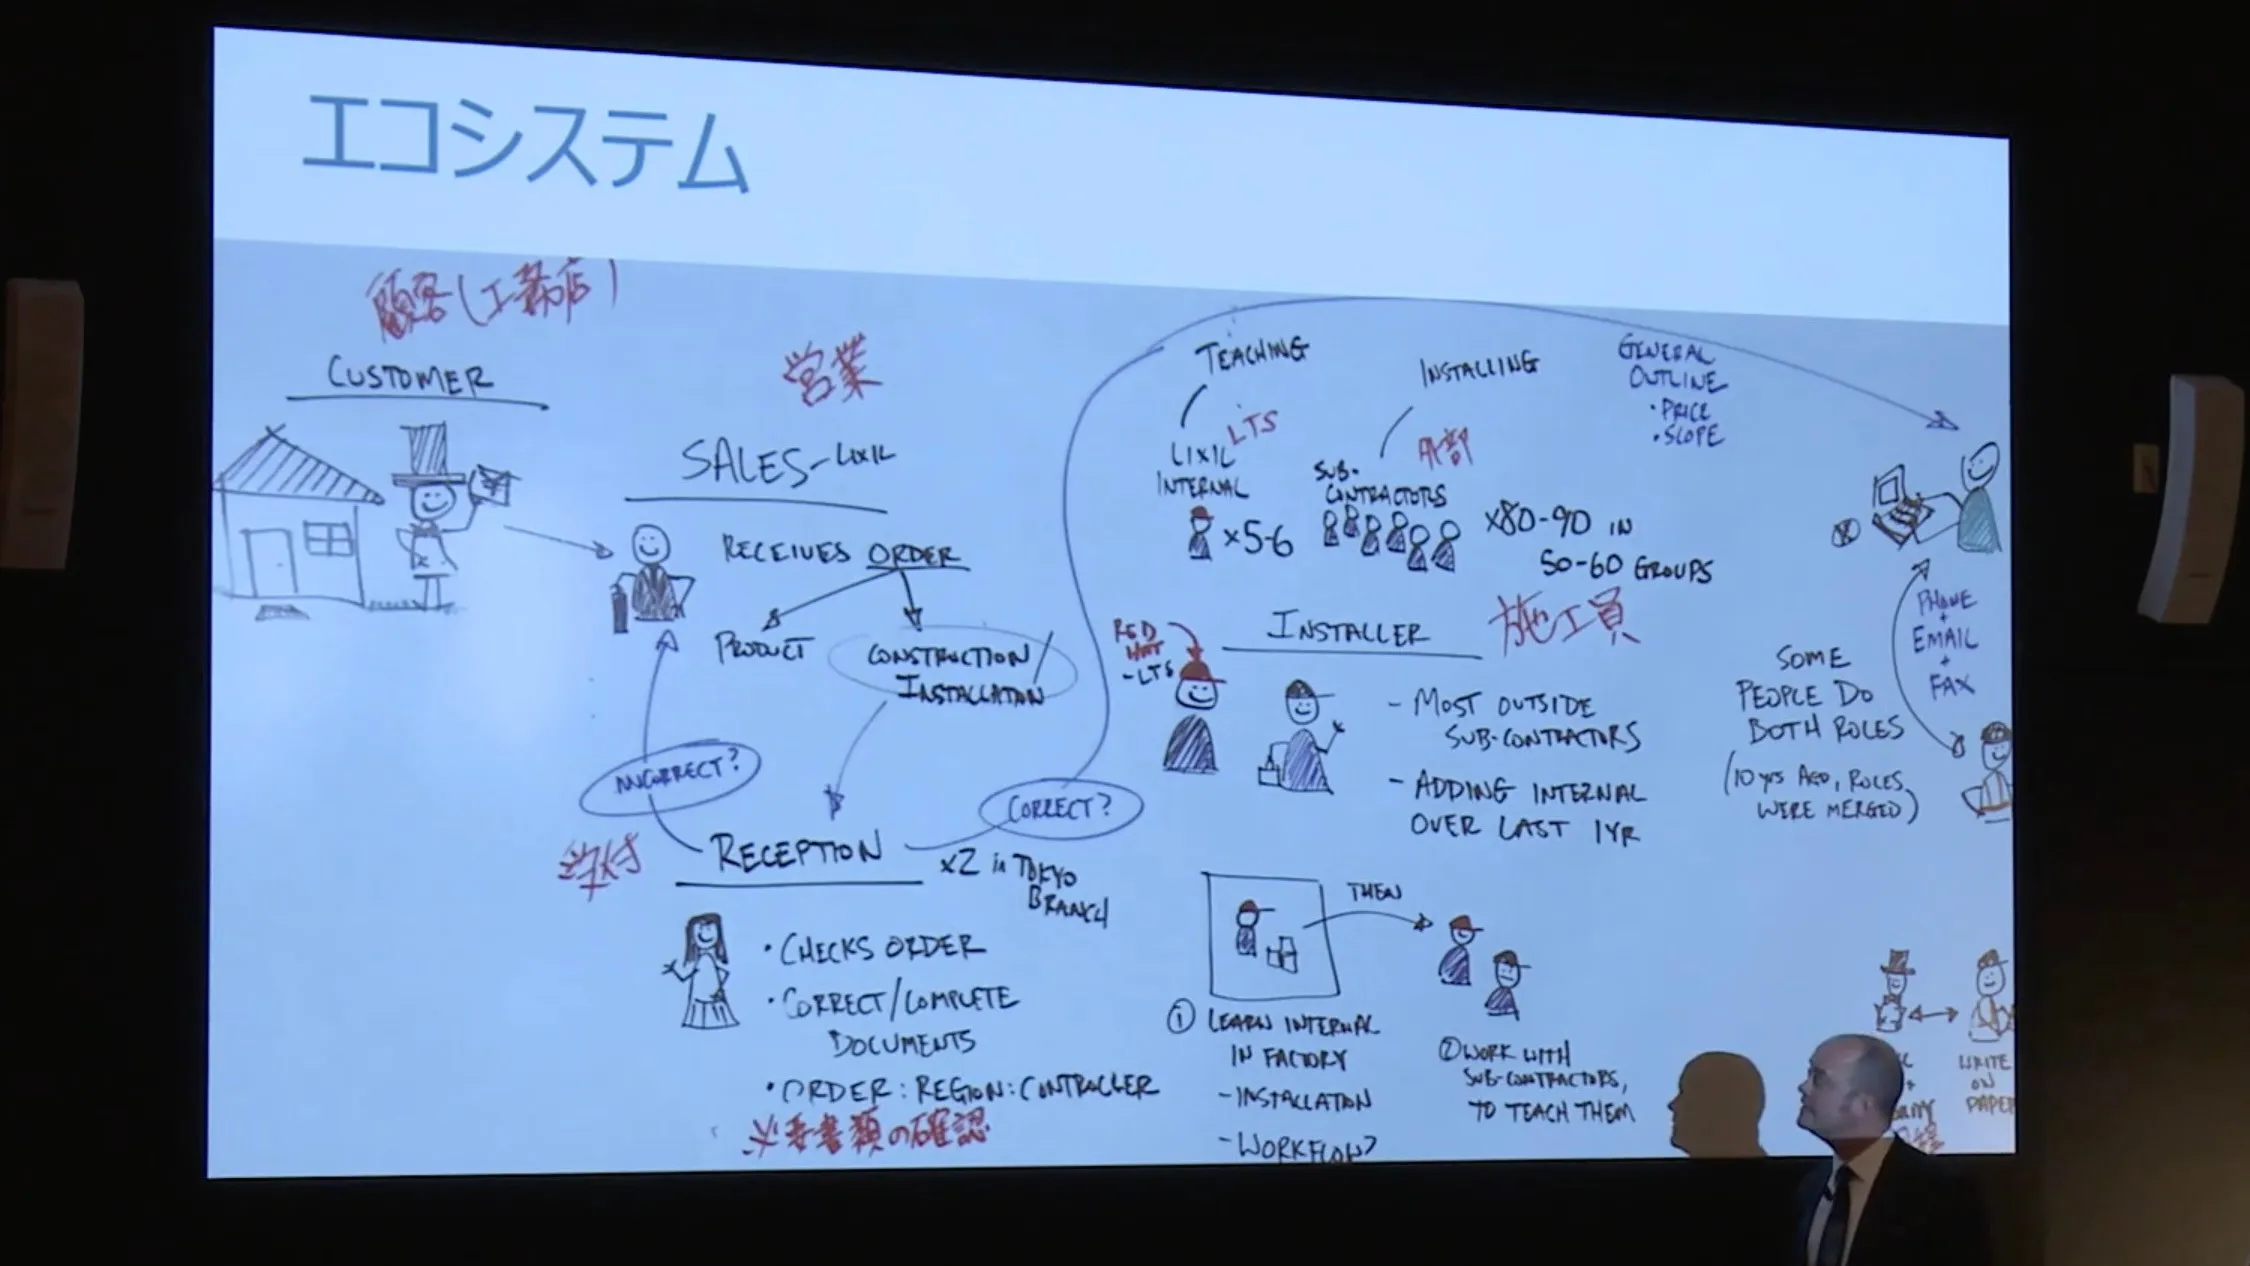
GE Digital Day, Tokyo Japan, 2016
Where the practice was presented: GE Digital Day in Tokyo, the Predix Transform conference, the IDSA national conference, GE's software technology conference, and GE's commercial-team webinars, 2015 to 2016. Each event is cited where a public record of it stands.
GE Digital Day, Tokyo Japan, 2016
Article · 2016
Predix Transform Conference, 2016
Article · 2016
IDSA 50th National Conference, 2015
Slides · 2015
GE Software Technology Conference, 2015
(internal)
GE Commercial Team Webinars
(internal)
Results
The practice's results on one map: more than sixty workshops in eighteen countries, and over a hundred million dollars of SaaS influenced. Each figure carries what I learned: cultural sensitivity and communication, a refined and documented process, and UX earning its place in pre-sales.
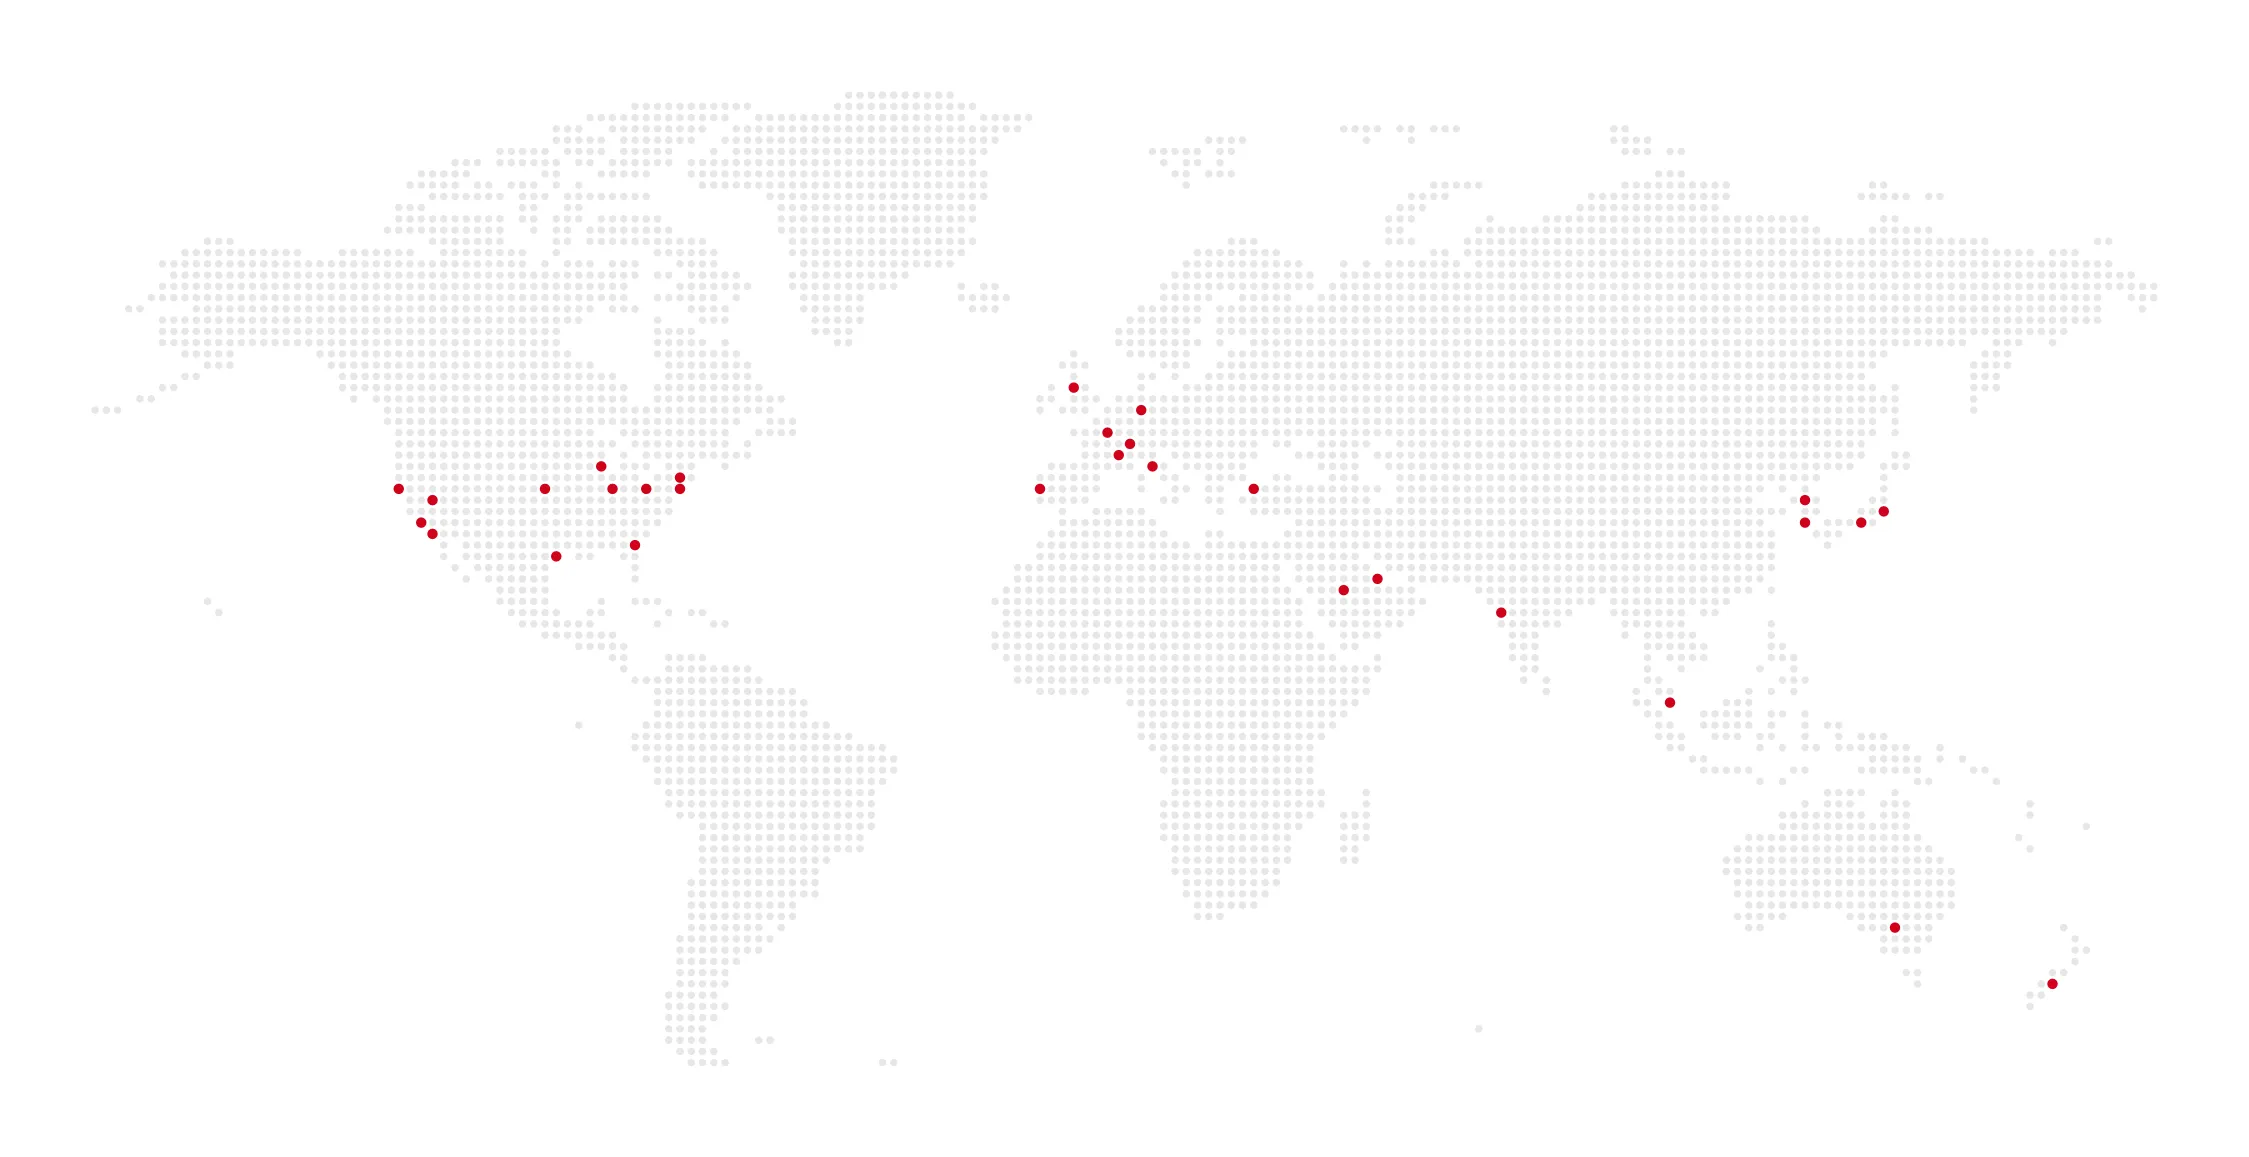
- 18 Countries · Cultural Sensitivities · Communication Skills
- 60+ Workshops · Refined Process · Documented Playbook
- >$100MM SaaS · Business Outcomes · UX in Pre-Sales
Team credits
- General manager
- Yonatan Hagos
- UX design
- Nirman Bisla, Lauren Bowers, Jason Campbell, Diana Freeman-Baer, Joanne Mendel, Andrew Milmoe, Andrea Perry, Michael Spear, Shaziya Tambawala
- Product management
- Sara Ahmadi, Eric Bauer, Kohi Easwarachandran, Mattias Herrera, Jeremy House, Julian Loren, Chris Lyons, Nithia, Branko Raic, Brian Sparling, Julie Wenzel, Mayte Zavaleta
- Engineering
- Dat Nguyen, Nitya Podila, Nihar Vaidya
- Data science
- Sambasiva Dasari, Alireza Dibazar, Ram Narasimhan, Sergey Patsko, Alexander Ross
- Sales and accounts
- Onur Aruz, David Berridge, Marc Drenning, Jason Irwin, Tetsuya Nakamura, Pierce Power, Michael Robichaud, Dan Smillie
- Country leadership
- Vincent Champain, Uygar Doyuran, Ryo Kaneko, Ussal Sahbaz
- Solution architecture
- Umut Ceyhan, Lee Jellum, Jose Marques, Mayoran Rajendra, Kei Toda
- Program management
- Jakob Hall, Natsumi Hoshi
- Operations
- Don Sanborn
AI usage
2, Ideas. AI helped with research, sources, brainstorming or structure. I wrote every word.The tiers