The research & conceptualization of GE’s industrial monitoring tool.
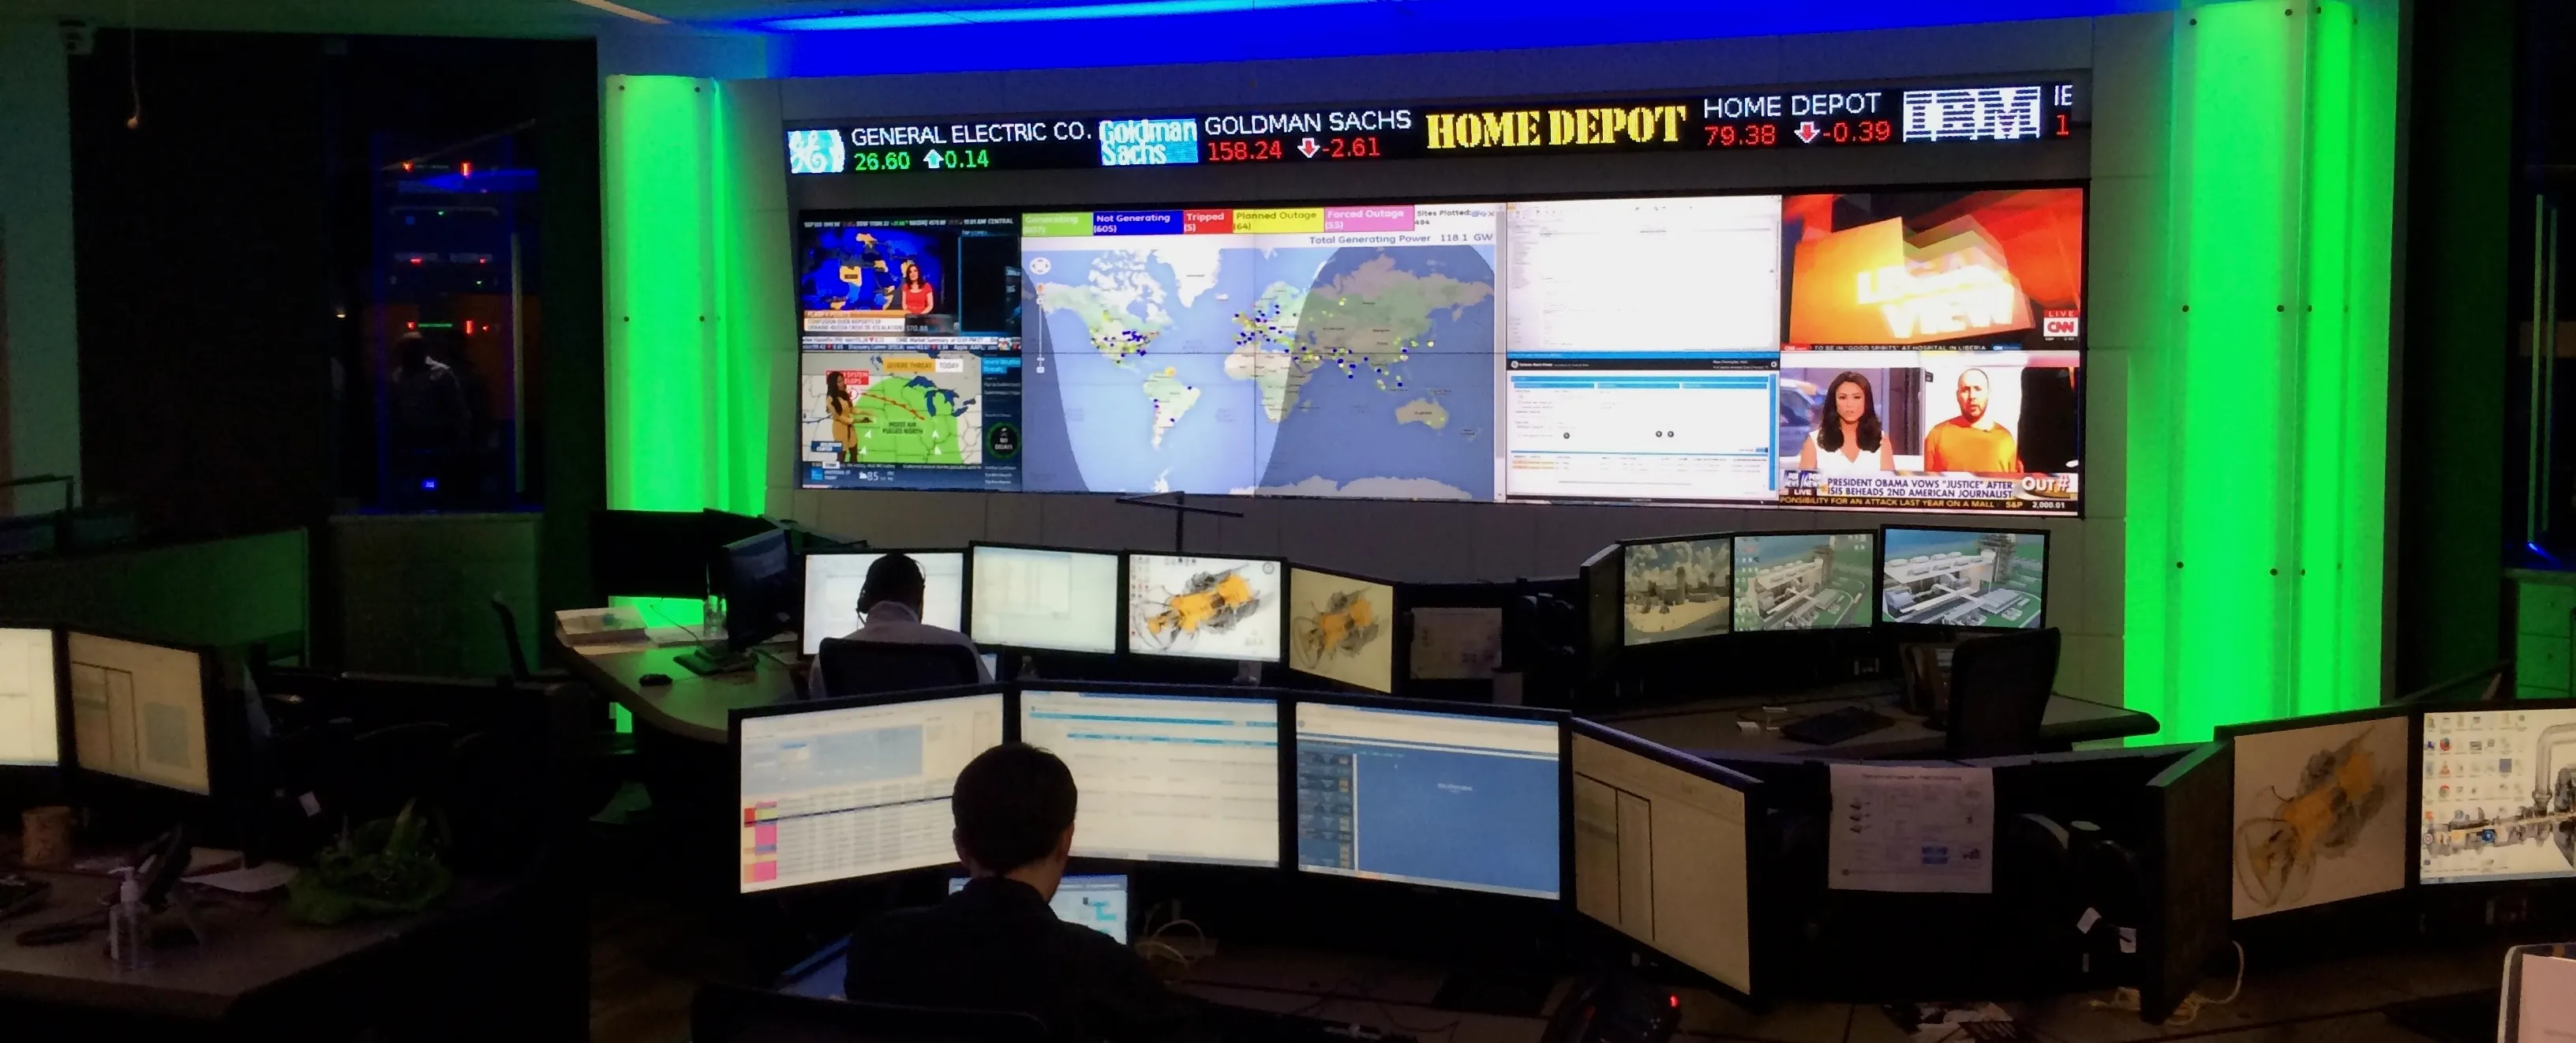
The page opens on GE's remote monitoring center in Atlanta, where analysts work across rows of desk monitors beneath a video wall of maps, dashboards and news feeds. It is where the research began and the room the design had to fit into.
Asset Performance Management
Problem space
My own account of the problem, in the words I used to present it: GE monitors and diagnoses critical industrial equipment remotely, and the goal was a tool that let analysts decide fast and well inside a collaborative workflow. It also states my role plainly, alongside a product manager and a visual designer.
As a manufacturer and service provider to critical industrial equipment, GE’s primary software effort focused on asset remote monitoring and diagnostics. Succinctly stated, this is the collection of operational data, analysis, diagnosis, and prescription of maintenance activities to prevent catastrophic failures. The design goal was to provide a software tool that empowered analysts to make fast and informed decisions while fitting into a complex collaborative workflow. Alongside a product manager and visual designer, I led much of the research and interaction design efforts that birthed GE’s Predix APM software.
A cutaway turbine model in the Atlanta monitoring center, beside the three problems we observed on site: systems spread across many monitors, complex visualizations and collaboration both in the room and across the globe. I start from the current state as the people who live in it see it, before drawing anything.
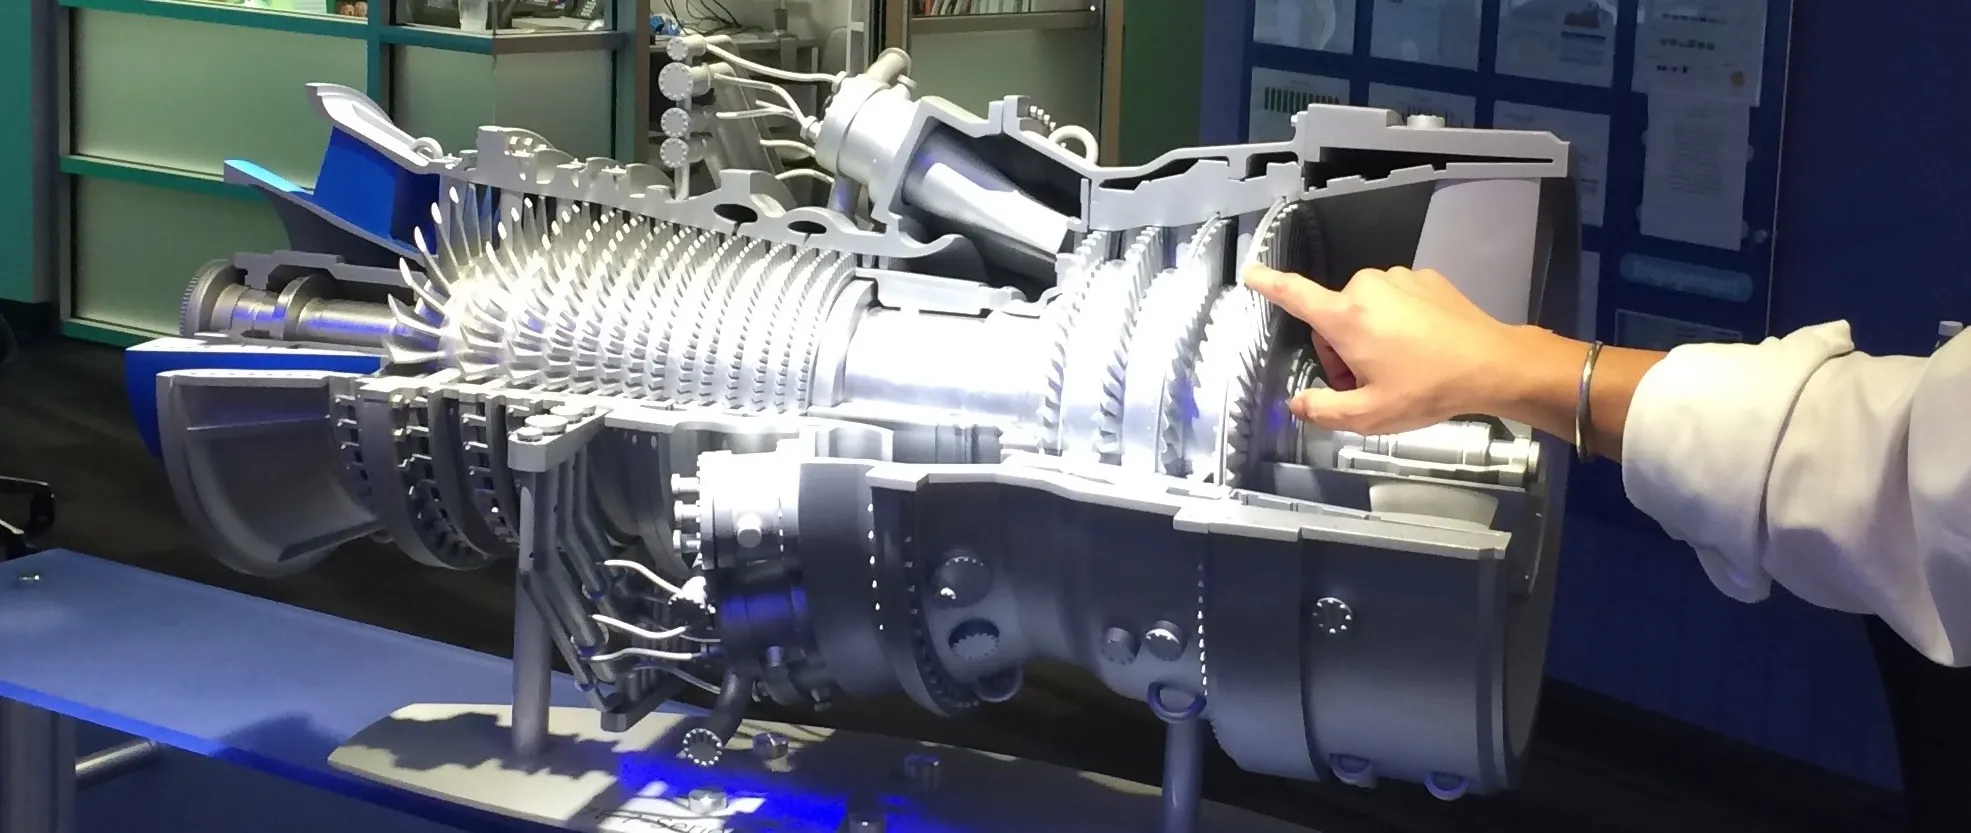
We observed:
- Disassociated systems across multiple monitors.
- Complex information visualizations for analysis.
- Collaboration in-room and across the globe.
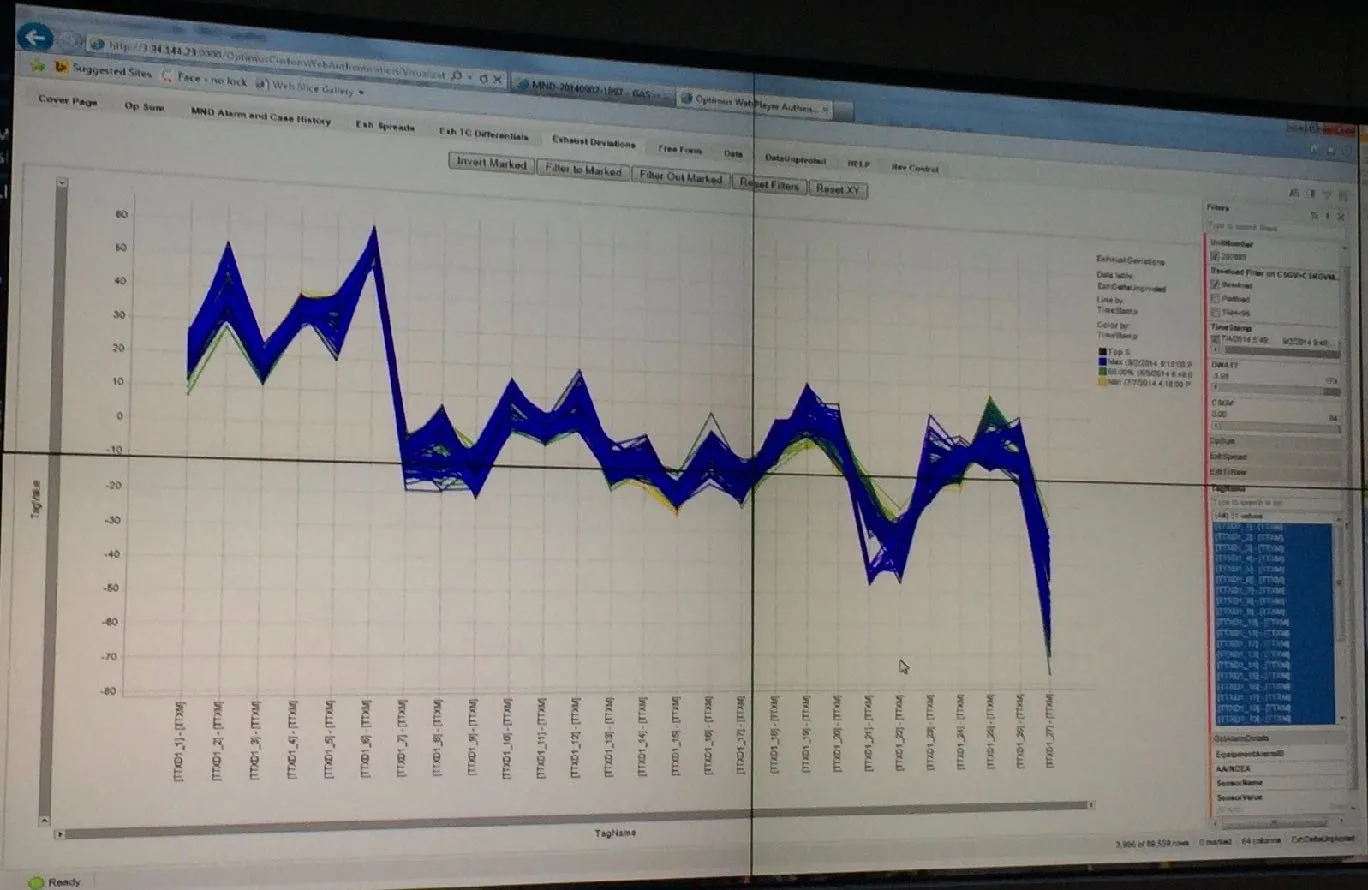
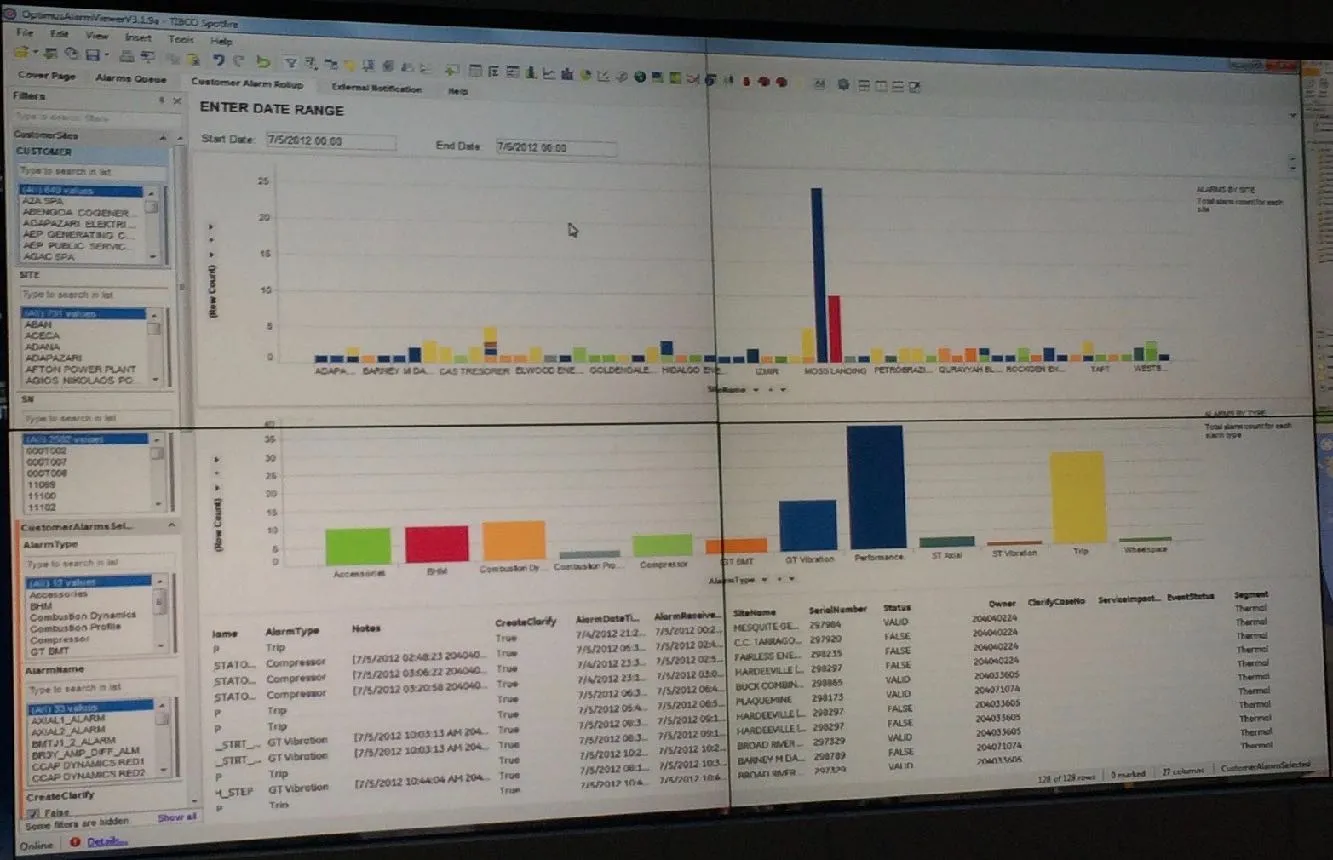
Two of the legacy tools on the center's screens, photographed as the analysts used them: a dense multi-line tag plot and an alarm report of bar charts over a data table. They show the complex visualizations and disassociated systems the research named, as they actually looked.
Decision making
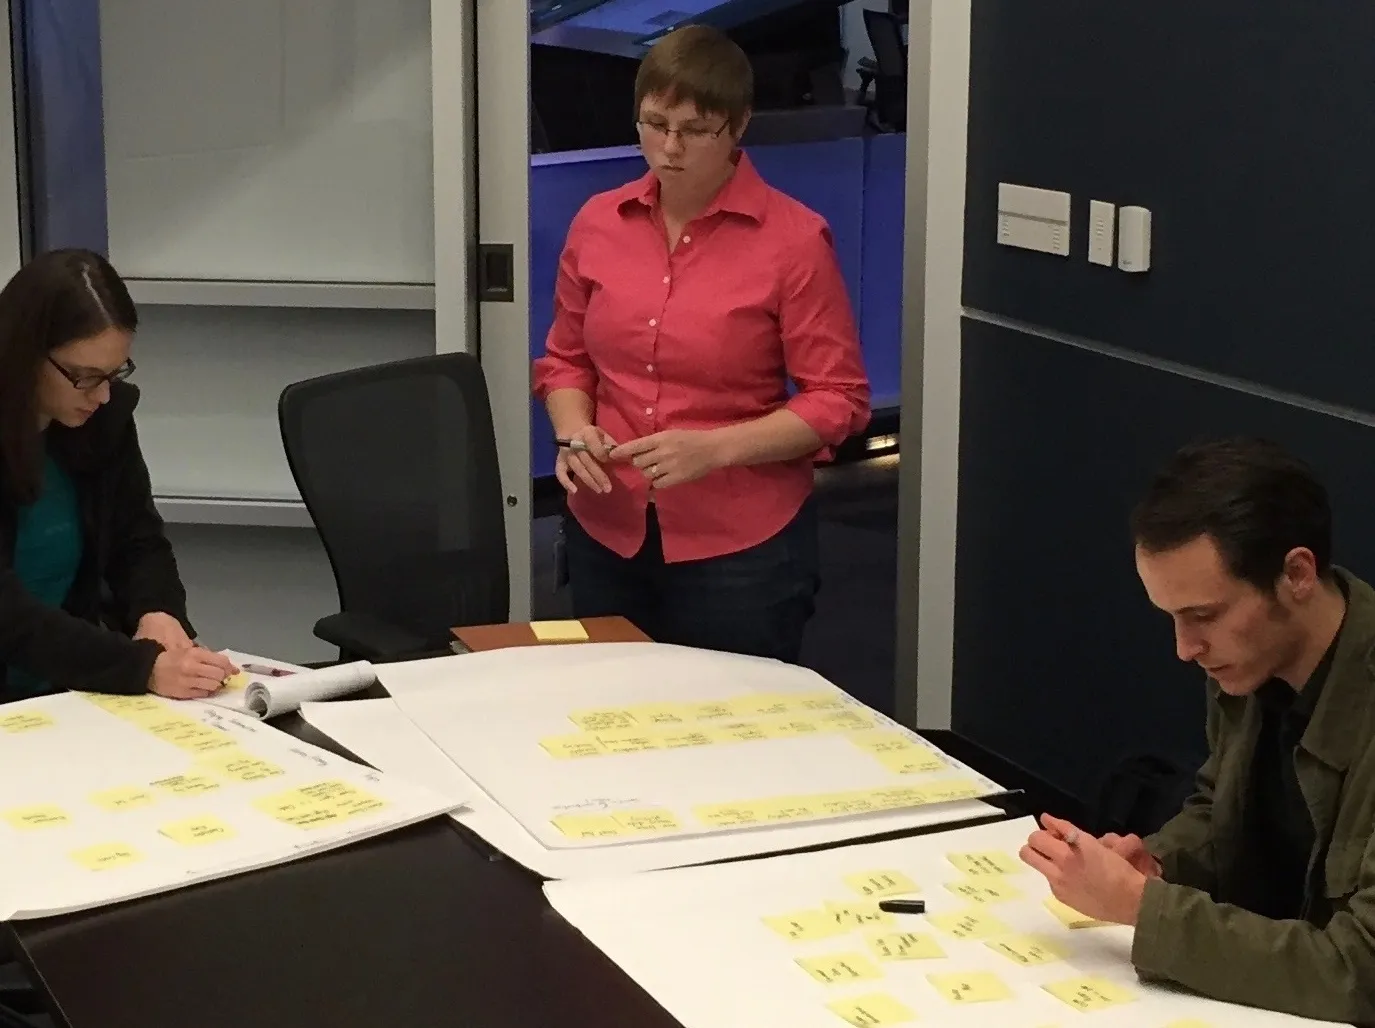
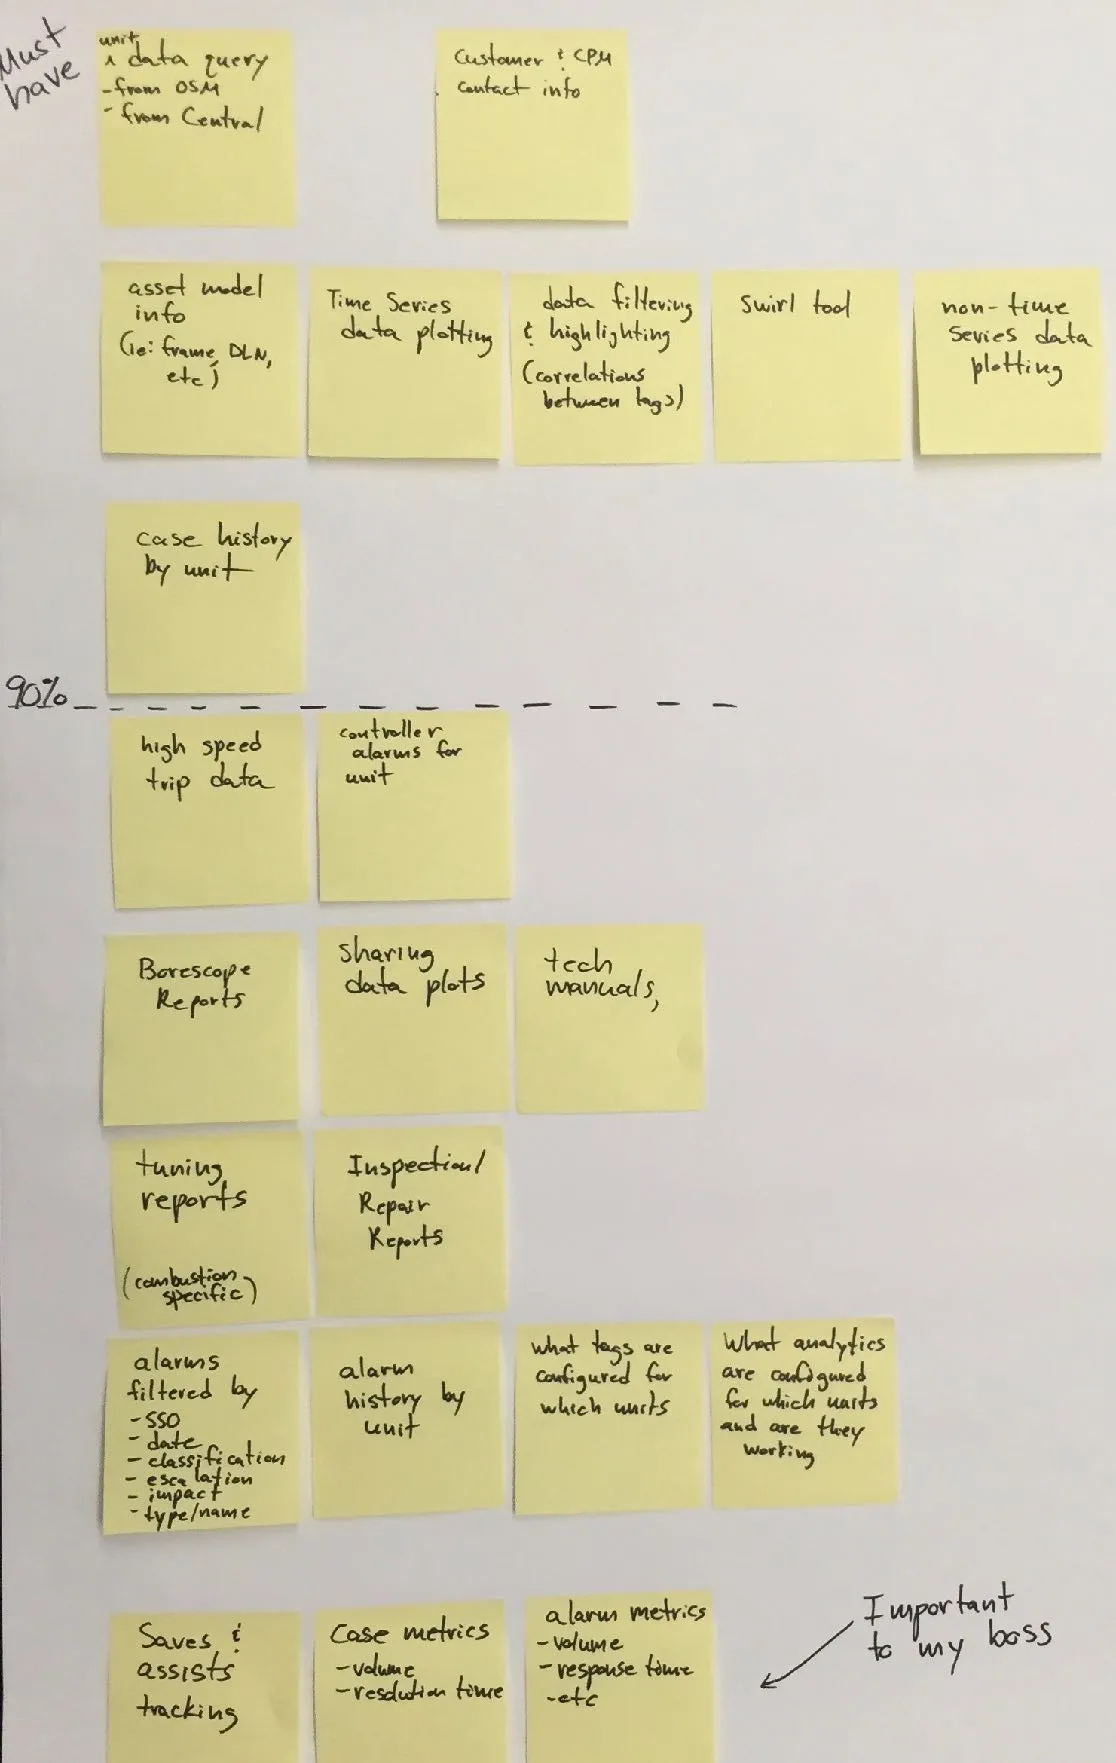
My description of the study I ran with the M&D analysts: each noted the tools they use in a day and arranged them by frequency and importance. The point was to learn what an analyst needs in order to decide, so the design could surface it at the right moment, and it turned up groupings I had not planned for, such as information wanted for one's boss.
Sitting with a number of M&D analysts, I ran a study to organize decision making information. Each analyst noted the tools they use during their day then arranged them by frequency & importance. With this, the design team could surface critical information at the right moment without overwhelming. The research also provided personal groupings such as “info I want” versus “info my boss wants”.
The sorting study in progress, three analysts arranging sticky notes on large sheets, beside one of the boards it produced: must-have tools above a dashed line, less frequent ones below, and a corner marked as important to the boss. I run research sessions that let people organize their own world, and keep the artifact as it was made.
Personas
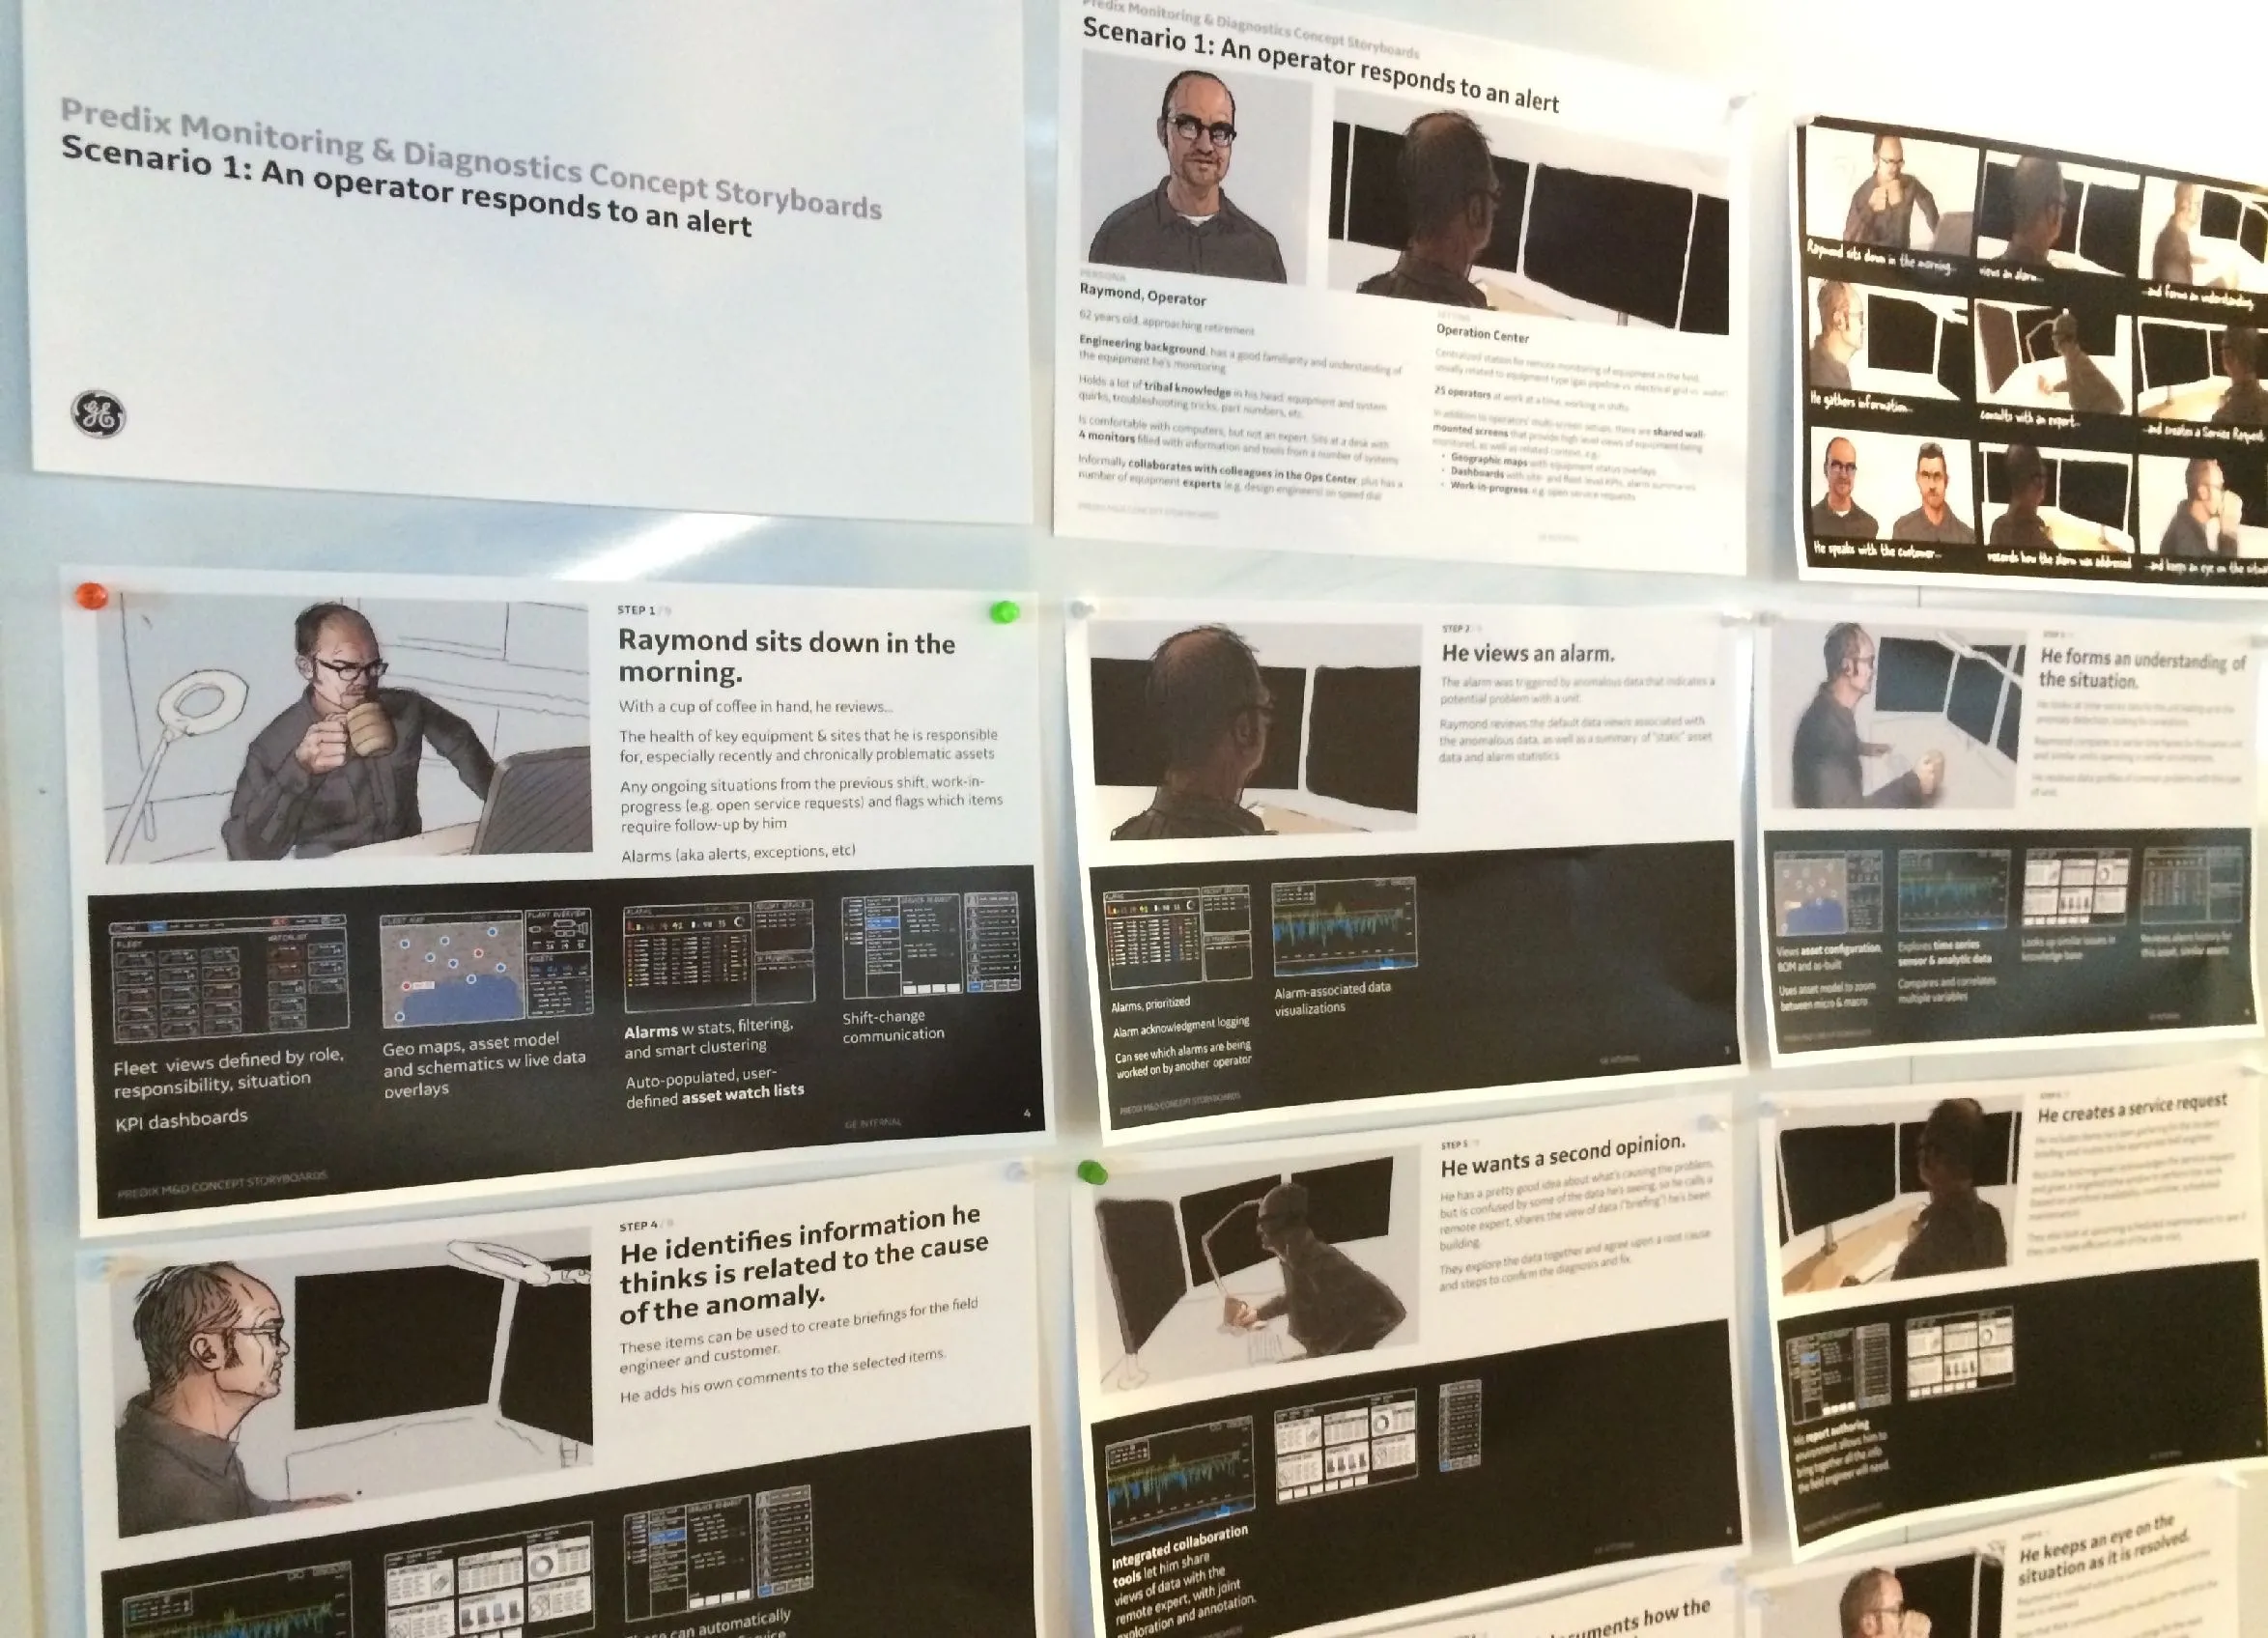
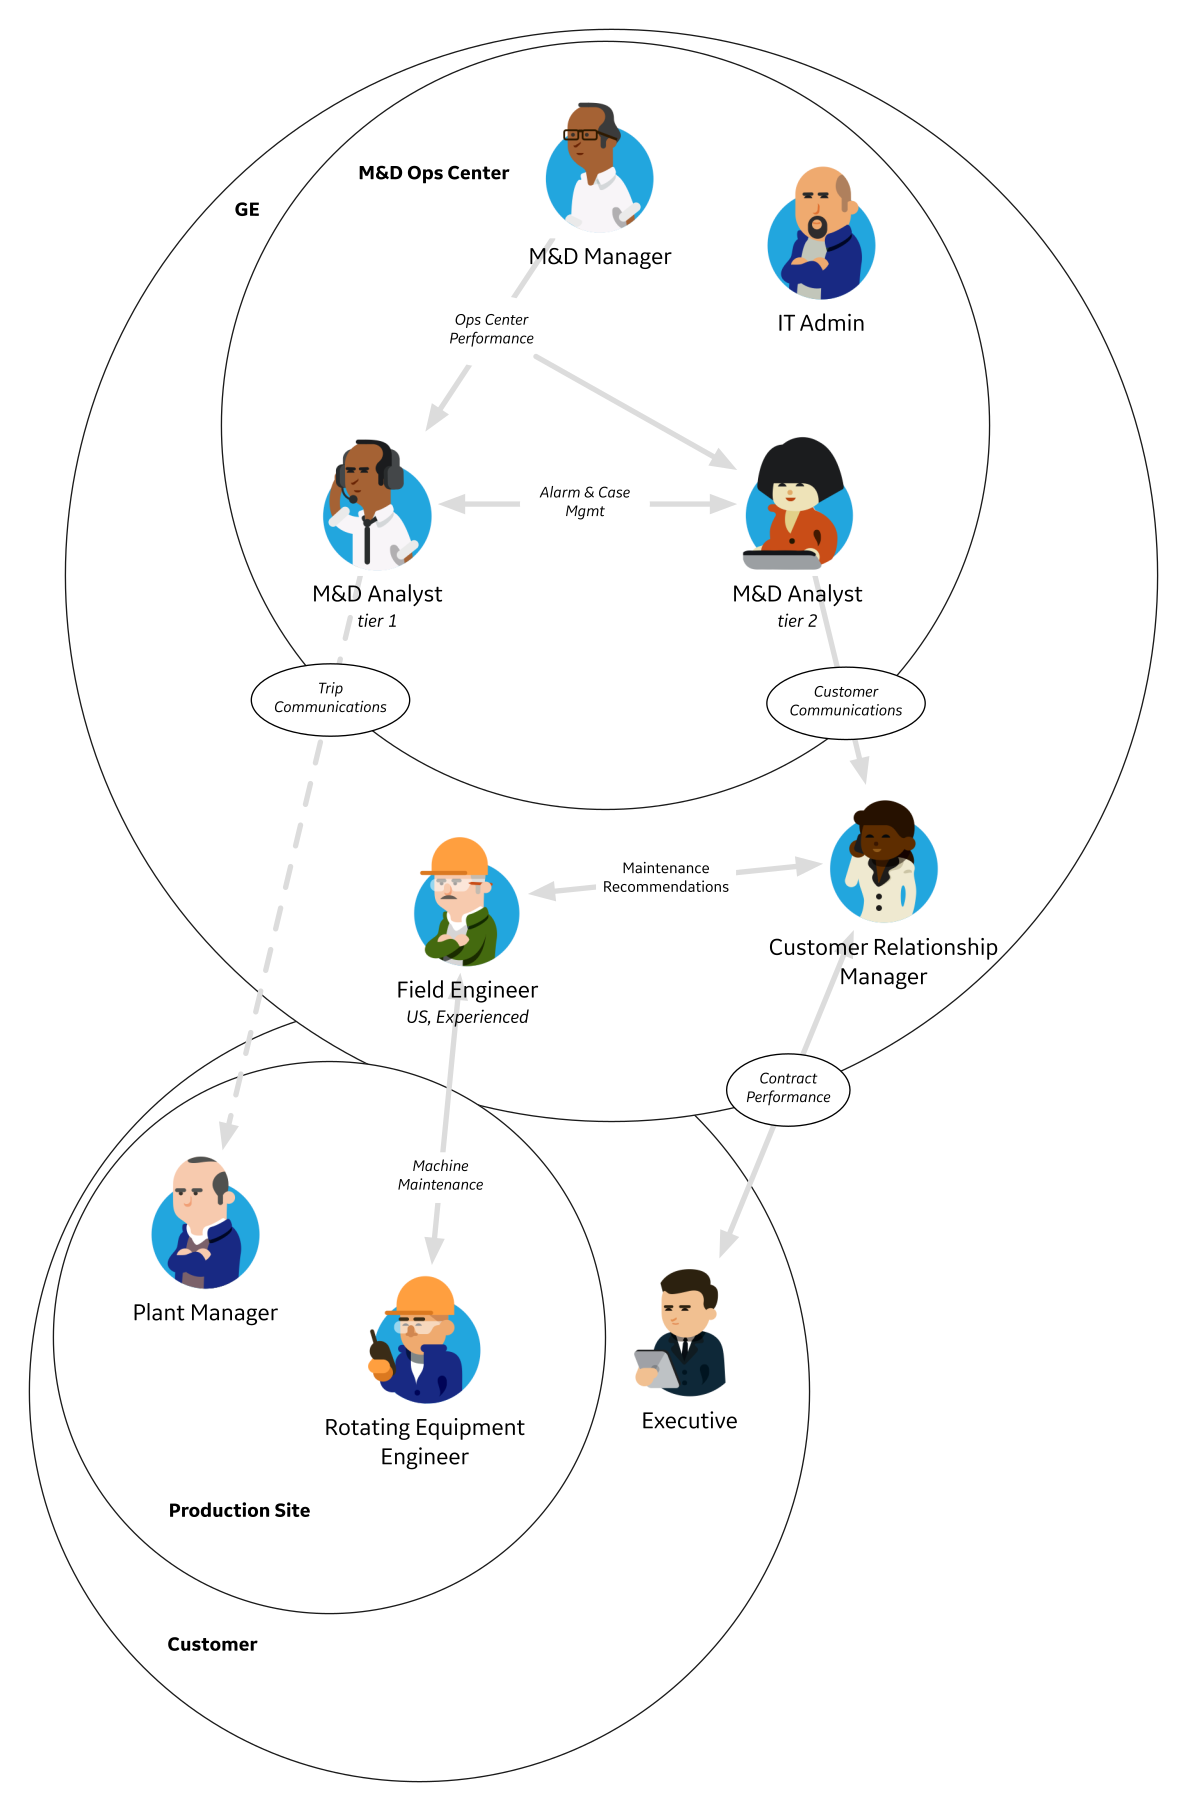
The storyboard printed and pinned to the wall, following the analyst persona Raymond through a day from the first alert to a service request, beside the persona map our interviews produced: the M&D ops center roles, the customer site and the people between them, with the flows of information that join them. The storyboard's thumbnail screens only gesture at what he would need, so the design was not decided before it was understood.
Concept generation
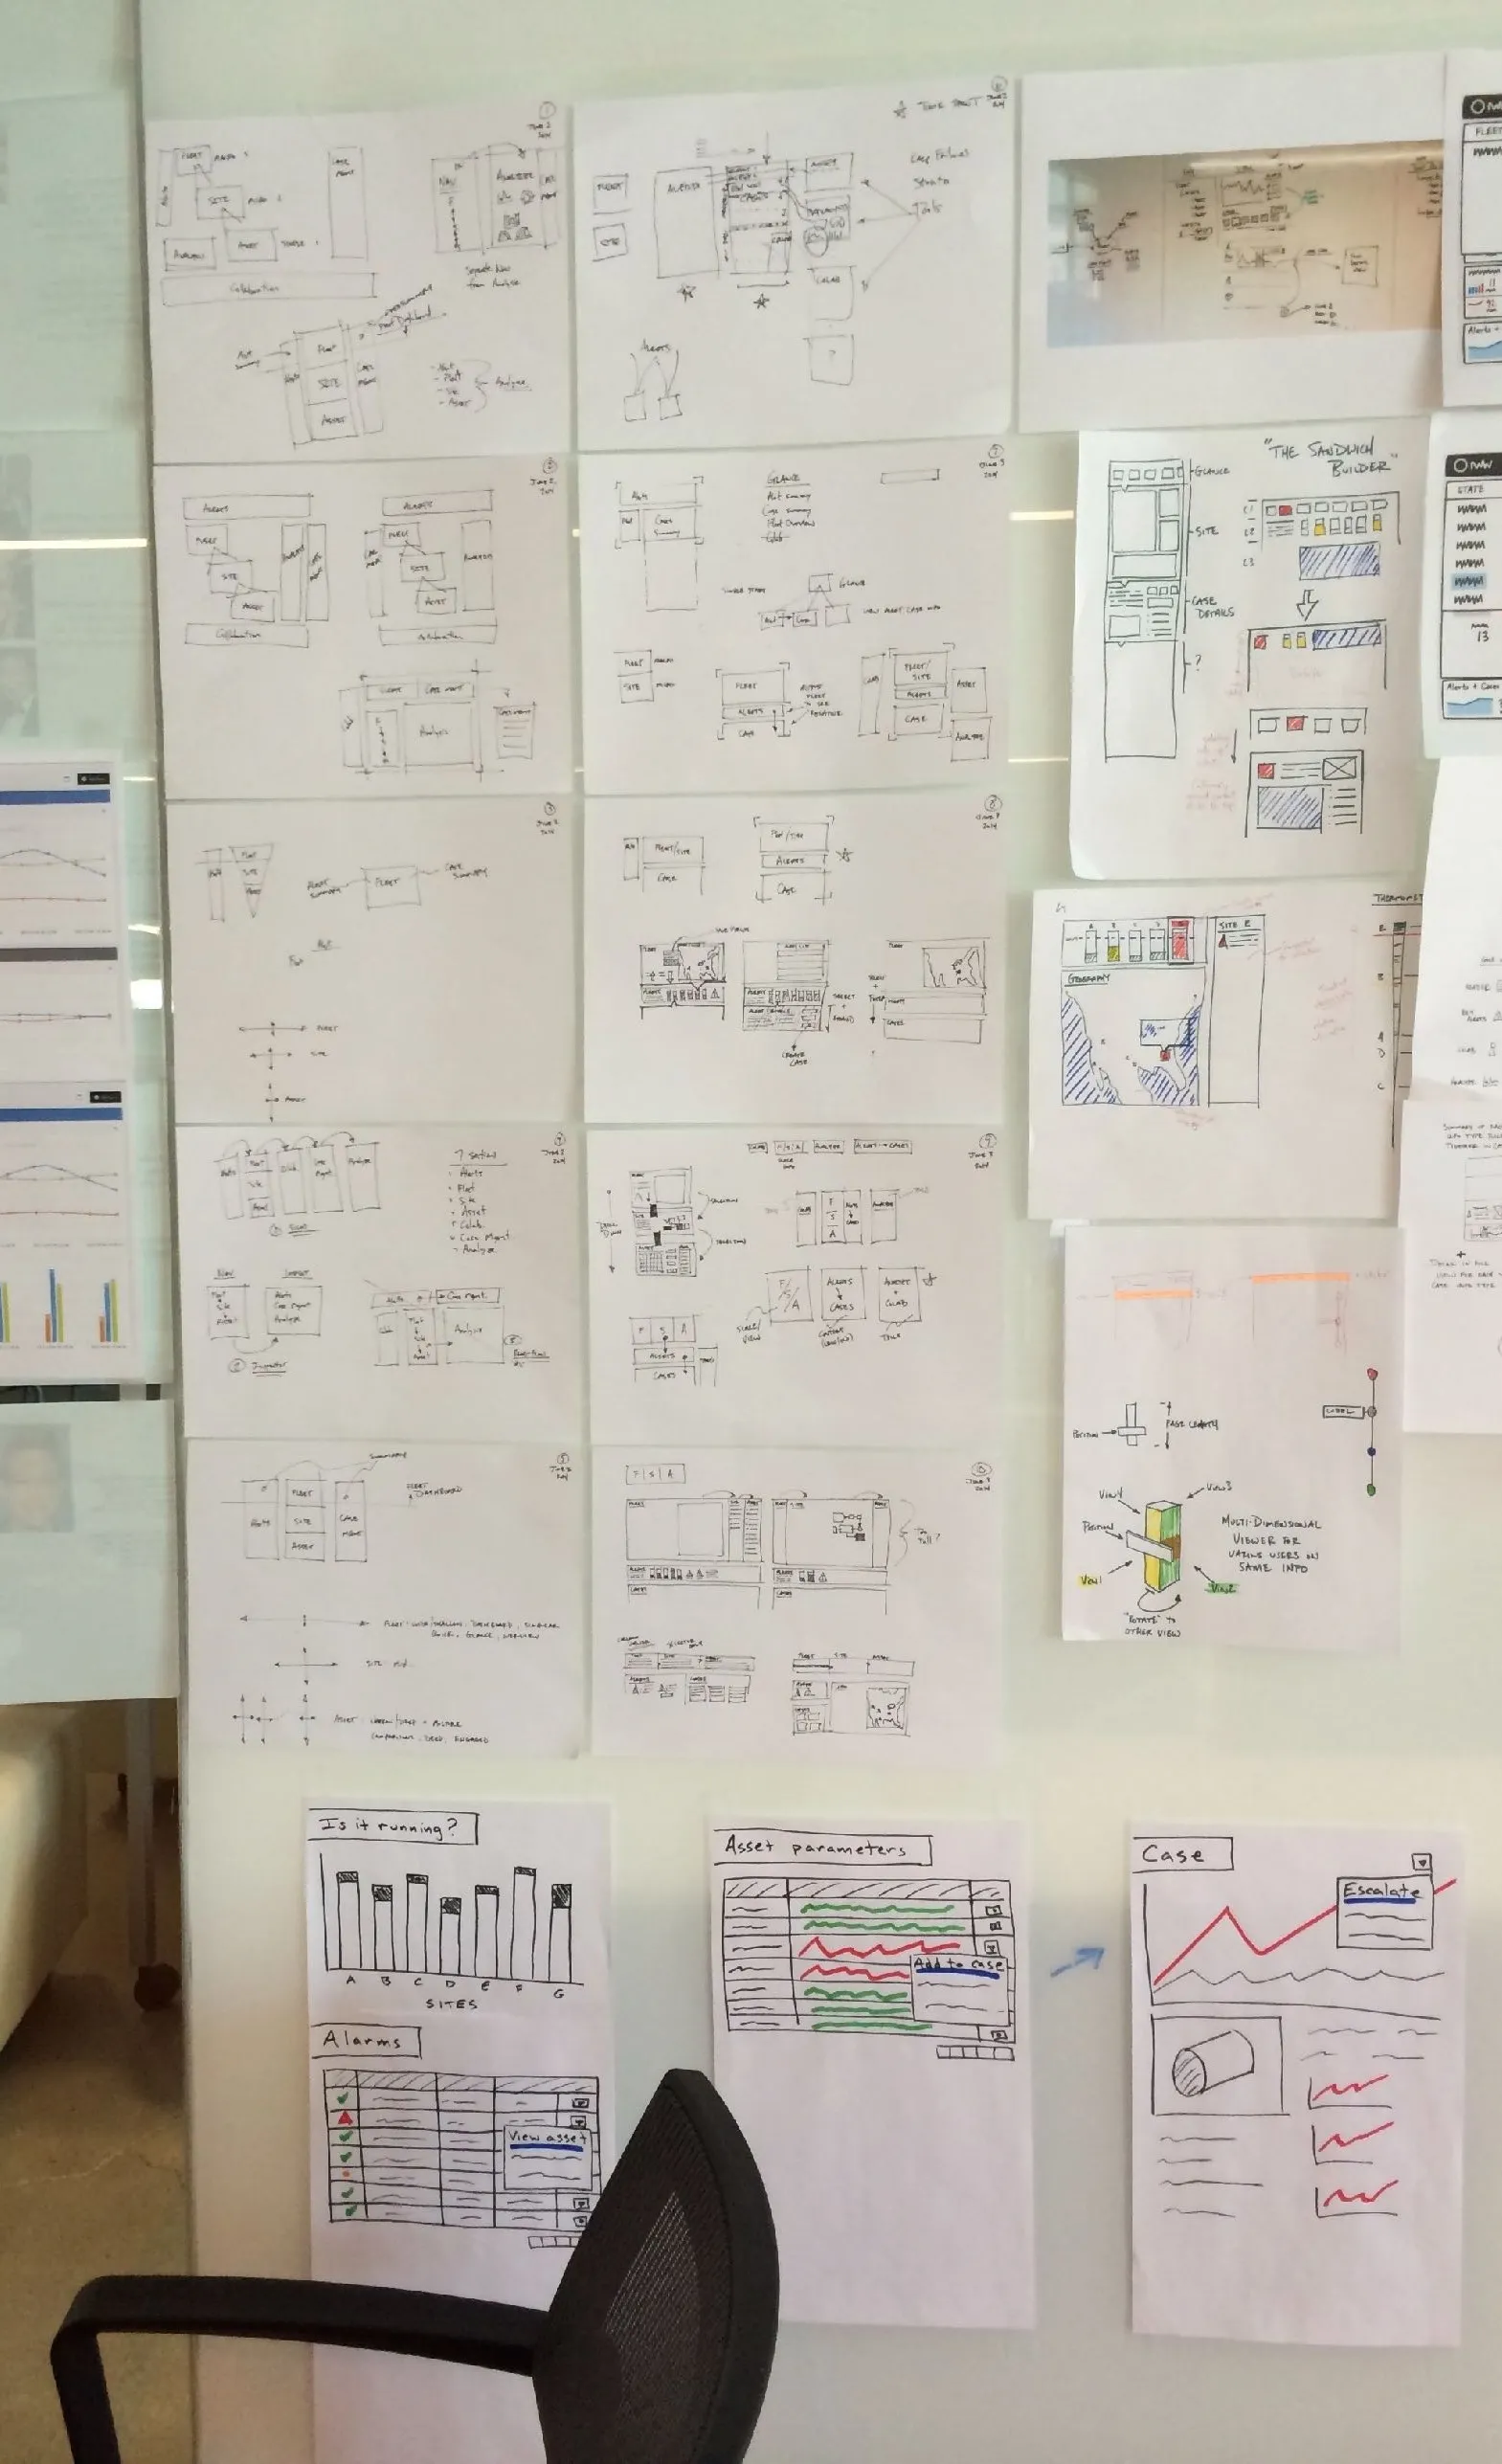
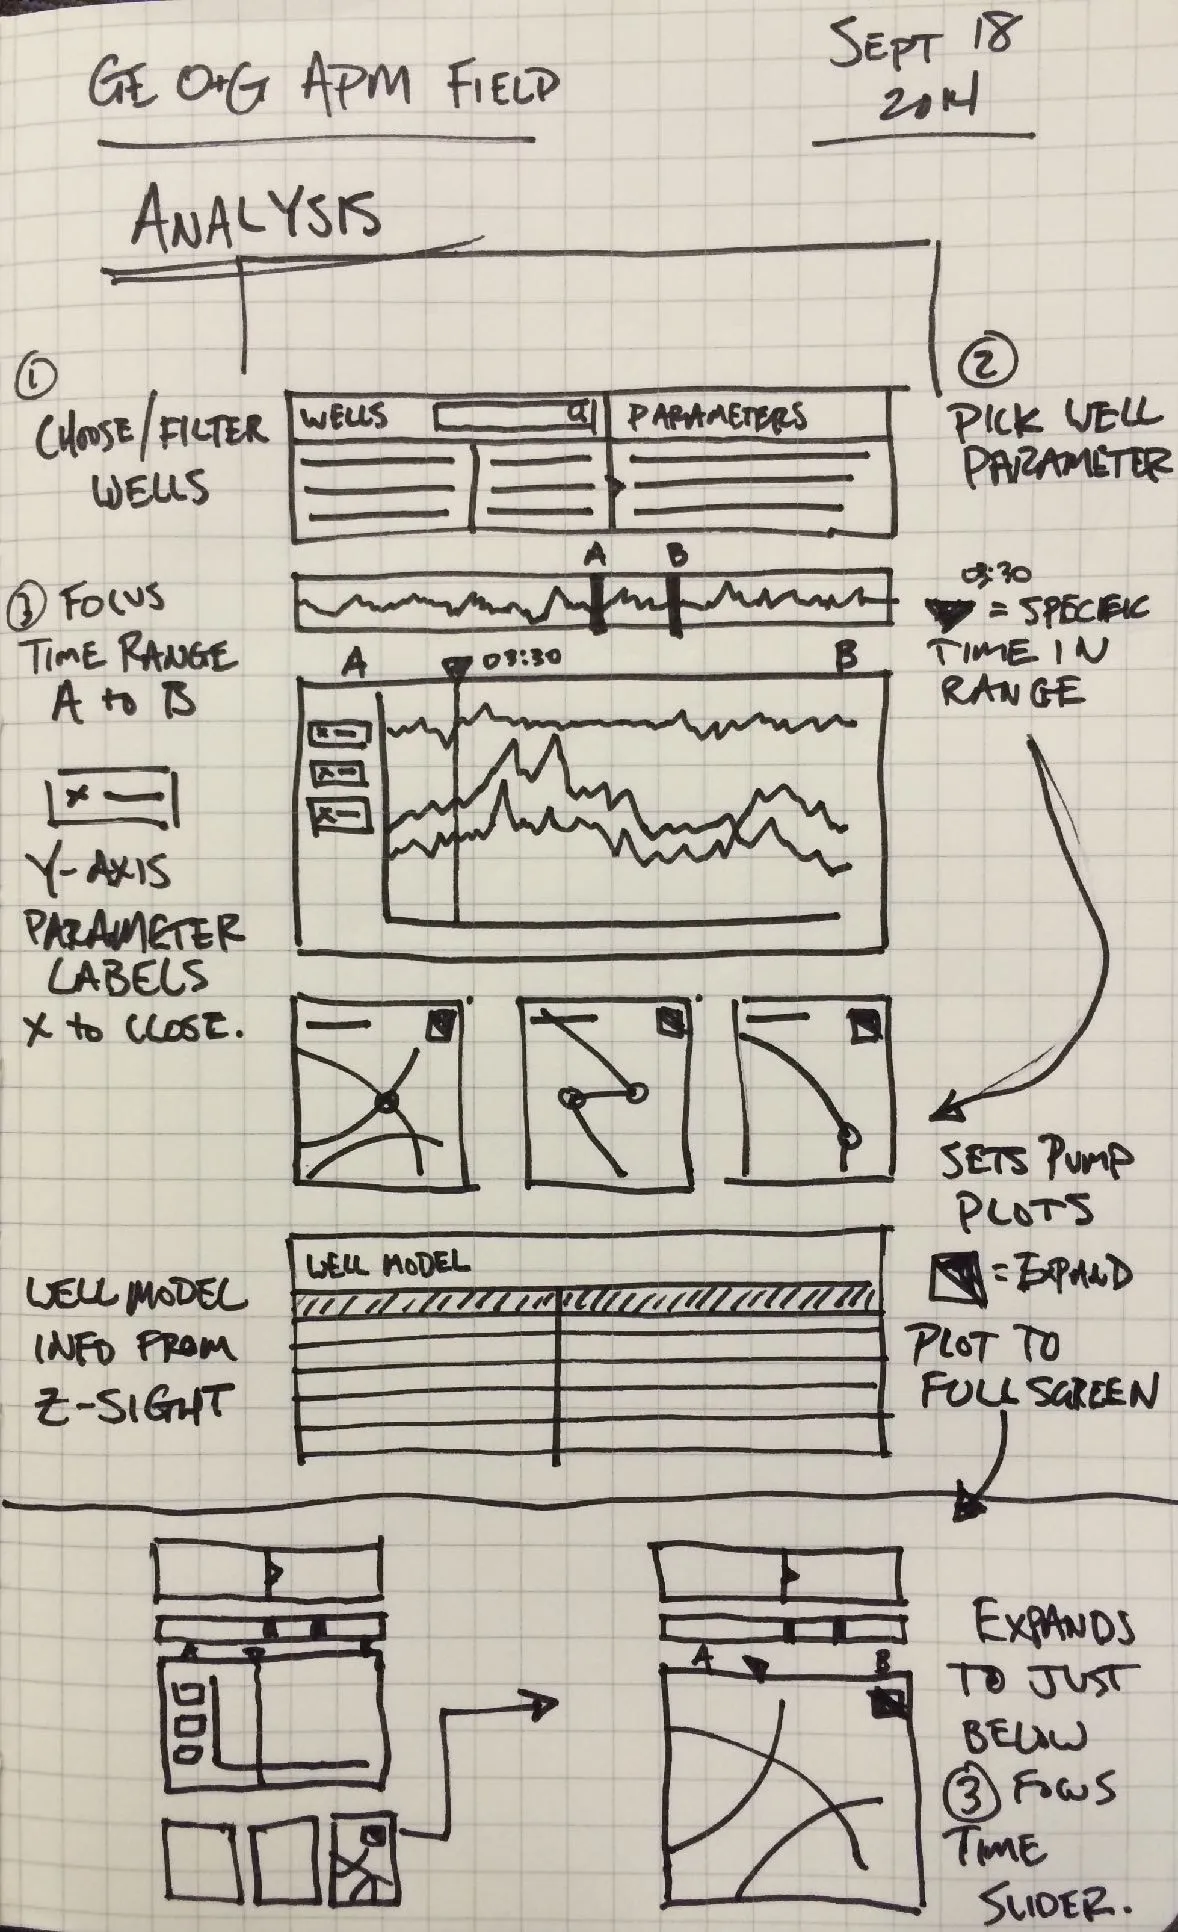
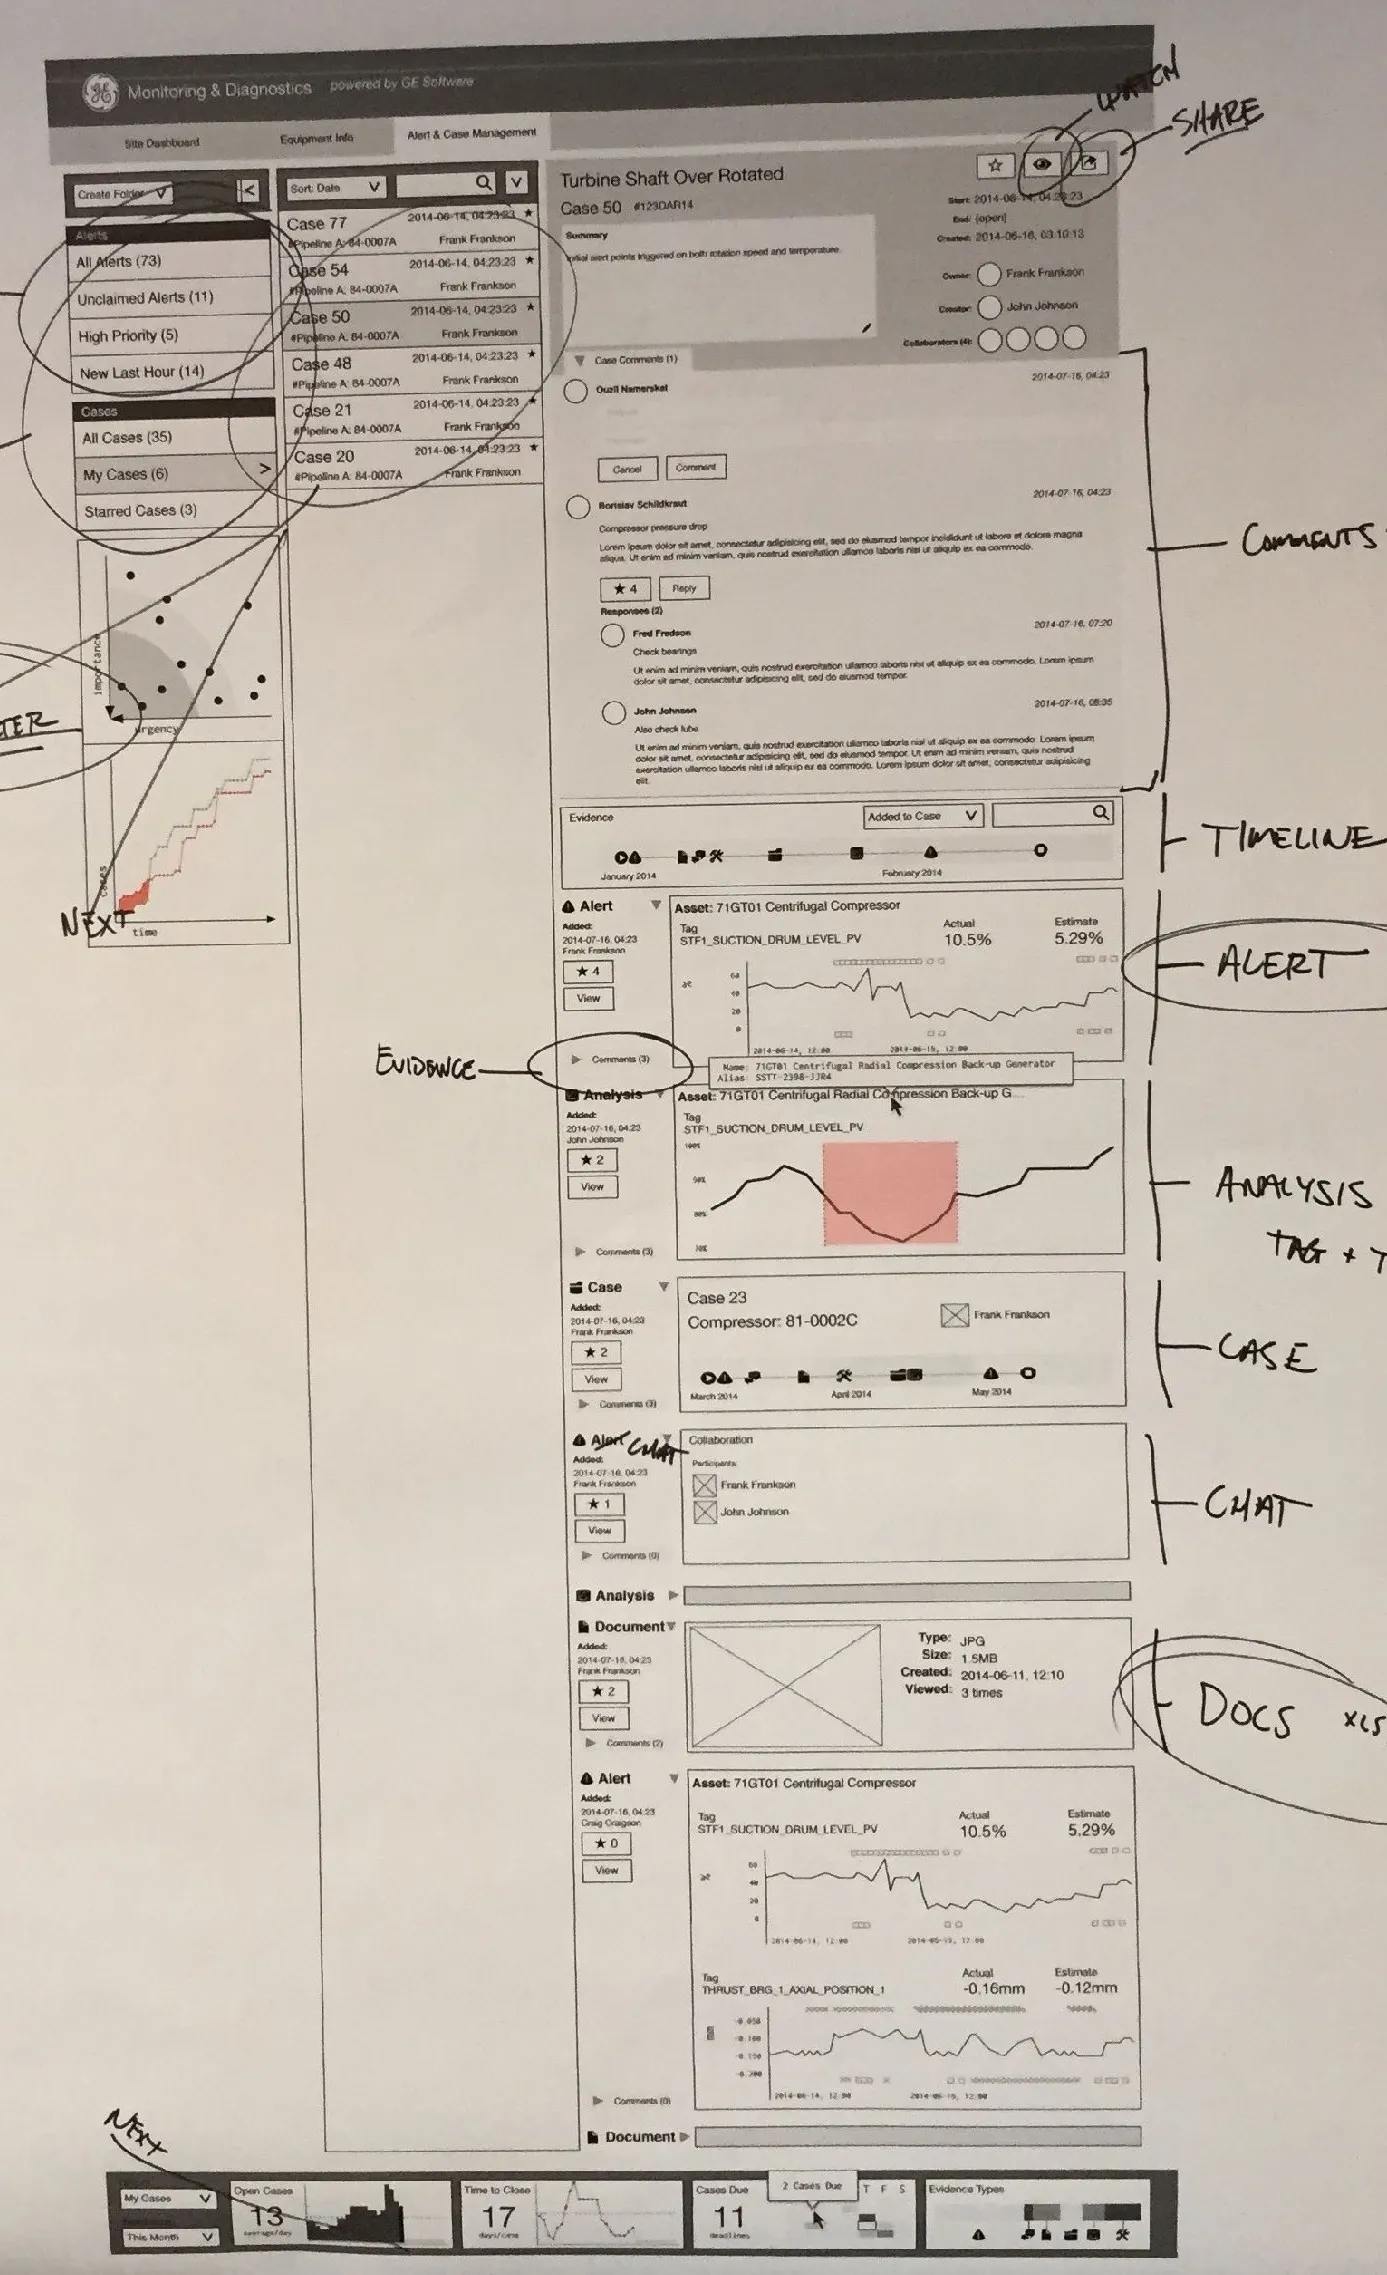
Three stages of concept work, each under the sentence that describes it: a wall of layout and navigation sketches, a notebook page working out an analysis screen for well data, and a printed wireframe of the case view marked up by hand. I move from rough to specific in the open, and each round was critiqued with the M&D analysts before the next.
Prototype
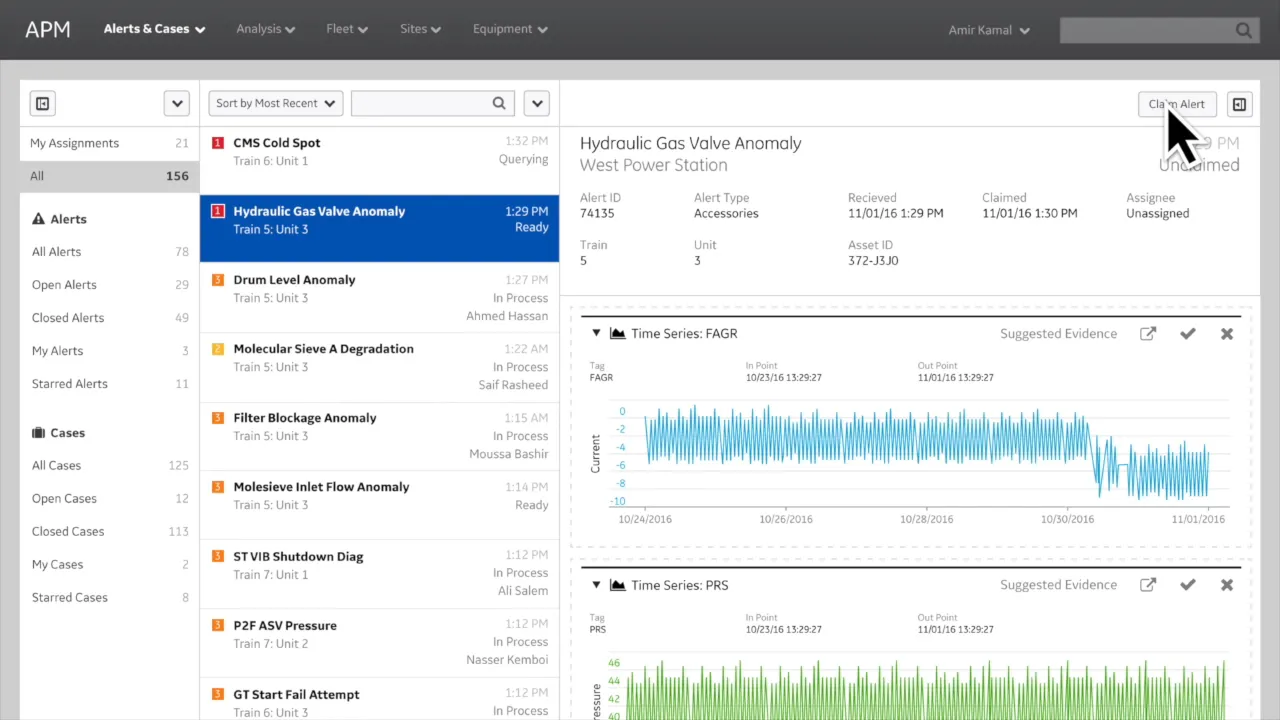
The demo video that the work culminated in: a high-resolution prototype of the APM interface walking through a realistic storyline of alerts, evidence and cases. It is what persuaded GE Digital to fund and start building the product suite, and it shows how I use a believable story to carry a vision.
 Video, 2:17
Text equivalent: The work culminated in a high resolution demo based on a realistic storyline and set of behaviors. This set a vision for GE Digital to allocate funding and initiate building the Asset Performance Management product suite.
Results
What came of the work, in three lines, beside the wooden award cube GE Digital gave me for the design patent. The research seeded the Predix APM product direction, defined its experience architecture and vision, and captured three patents.
- Seeded Predix APM product direction
- Captured 3 additional patents
- Defined experience architecture & vision
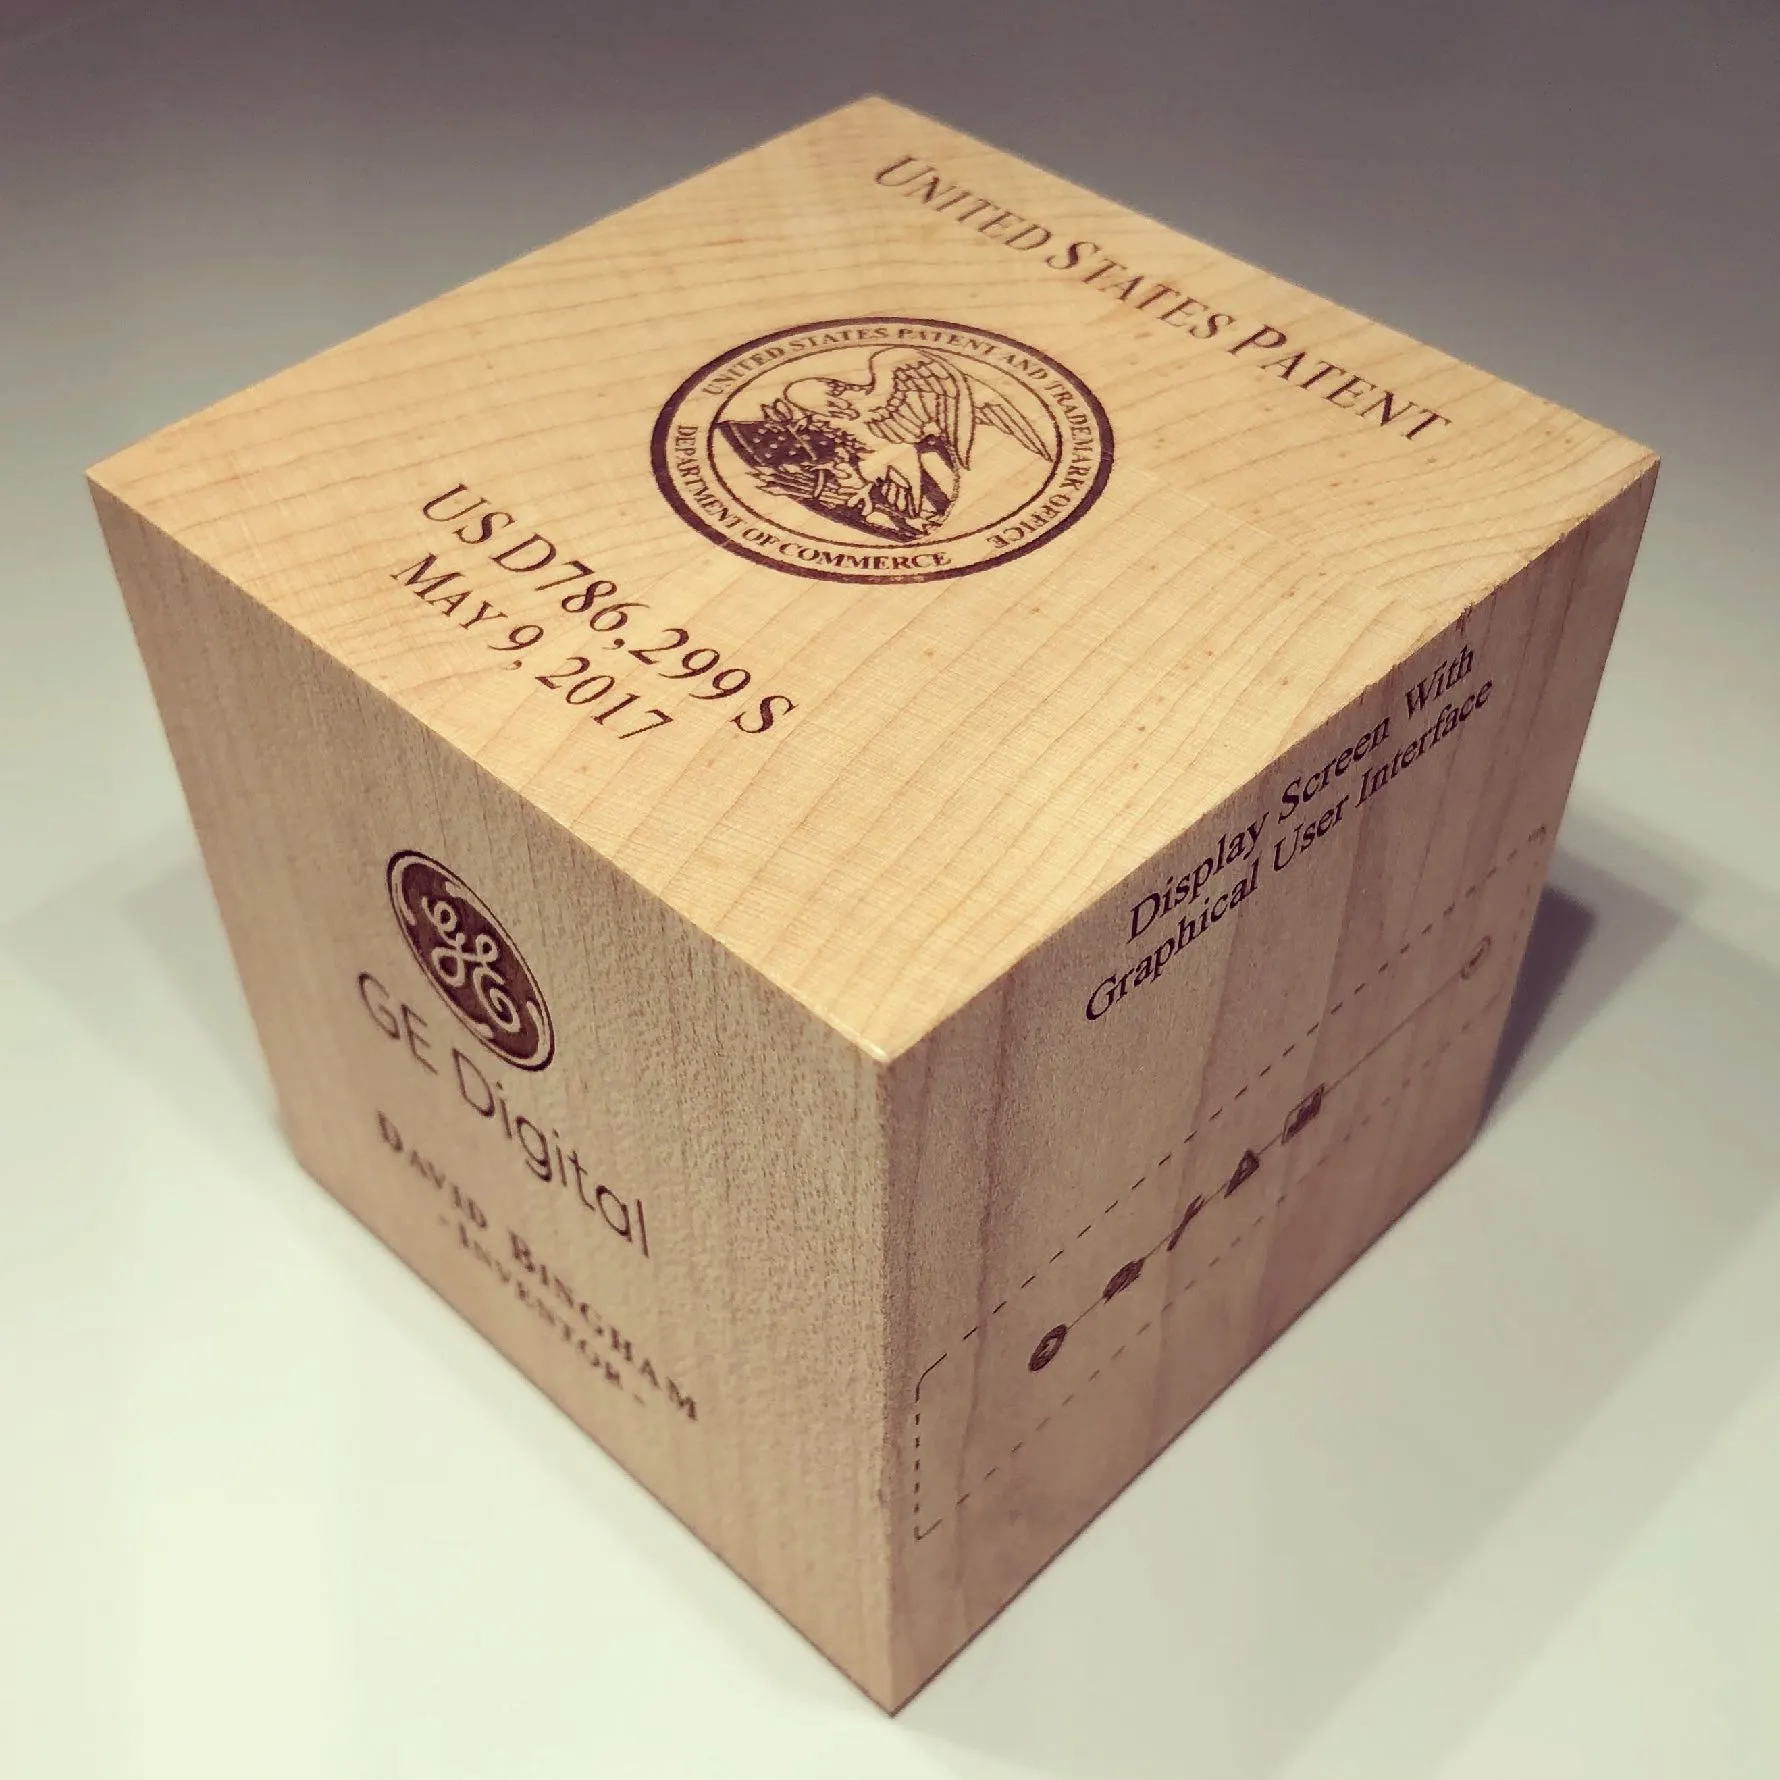
The three patents the effort captured, each linking to its record on the Patents page: a design patent on the interface itself, a utility patent on monitoring and reporting equipment status, and an application on binding a graphical display to a case. They are the part of the design that the patent office examined.
Display screen with graphical user interface
Design patent · 2017
Monitoring and reporting of industrial equipment status
Utility patent · 2019
Method and apparatus for providing a graphical display associated with a case
PCT application · 2017
One idea across three records, earliest first: the case-display patent of 2015, this project (2014–2015), and KBOps (2022). The case display designed here was filed as a patent in 2015, and KBOps carried its idea, an expert's interpretation sent to the people who act on it, into a shipped product.
LineageEarliest first · 3 records
- Patent · 2015Case display
- 2014–2015Asset Performance Management
- 2022KBOps
AI usage
2, Ideas. AI helped with research, sources, brainstorming or structure. I wrote every word.The tiers