Align 4 disparate applications into a common interface in ~2 weeks.
I had about two weeks to align four of GE's oil and gas applications into one interface. This page follows that fortnight in the order I presented it: the schedule, the four applications, the Houston workshop and the design that came out of it.
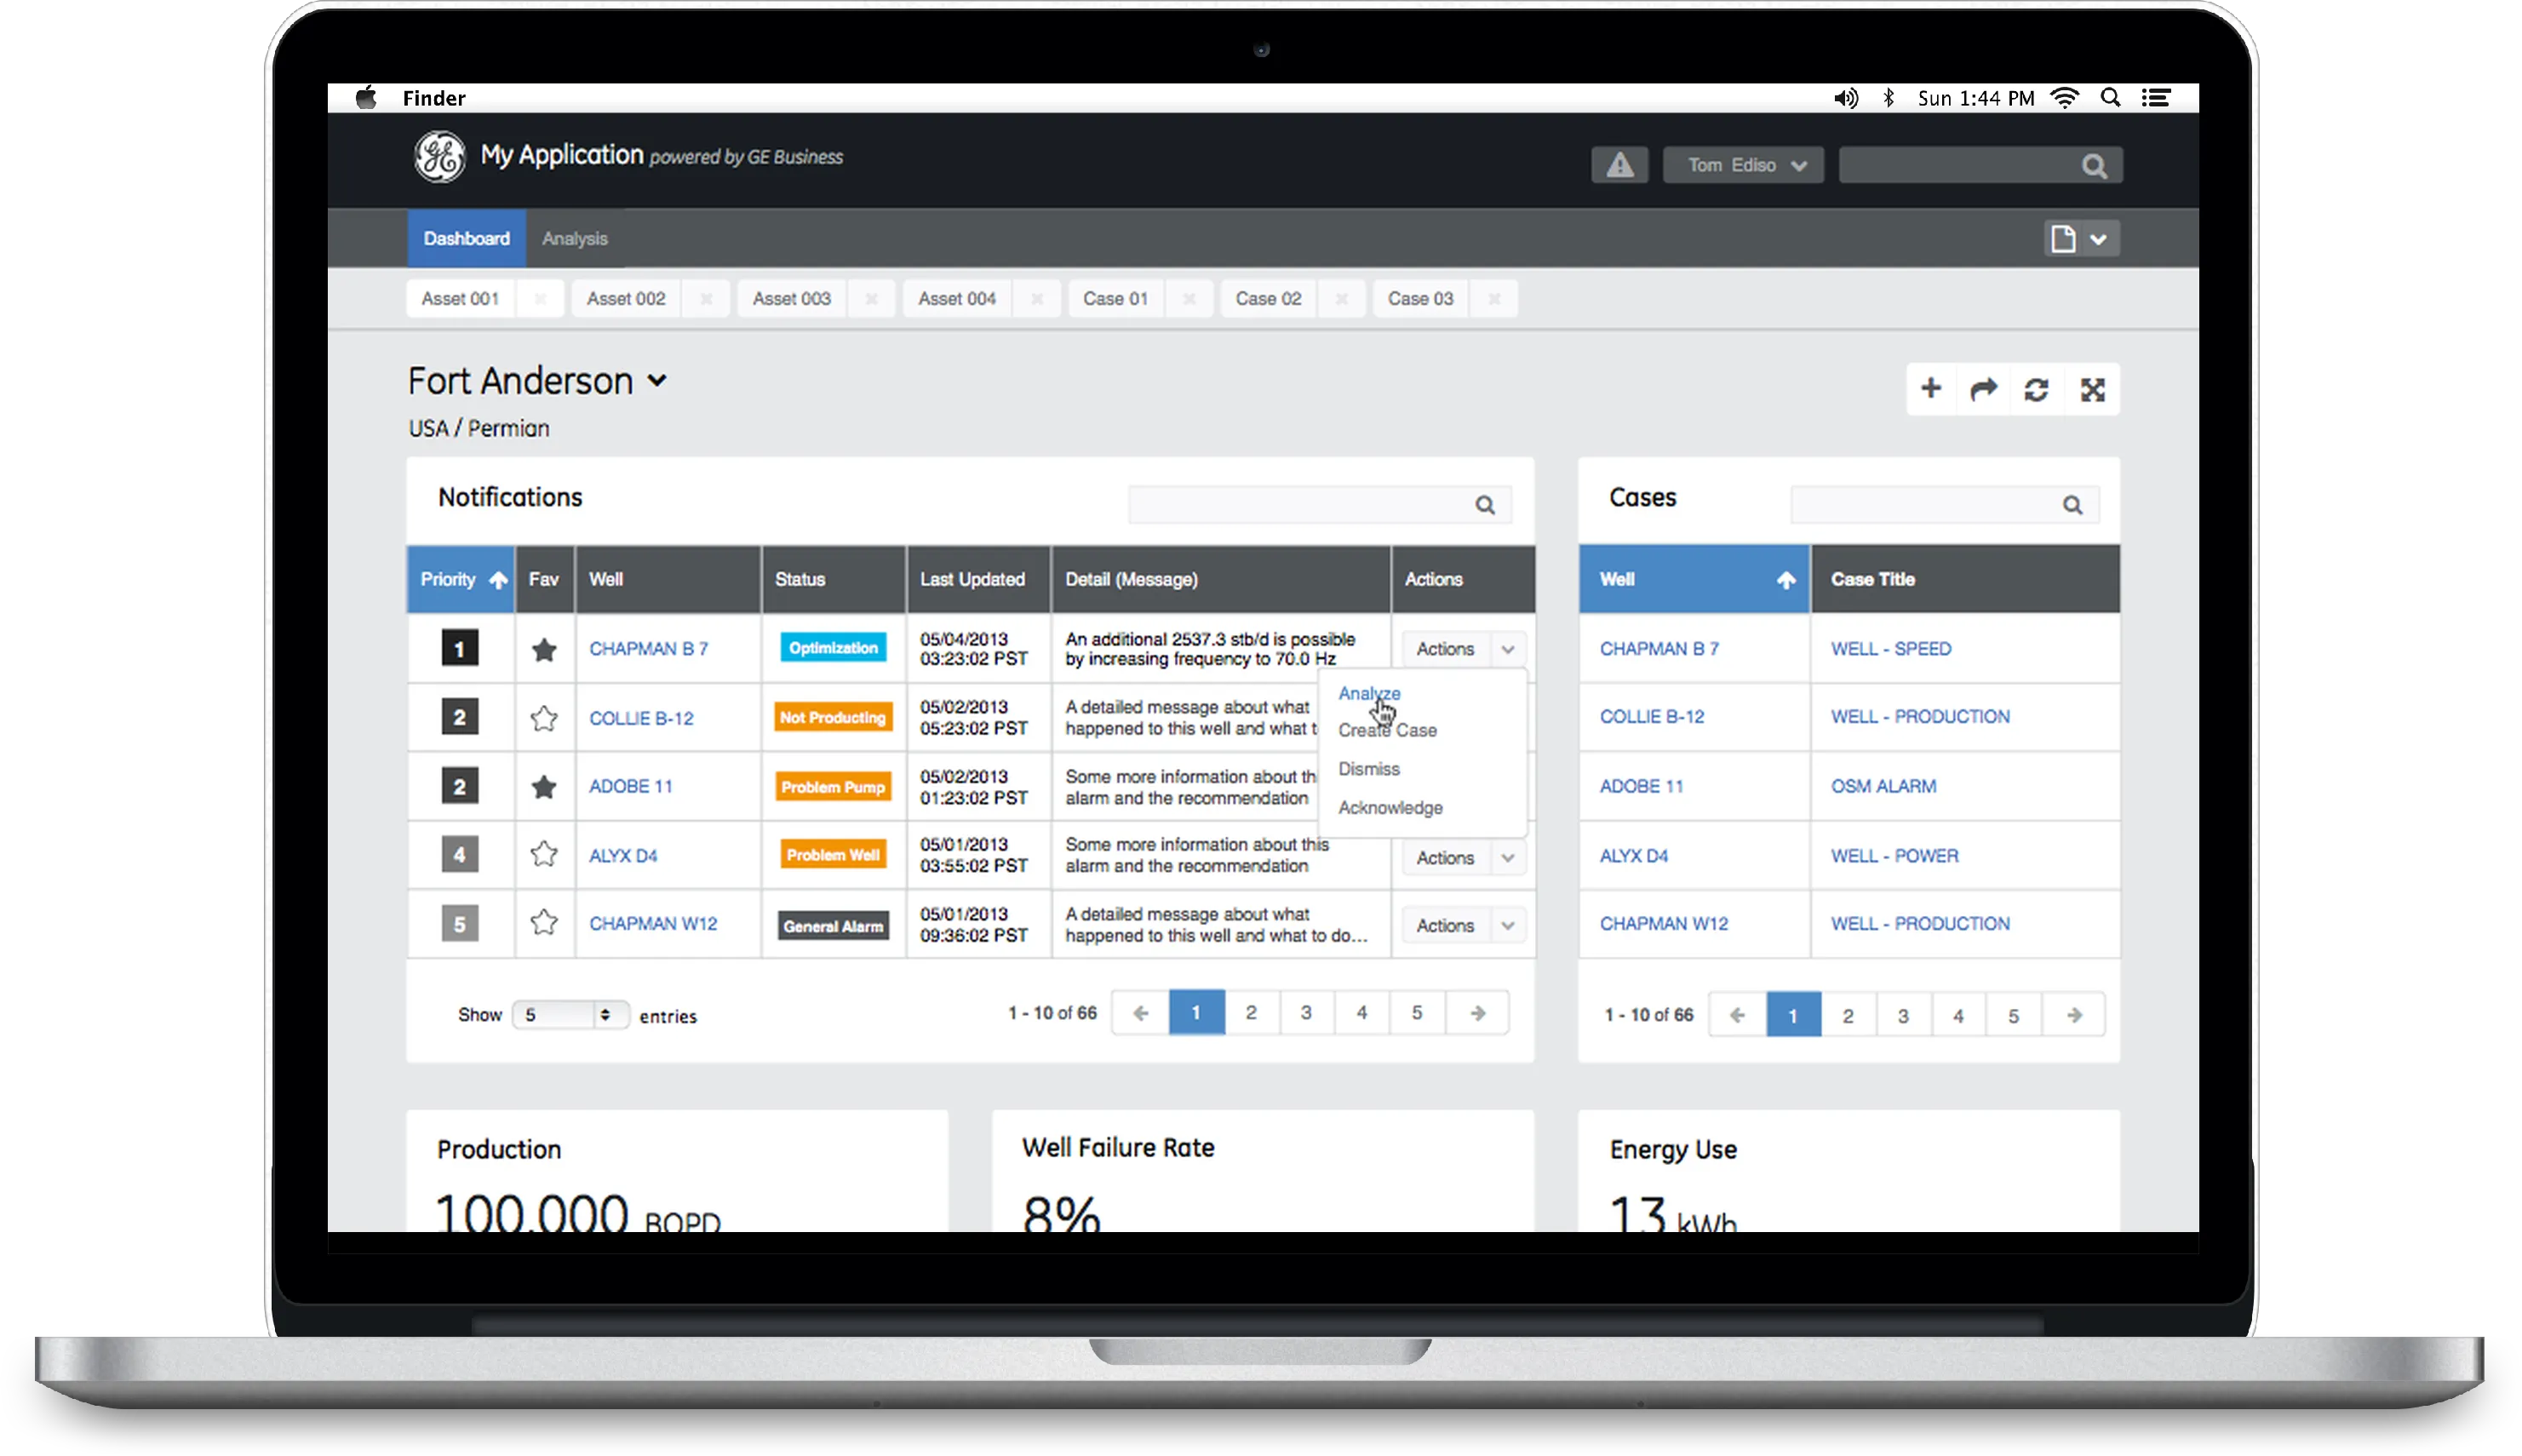
Well Insight
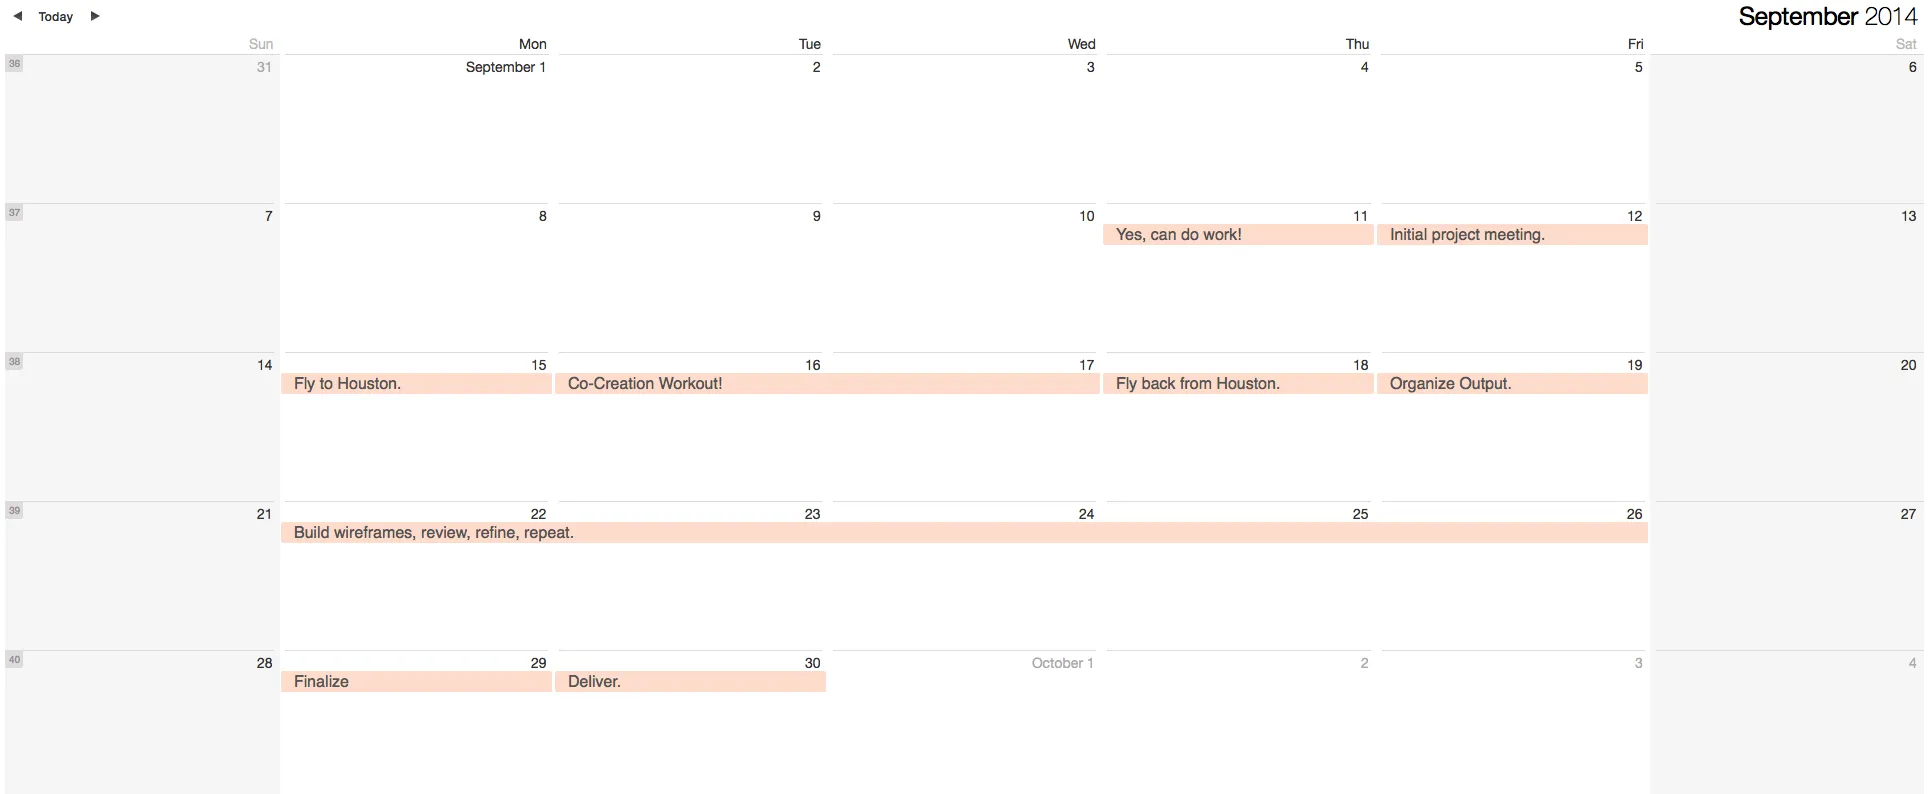
Imposed schedule
The brief arrived on 11 September 2014 and the deliverable was due on the 30th, so the calendar was the plan: a co-creation workshop in Houston in the first week, a week of wireframes in the second. I show it because the constraint shaped every choice that follows.
Legacy applications
These are the four applications as they stood: Field Vantage's well detail, Z-Sight's gauge dashboard, iWellSCADA's grid view and Smart Signal's fleet view, each with its own visual language and a different piece of the operator's job. Side by side they are the problem statement: an operator had to swivel between all four.
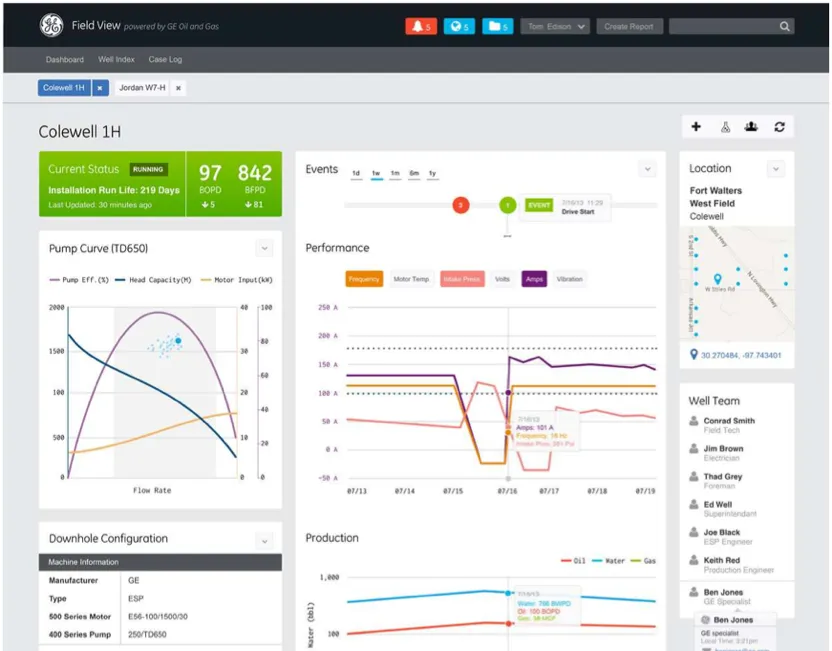
Field Vantage
A 360-degree view of each ESP well; alarms ranked across the field.
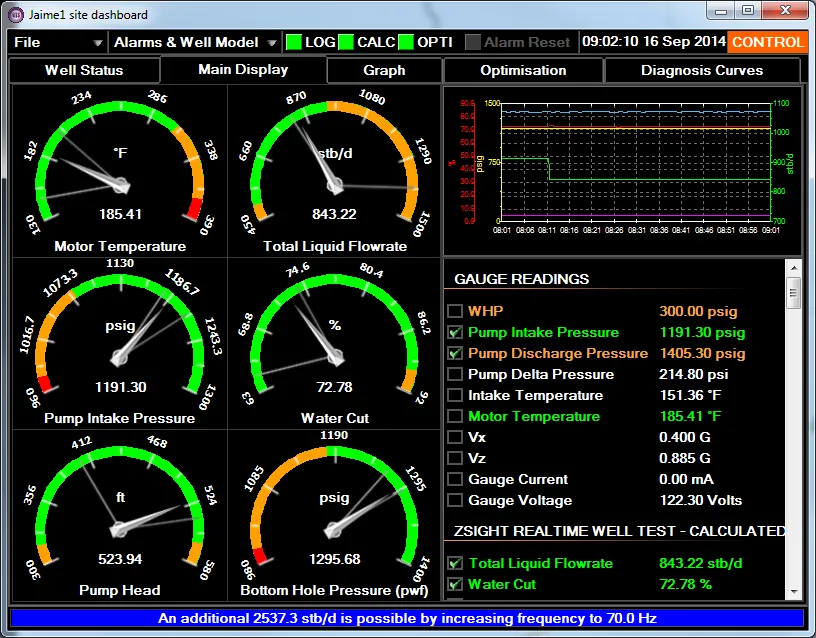
Z-Sight
Live downhole gauges; models estimate unmeasured values and calculate pump set points.
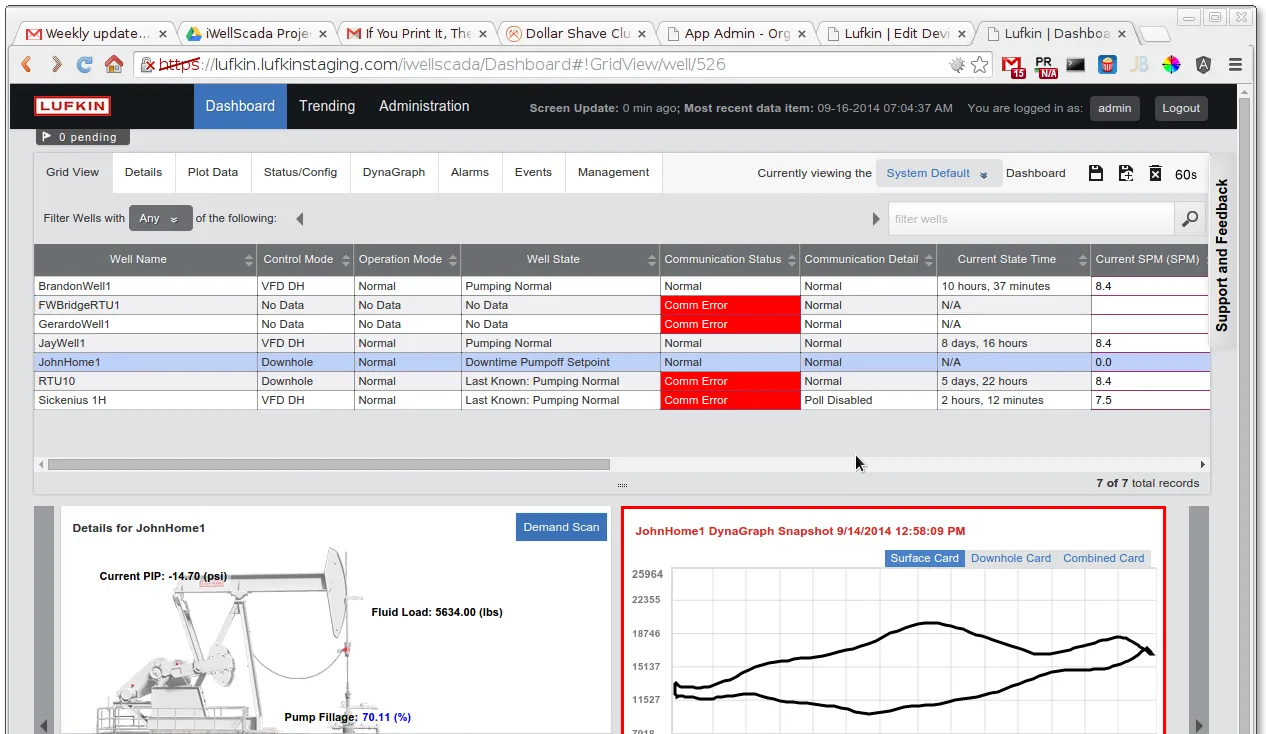
iWellSCADA
Field-wide communication and control of rod pumps, read through dynagraph cards.
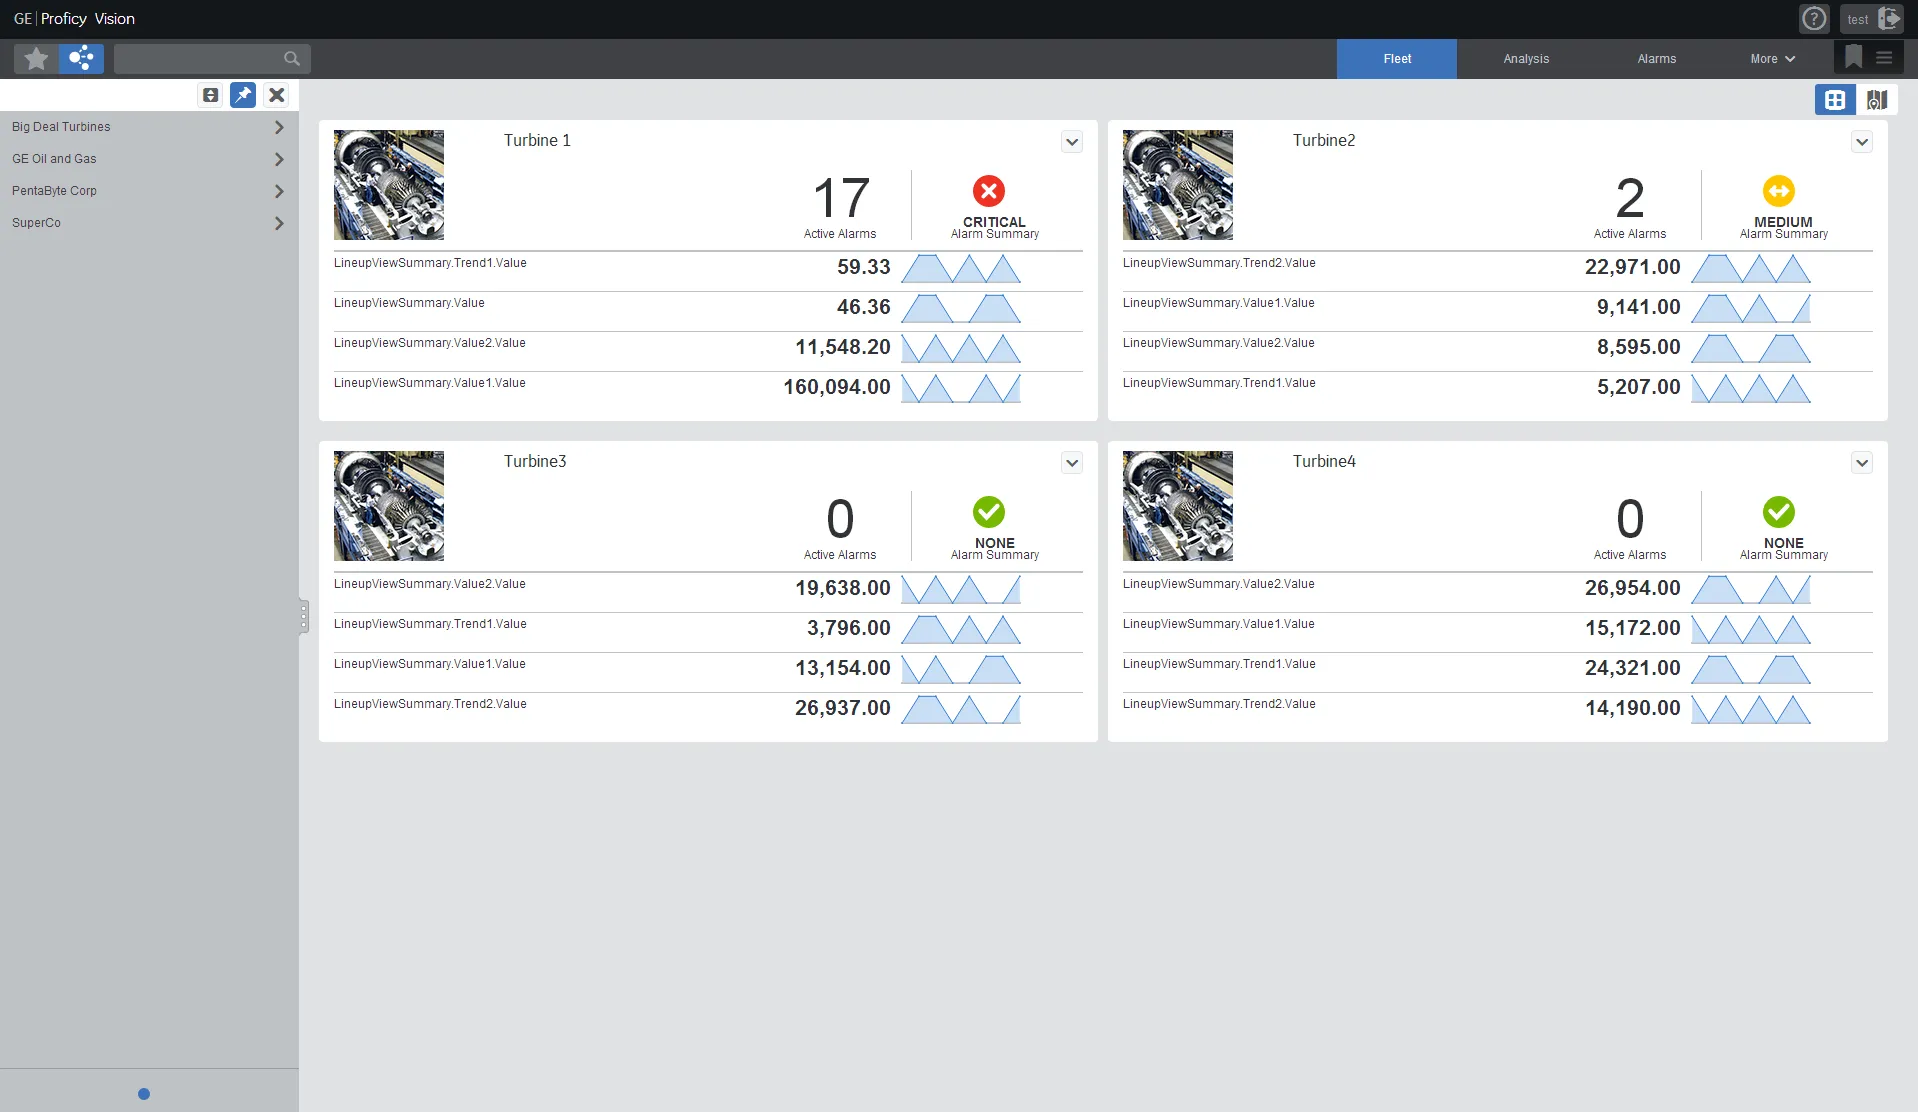
Smart Signal
Predicts equipment failures from sensor patterns across a whole fleet of assets.
Workshop
The working session in Houston: GE and Accenture with the O&G team in a conference room, the printed screens of the four applications already pinned to the glass wall behind them. We guided the process and the O&G team taught us the industry.
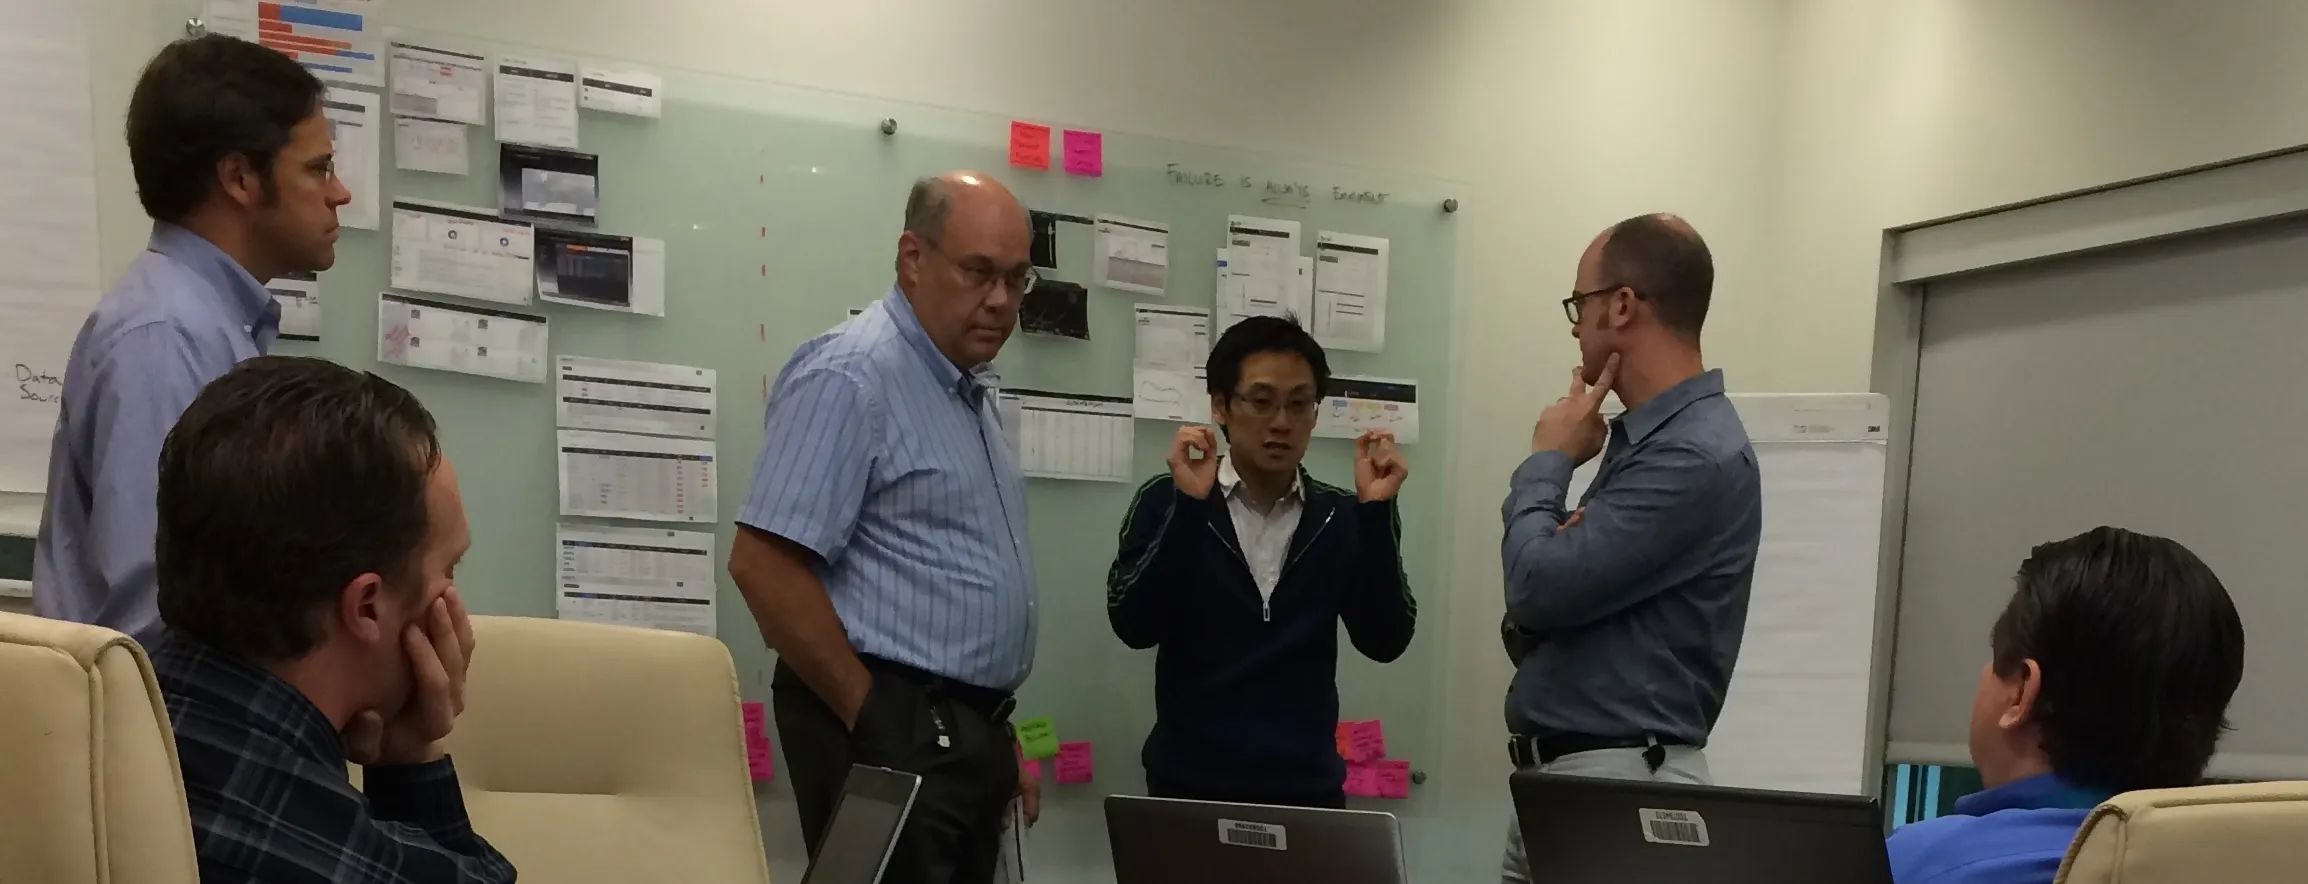
The workshop's four stages on the wall: the flipcharts that set the method, user, problems, tools and functionality, then the sketch; the user journey in sticky notes on the glass; every application's screens printed, cut out and pinned onto that journey; and the common interface sketched over the same wall, three pages, a site dashboard, the wells and an ESP analysis view.
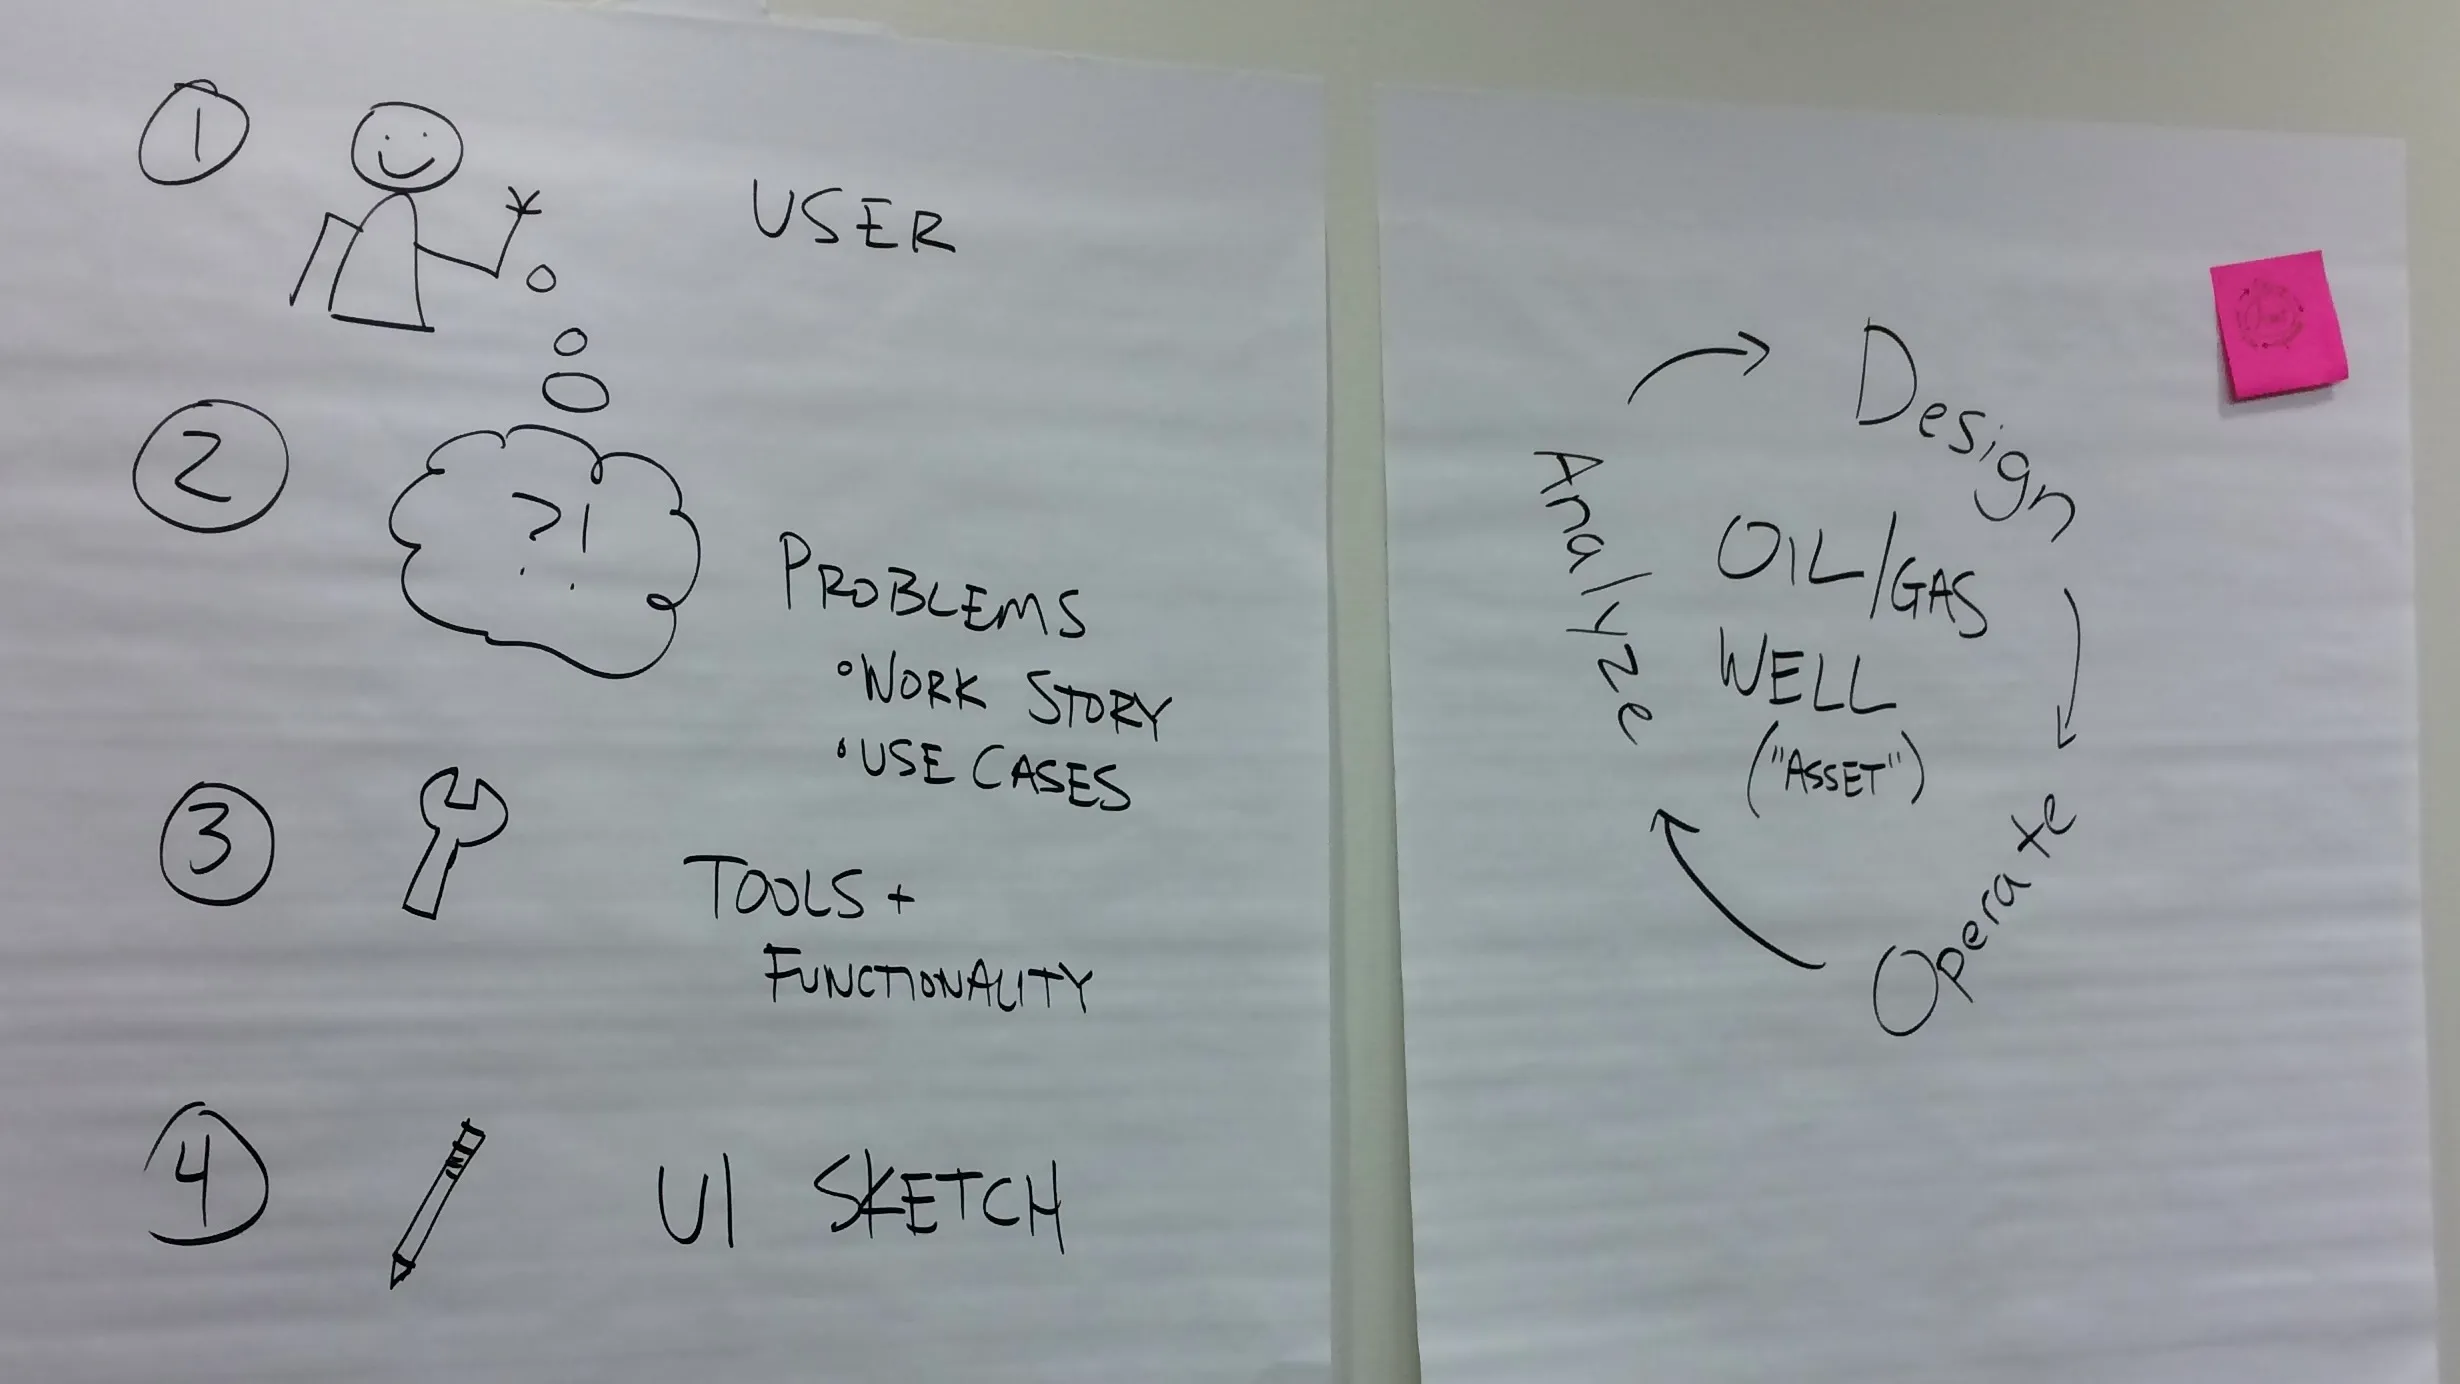
We guided the process while the oil and gas team helped us understand the industry.
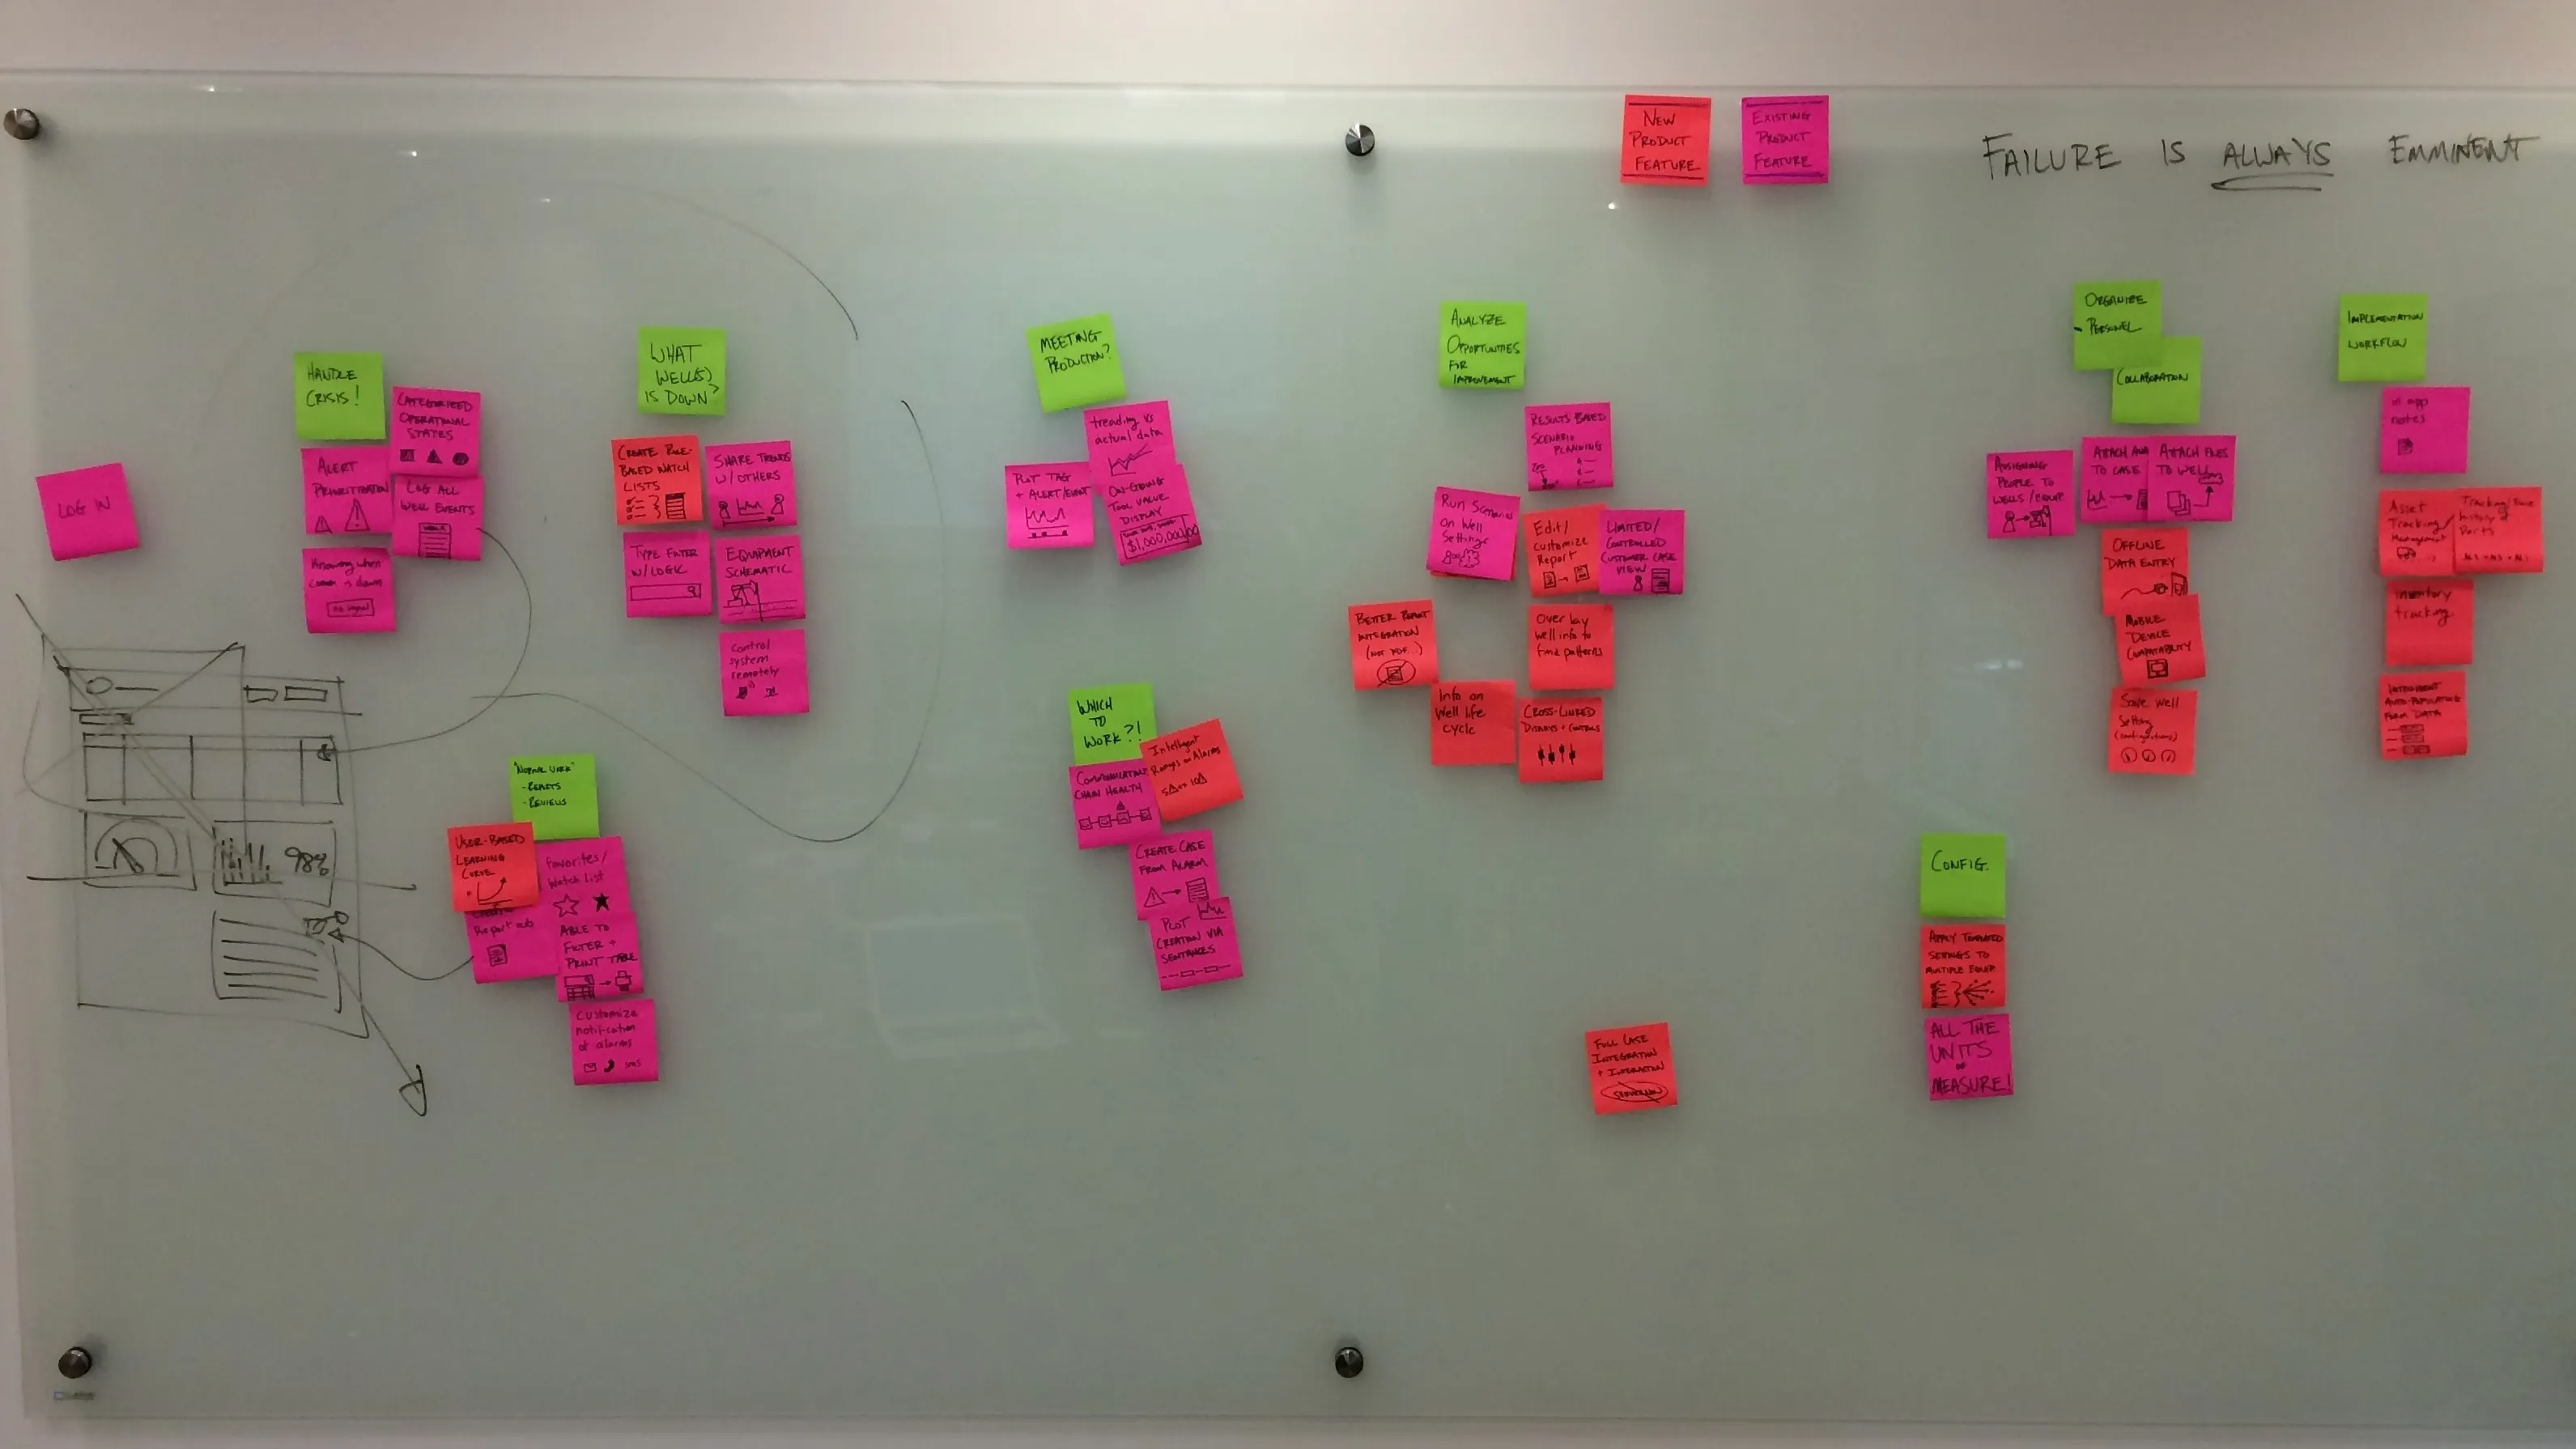
User journey stages (green), new feature (red), existing feature (pink).
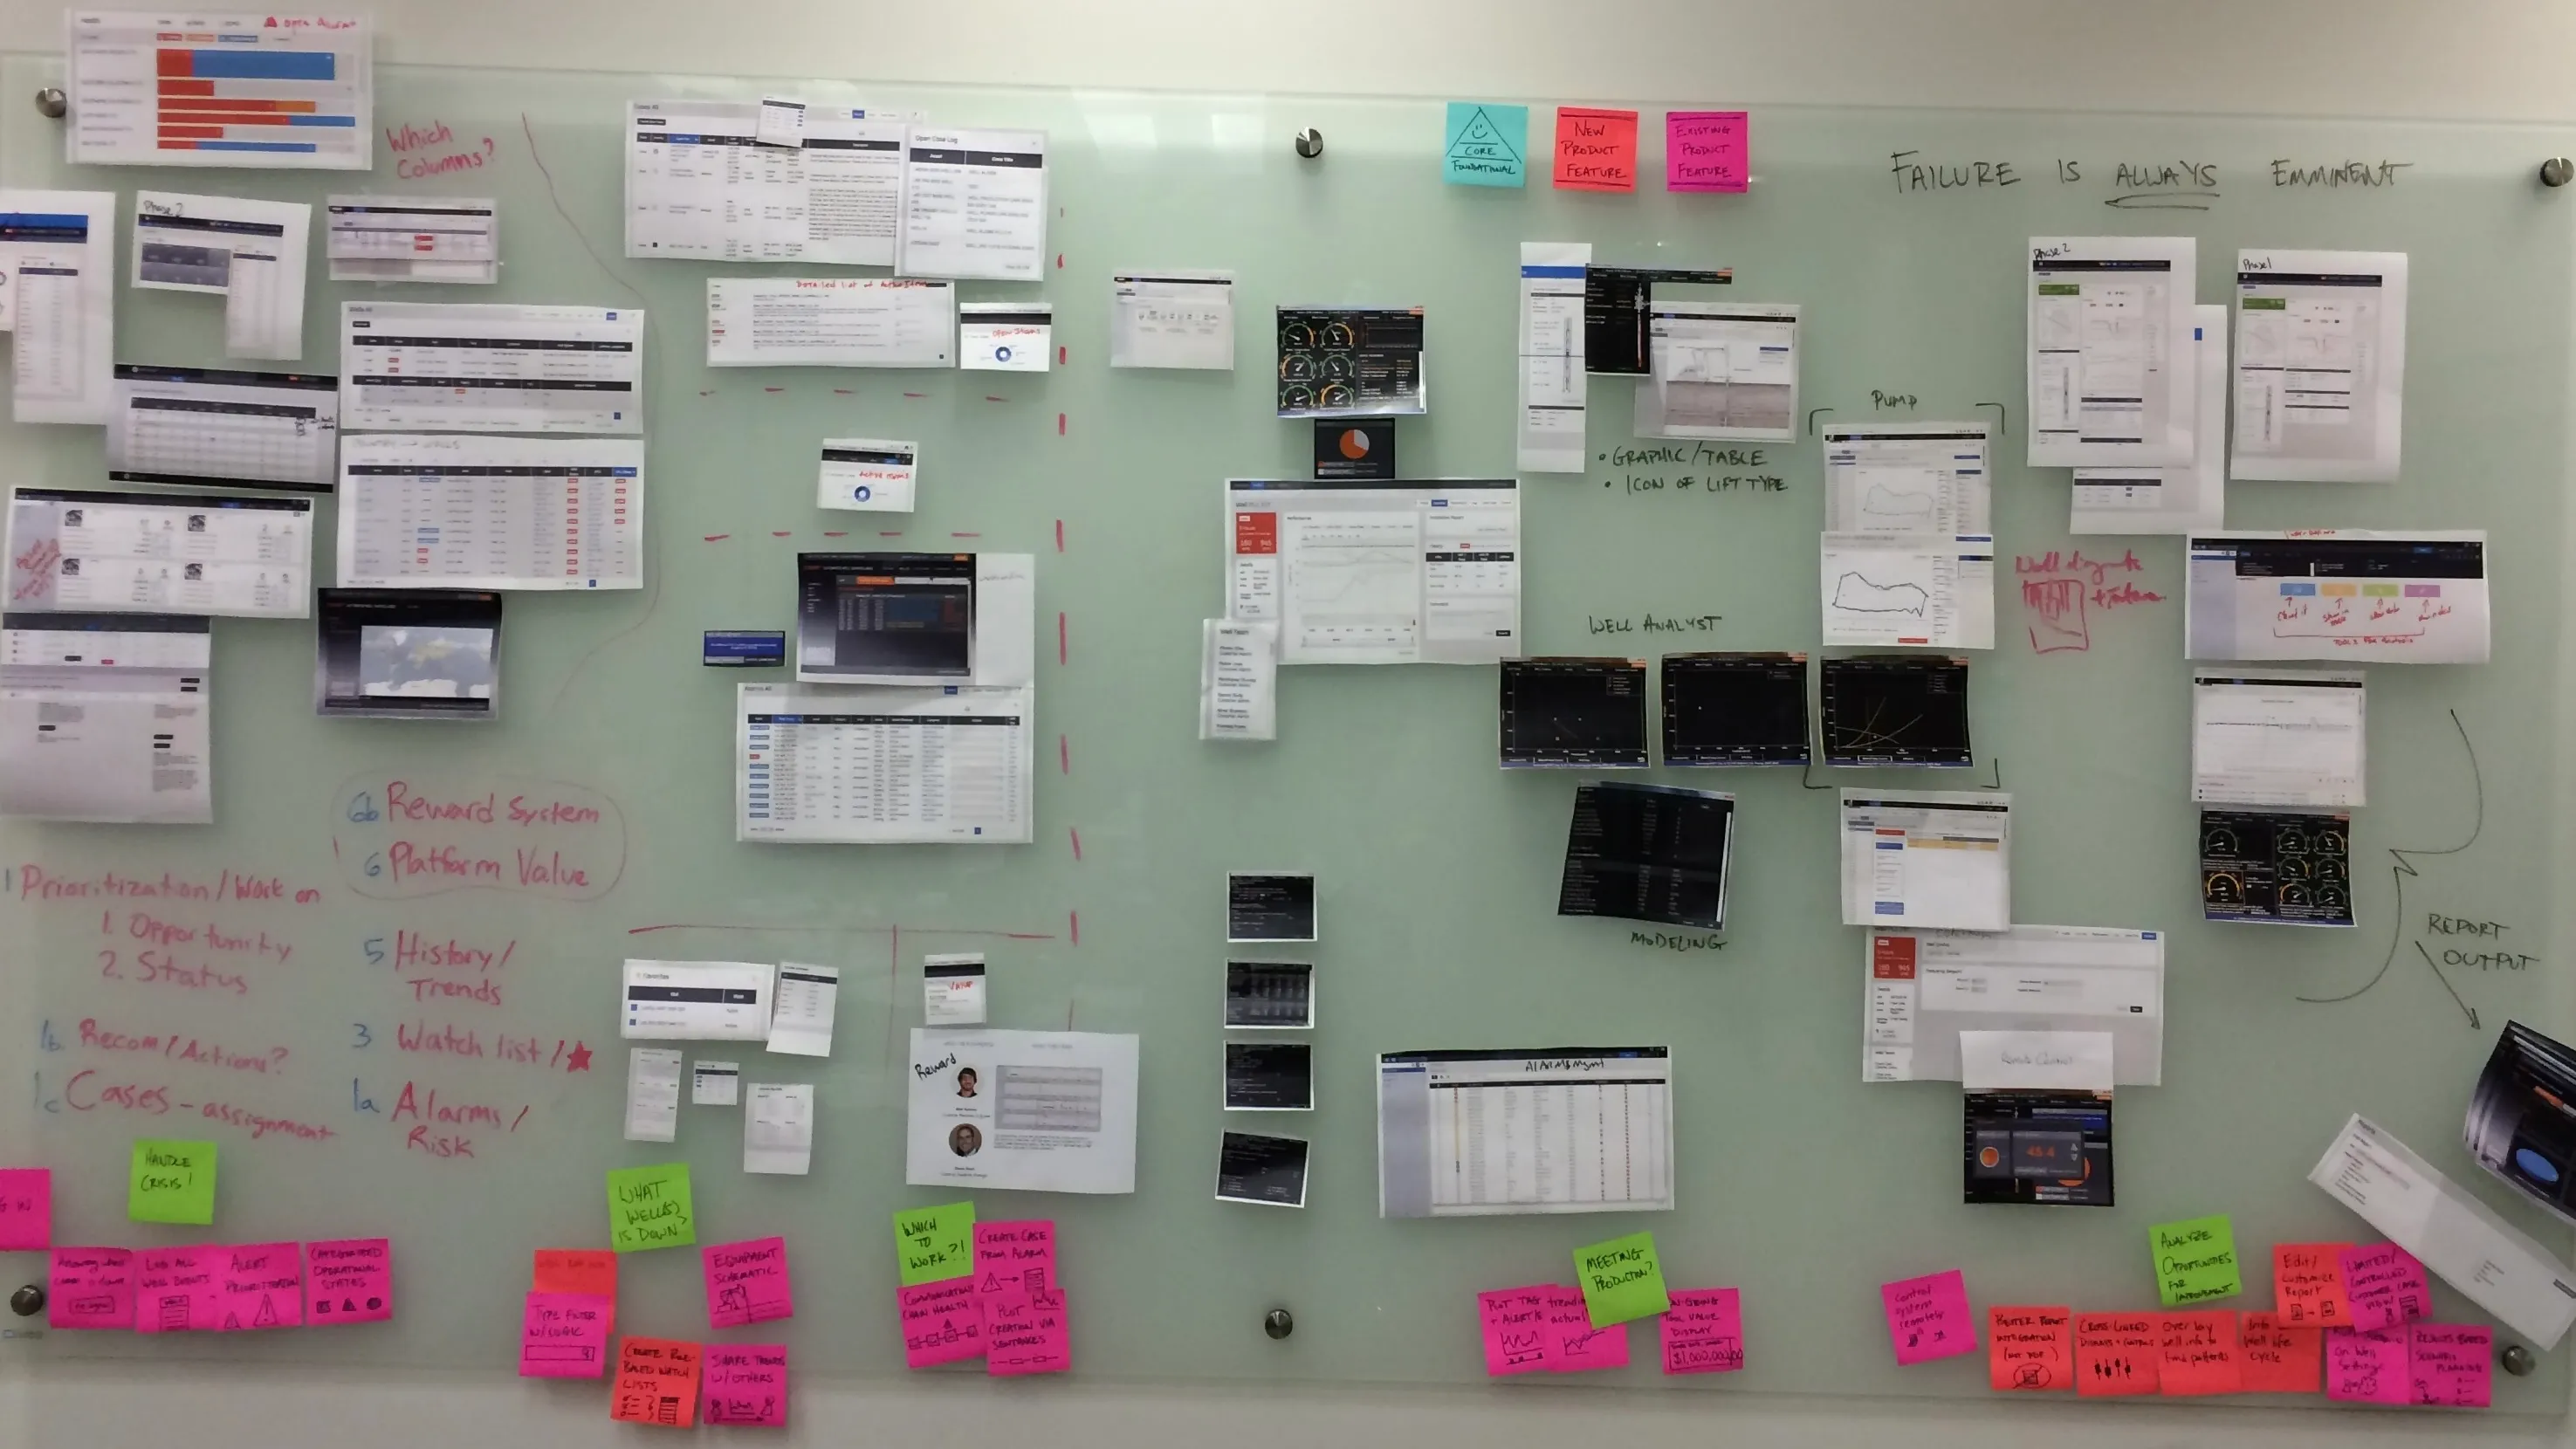
Printed screen shots of each application, mapped to the user journey.
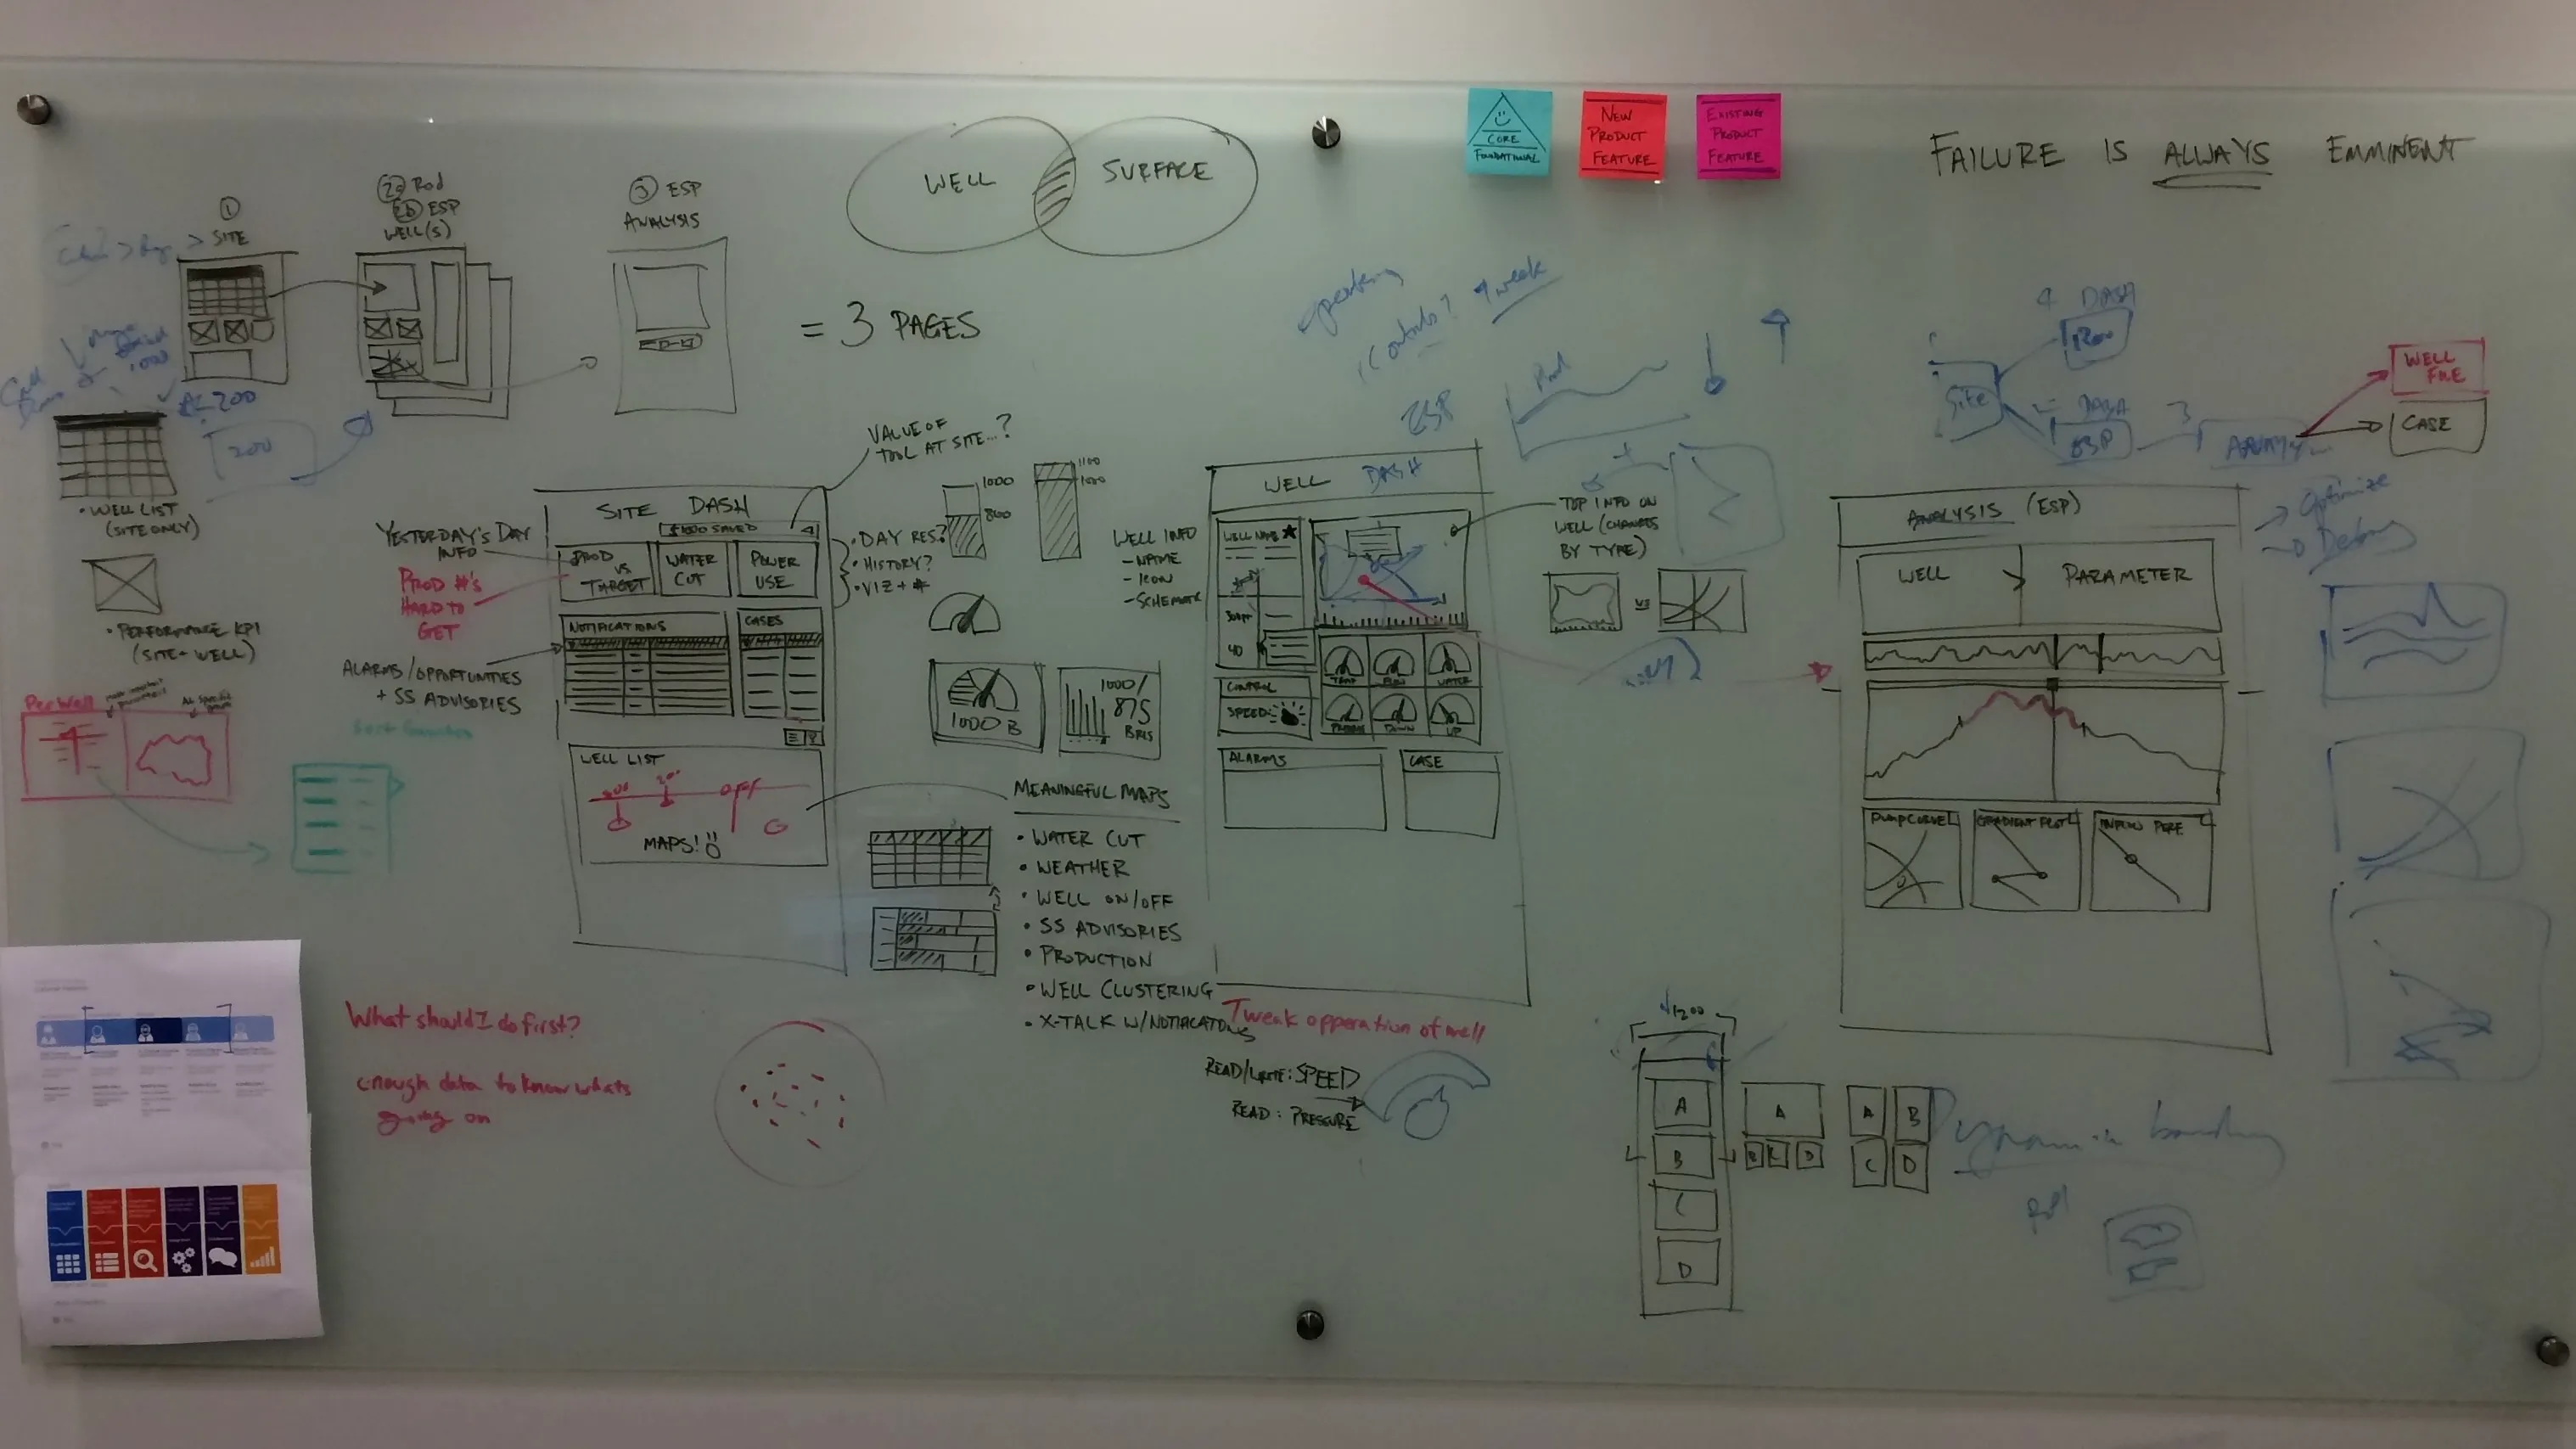
Aligned and combined application functionality sketches.
Design vision
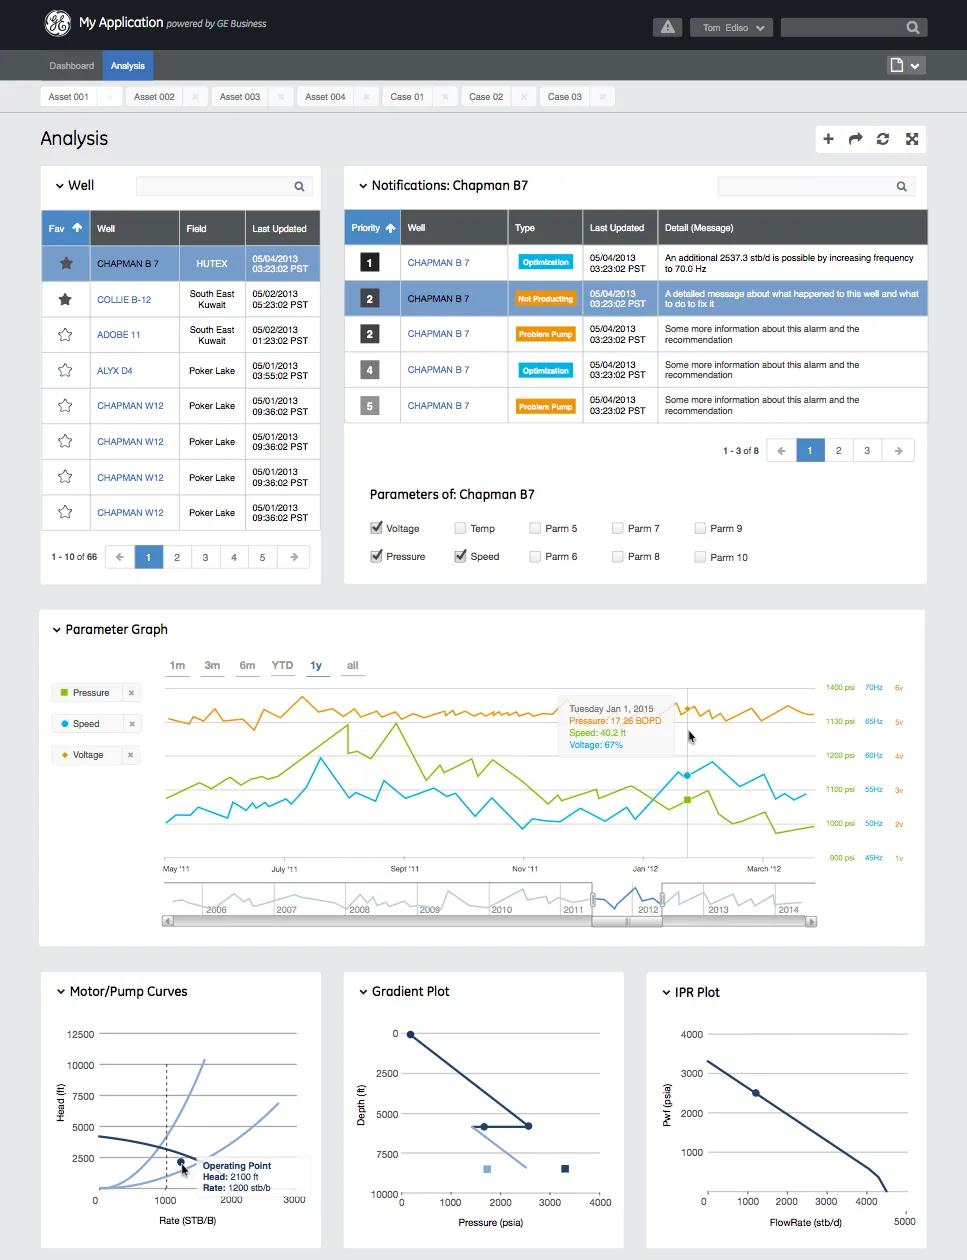
The finished design, built as wireframes in the second week and taken to high resolution: a Dashboard for a site and an Analysis view for a single well, following the pages sketched on the wall. One header, one navigation and one set of components in place of four applications.
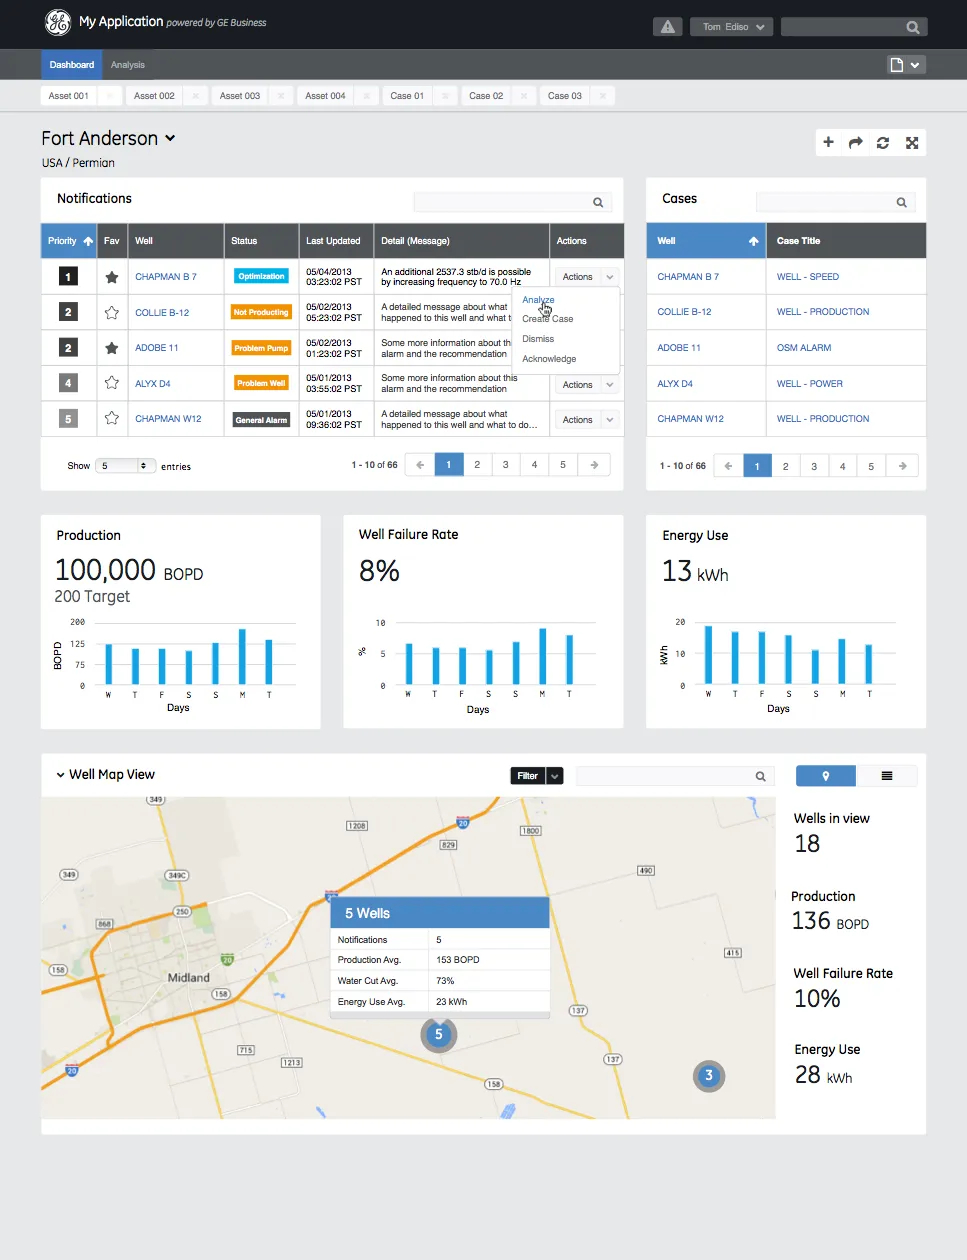
AI usage
2, Ideas. AI helped with research, sources, brainstorming or structure. I wrote every word.The tiers