Empowering people to understand and control their energy resources.
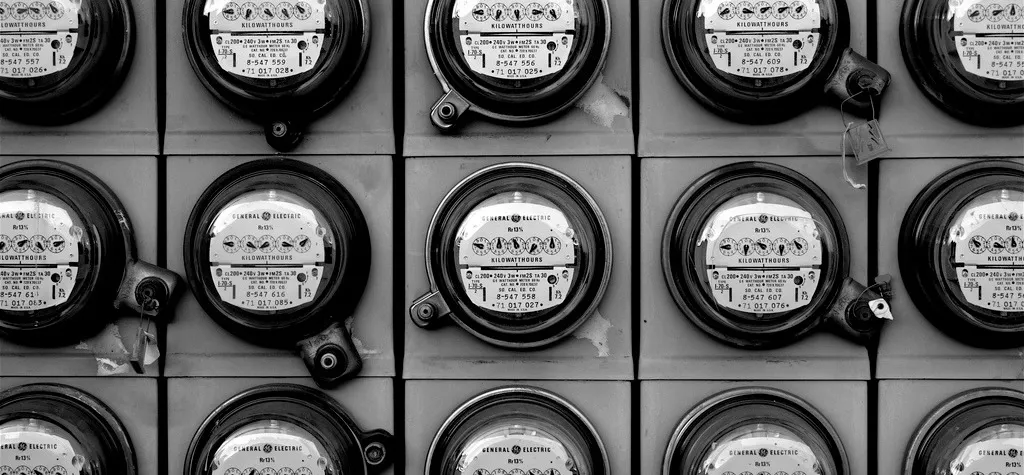
This is the opening image for Home Energy, my work at GE Appliances from 2007 to 2011 on demand-side management for the home. I chose a wall of GE meters because the project began where the utility meets the house.
Home Energy
Problem space
The problem in one line, as I put it in my 2022 deck. Utilities had no way to manage demand once electricity passed the meter, and that gap is what the whole program set out to close.
Utility companies lack tools to manage rising residential energy demand.
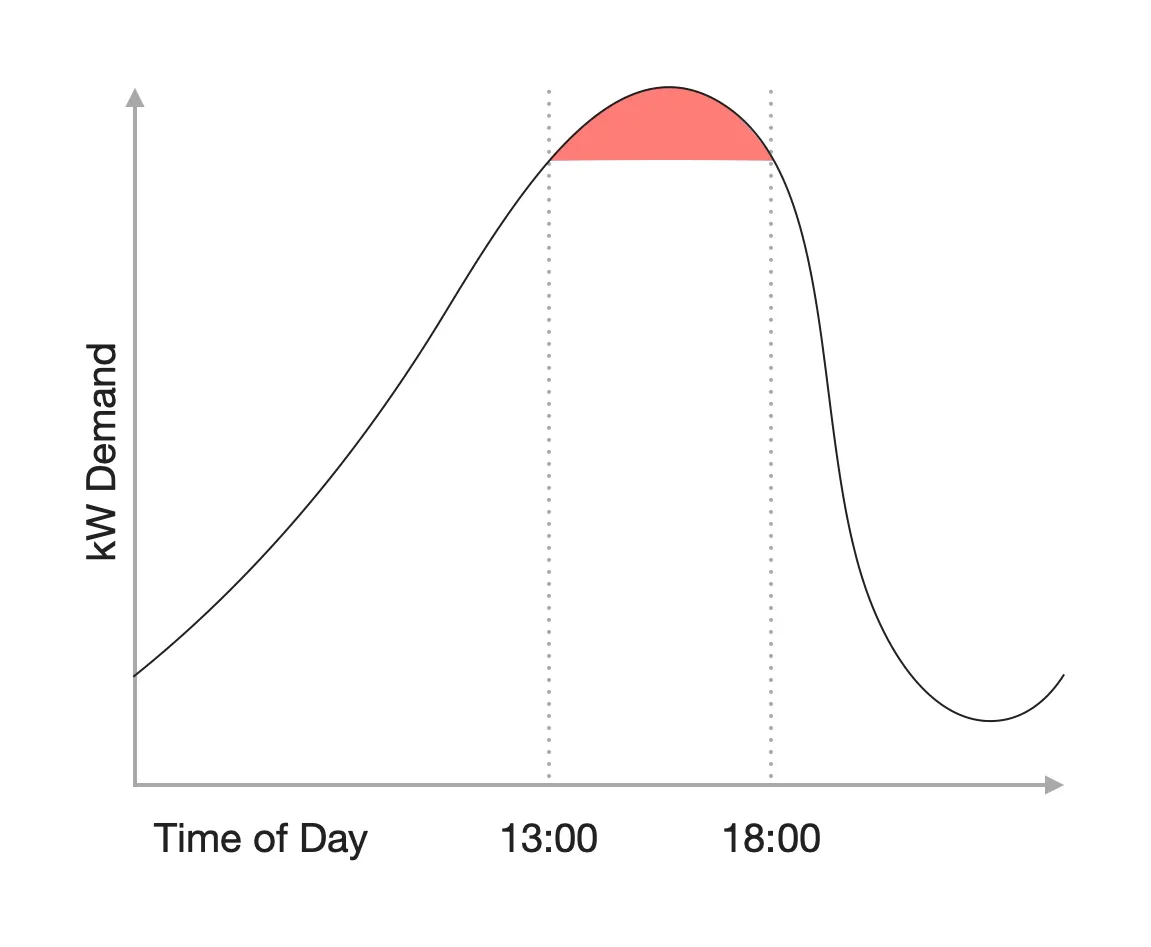
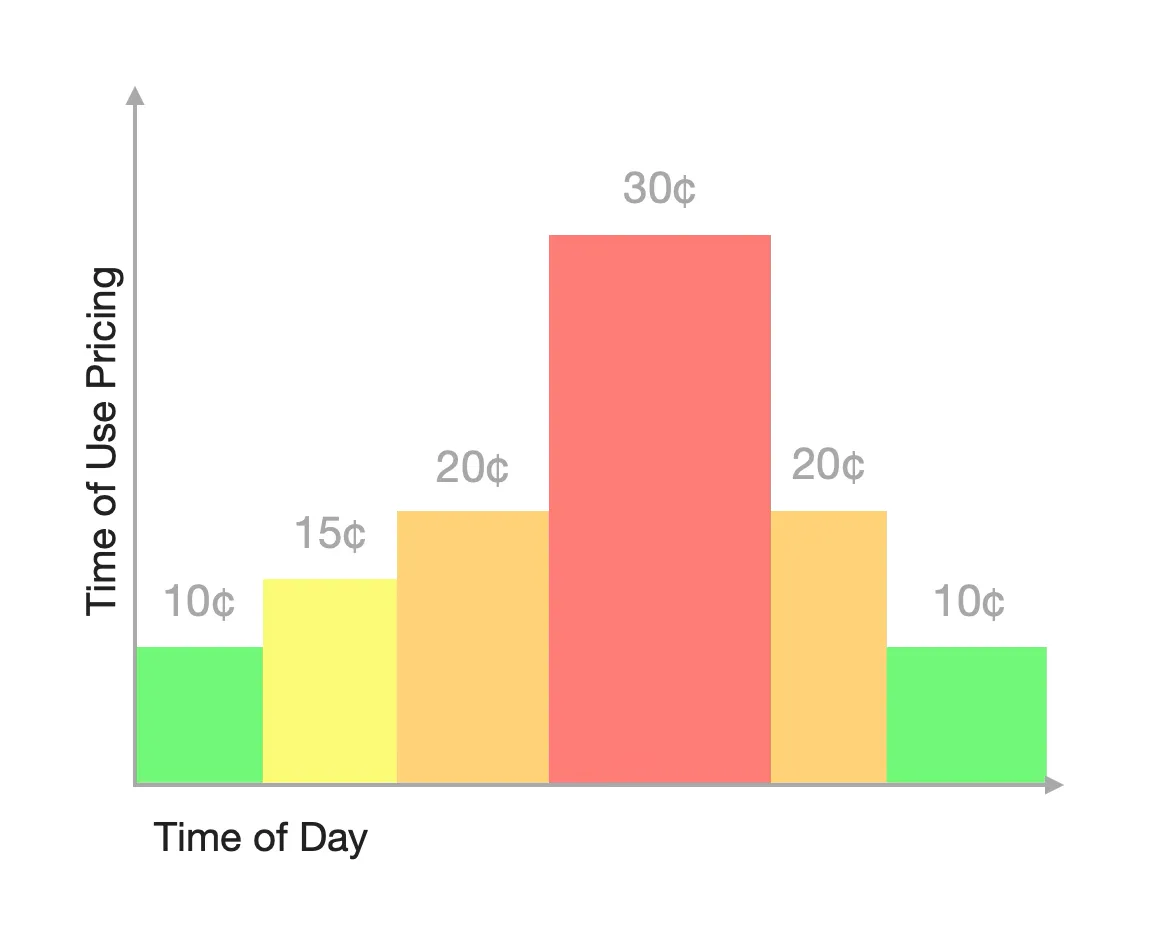
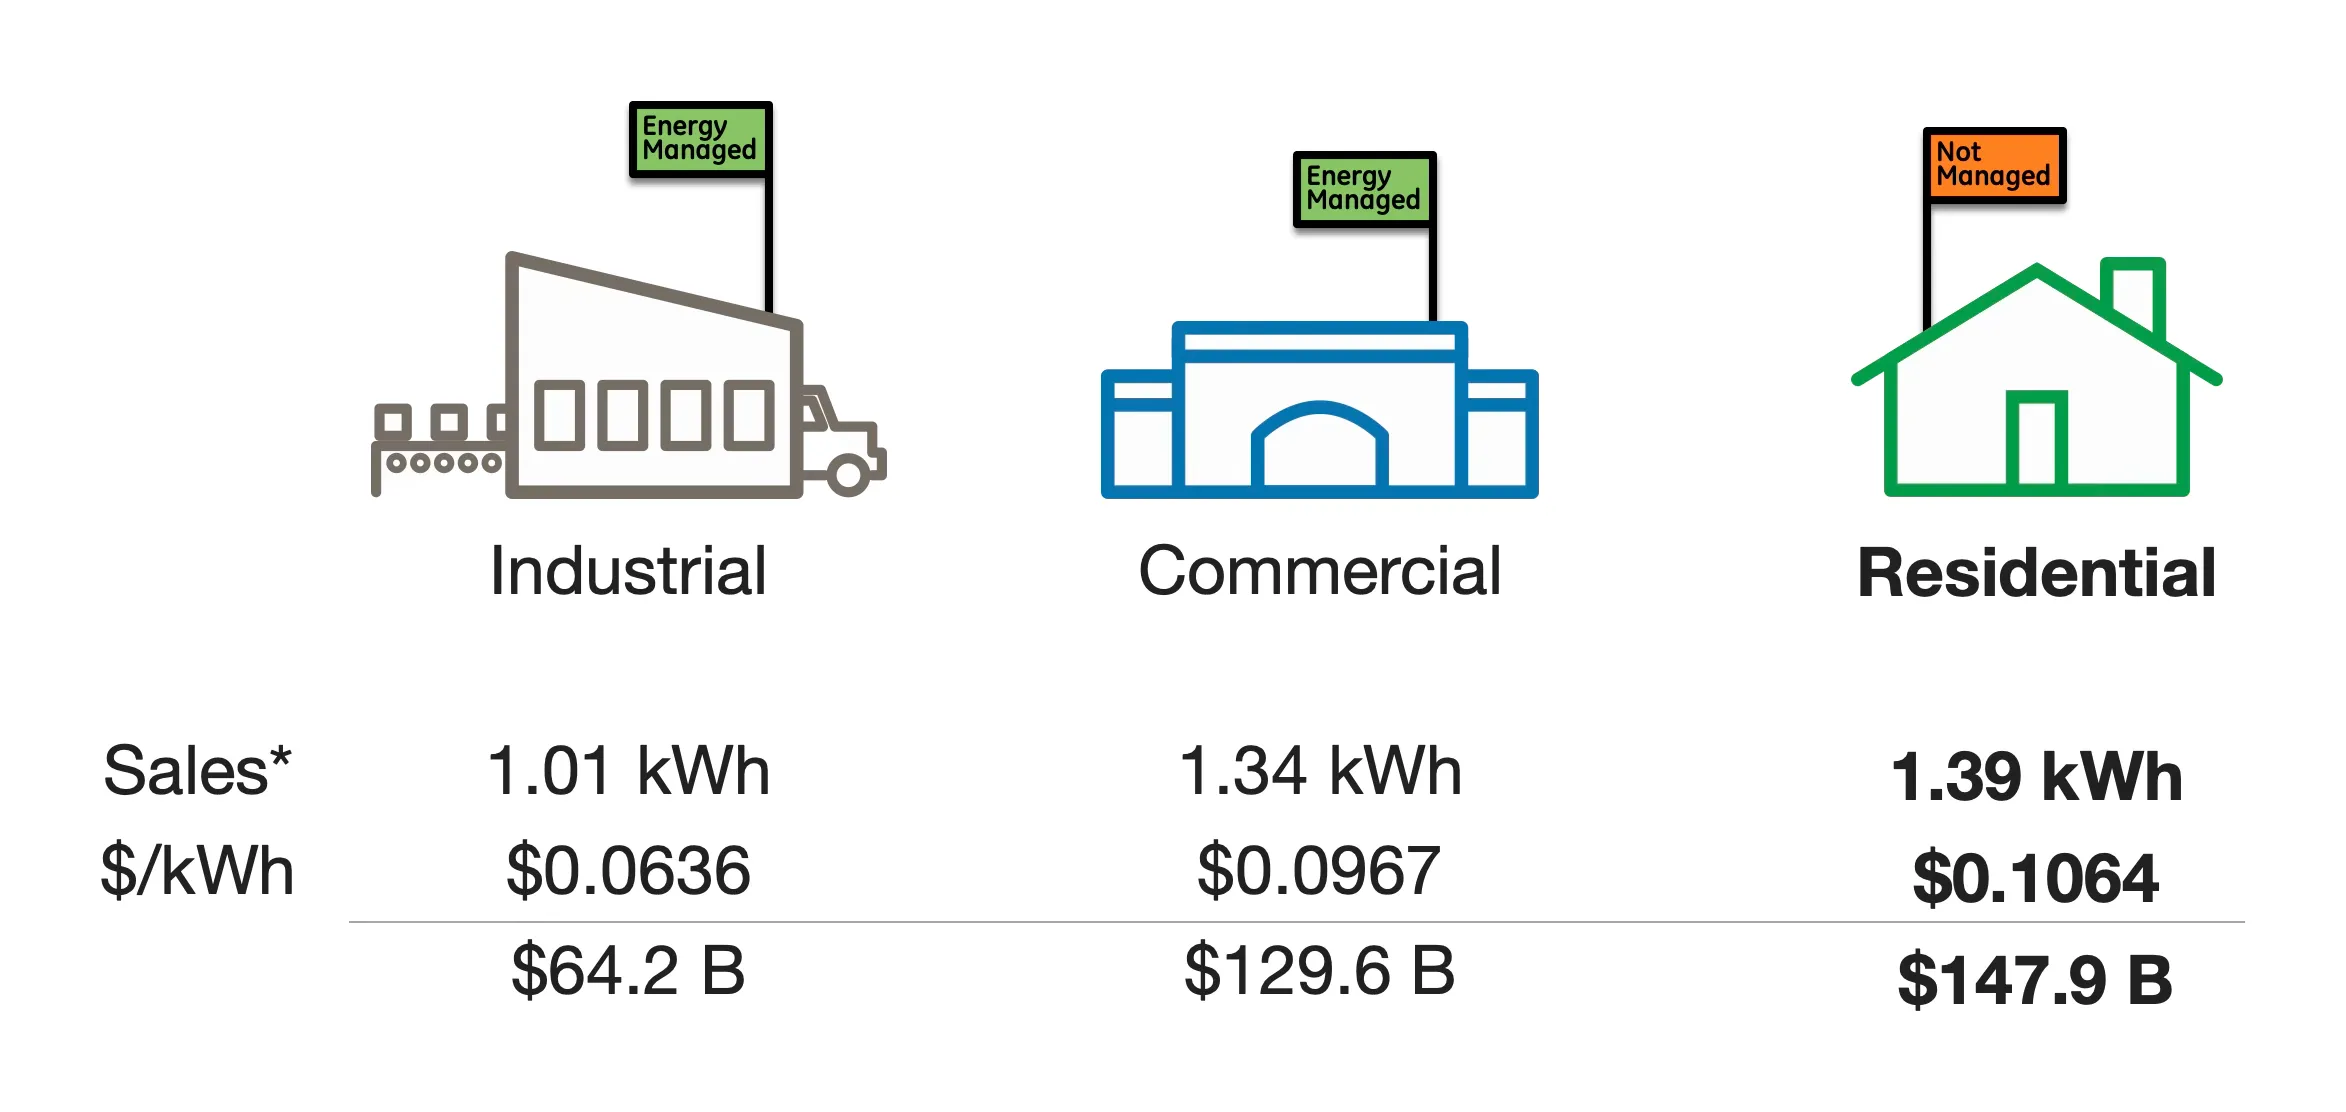
Three charts that set out the problem. Demand peaks in the afternoon and time-of-use pricing follows it, yet industry and commerce manage their energy while homes, the largest buyer, do not.
Two charts that put a number on shedding. Nine home appliances by ownership and peak power, and US generating capacity by source: if a fifth of US homes each shed two kilowatts, that is 49 million kilowatts, about half of US hydroelectric capacity.
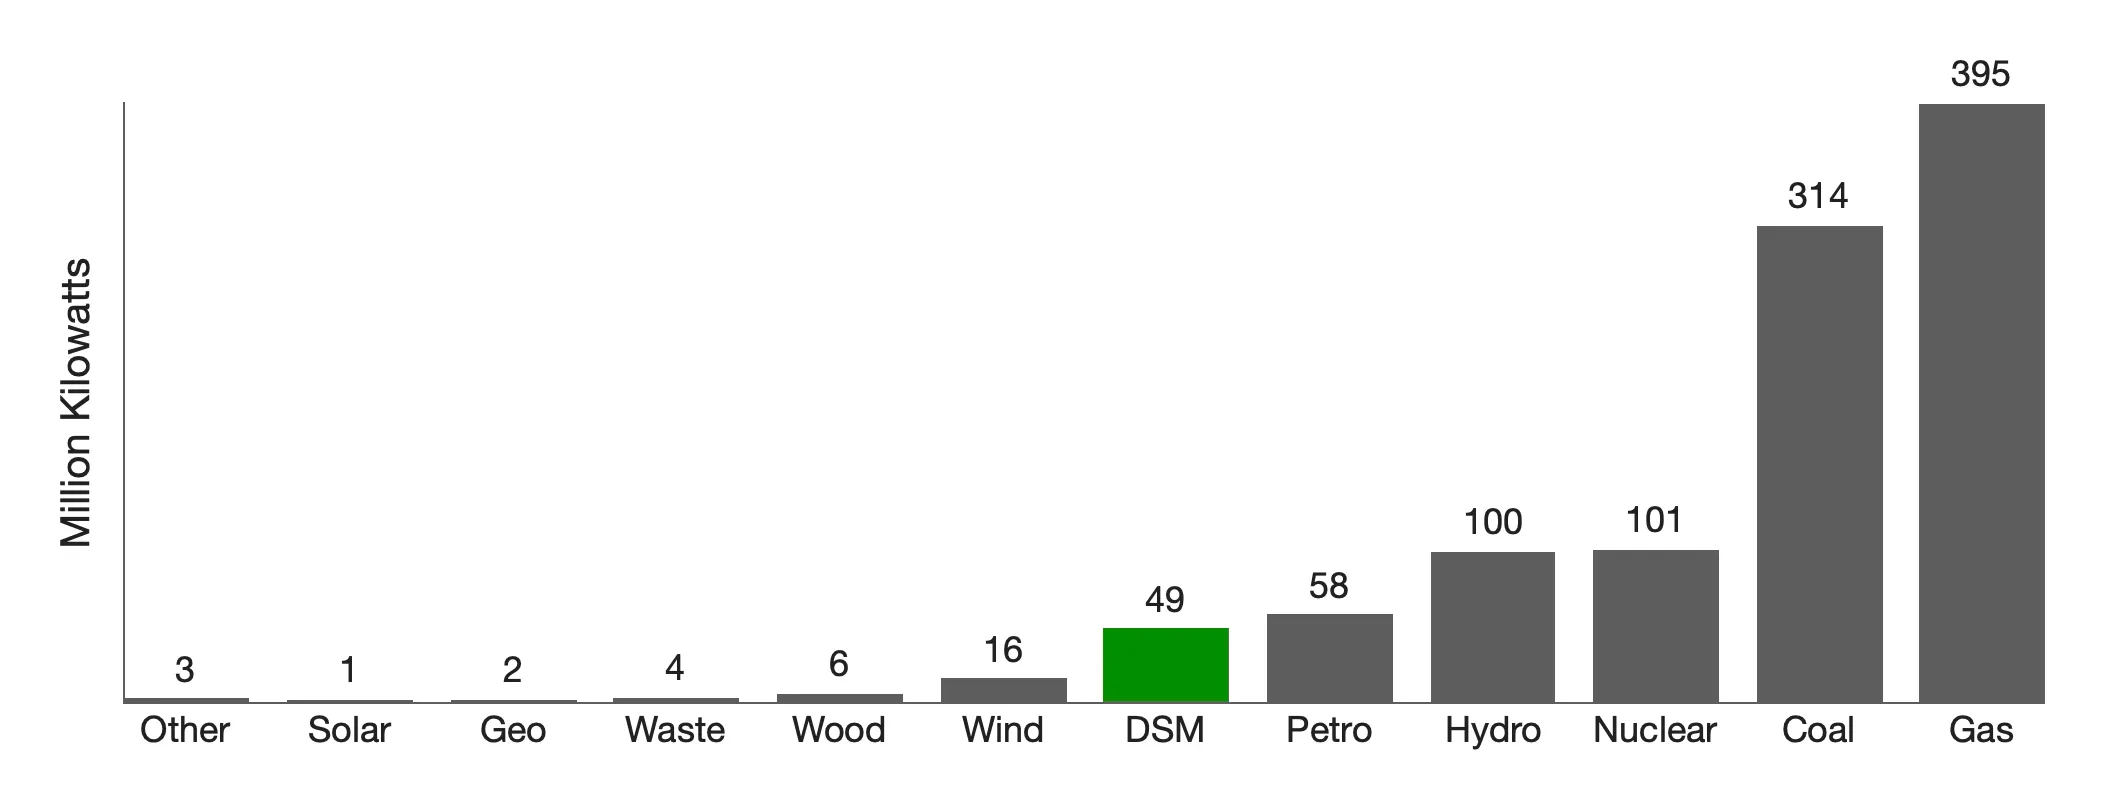
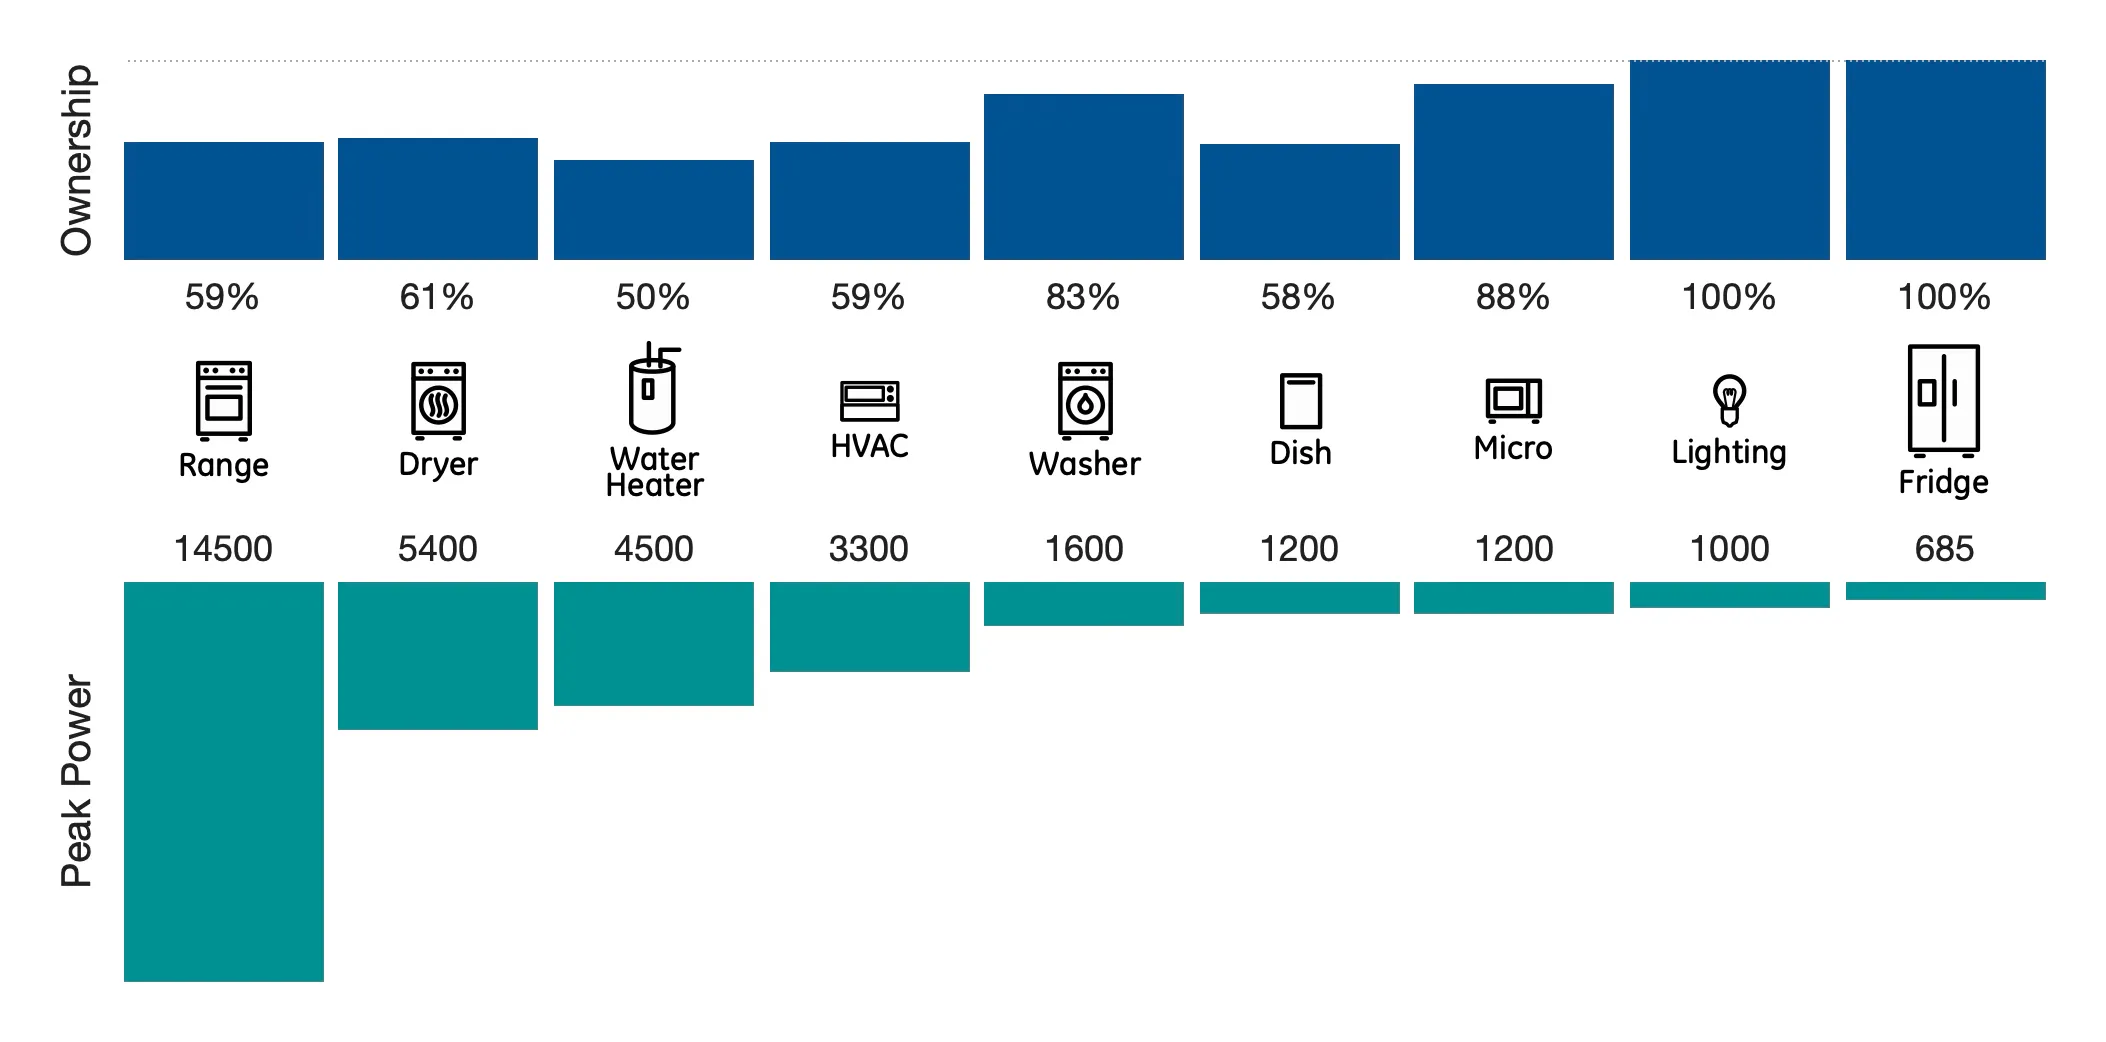
20% of US homes, each shedding 2kW = 1/2 US hydro-electric production
GE's net zero home diagram places the Home Energy Manager at the center of the house. I used it to frame the design question I was actually asking: how to get the most benefit for the person living there, not just for the utility.
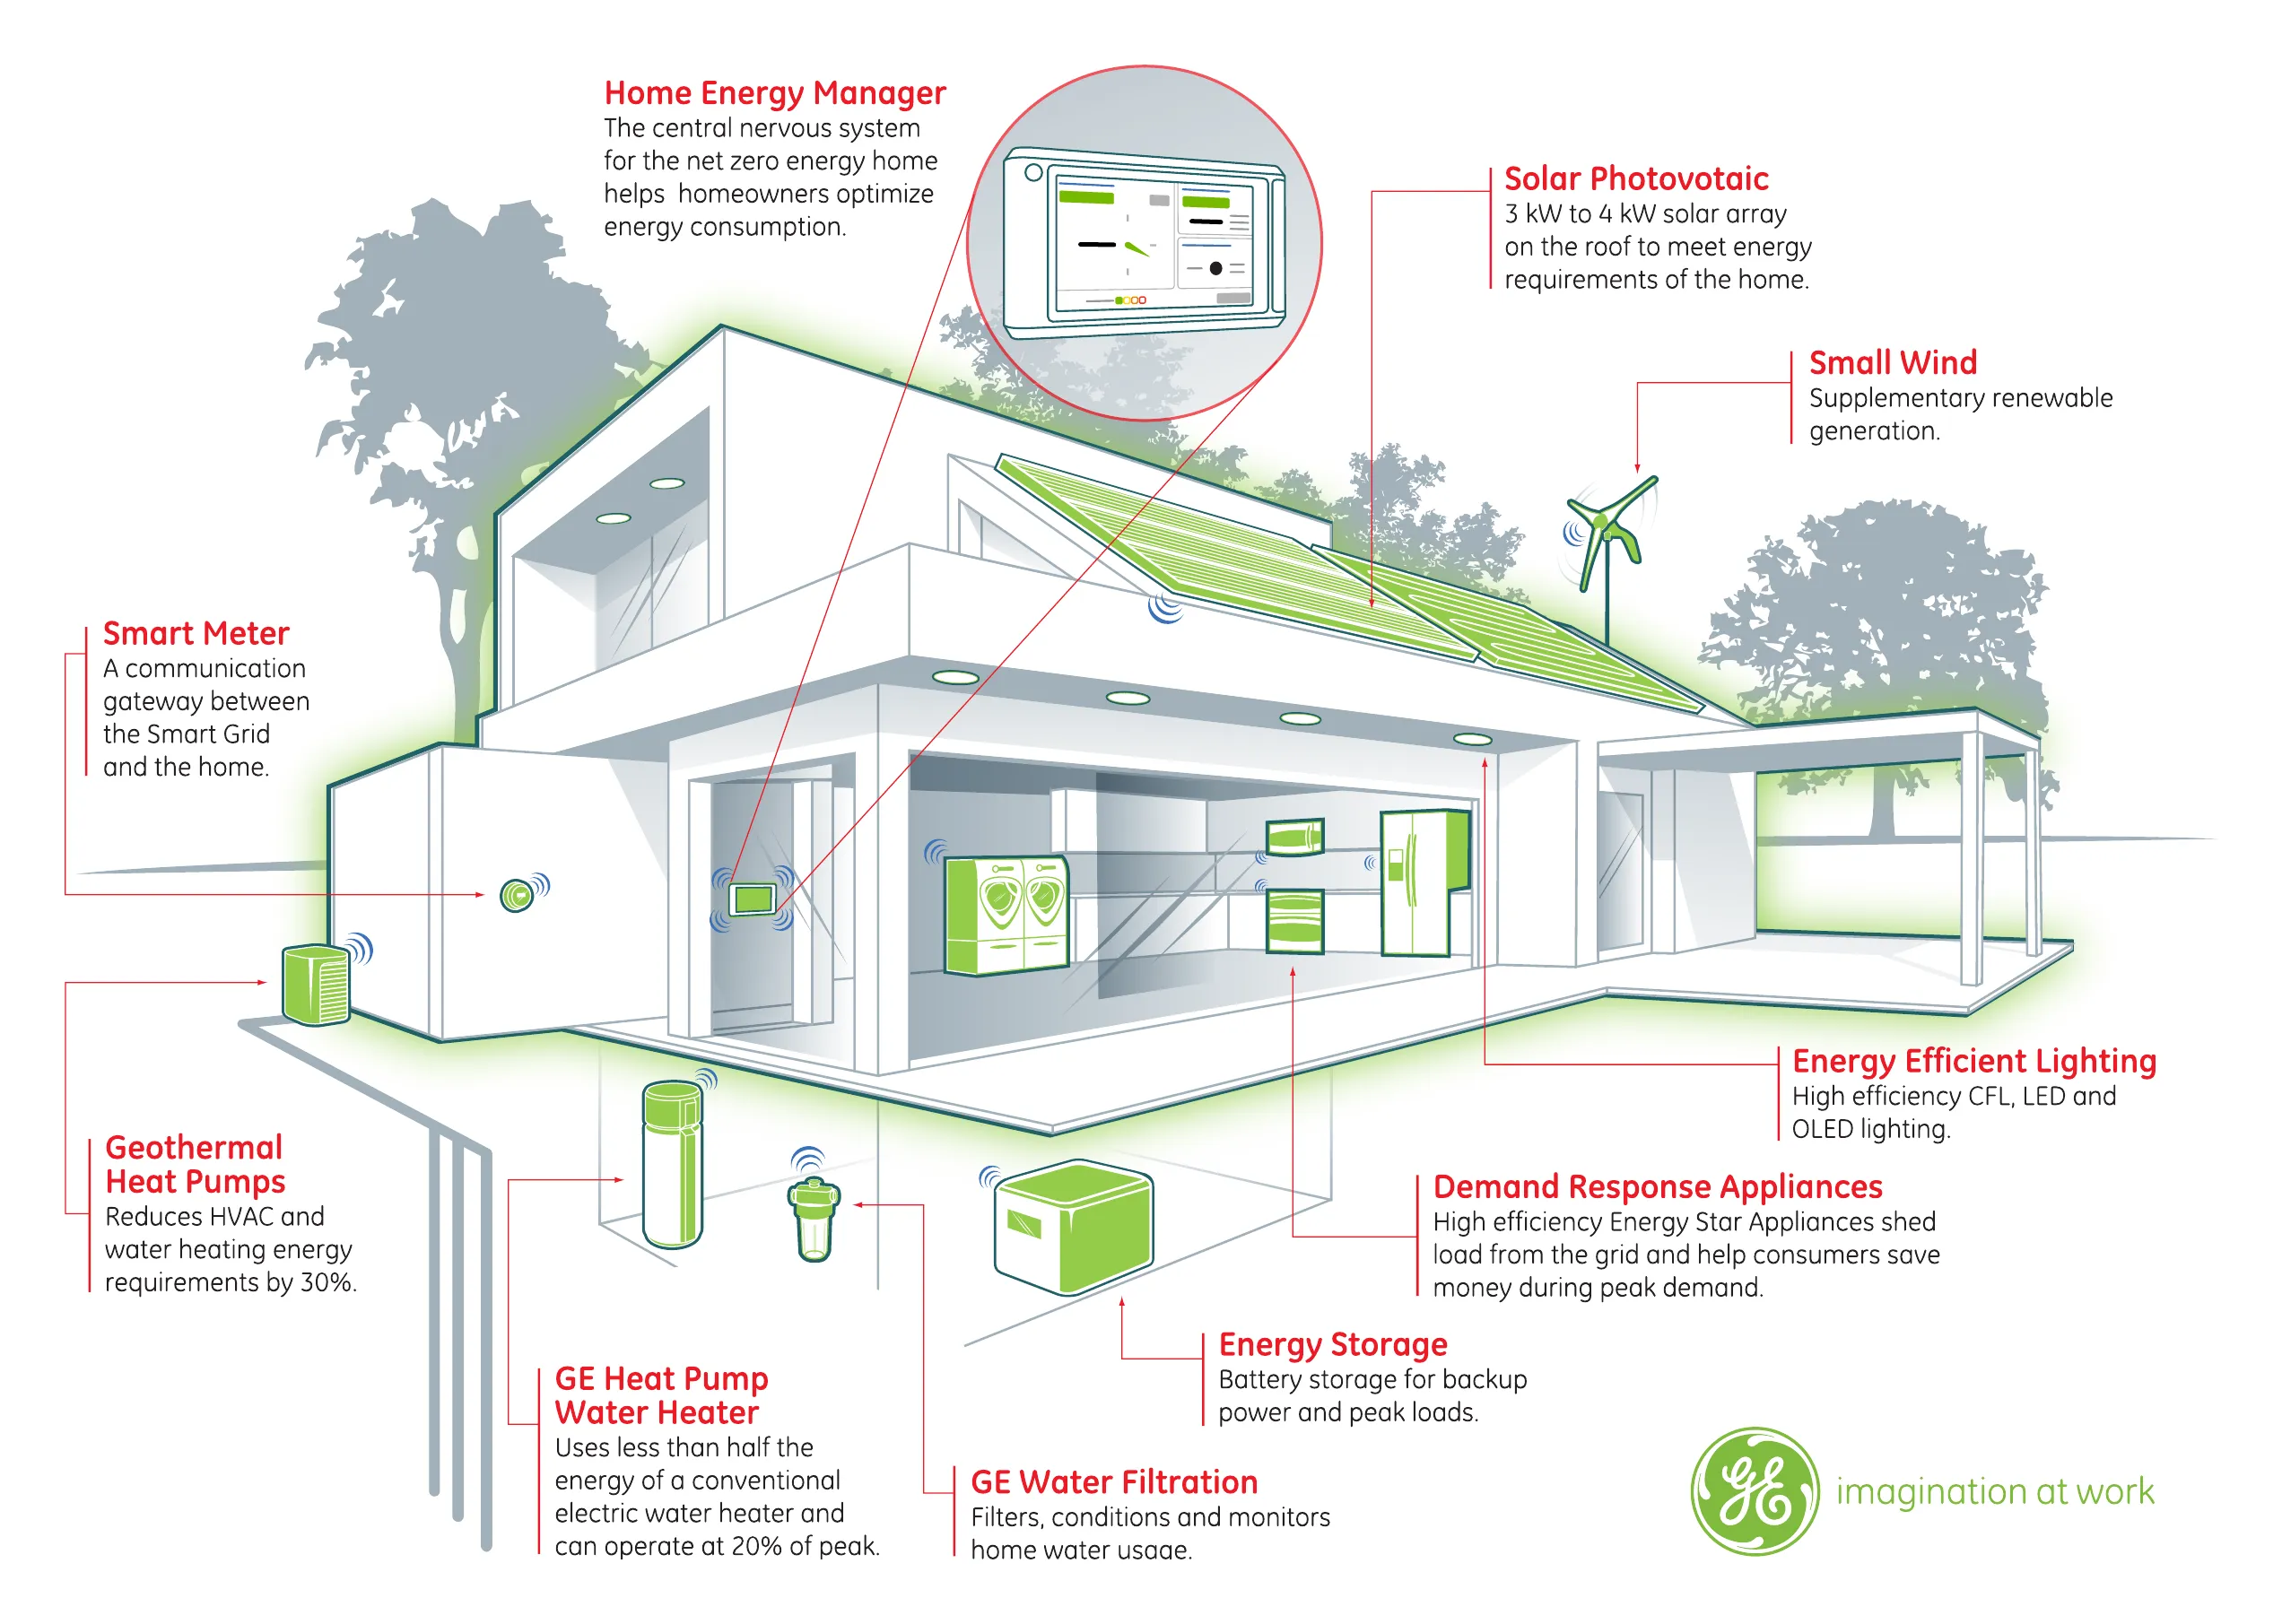
How to maximize the user benefit of an energy management system?
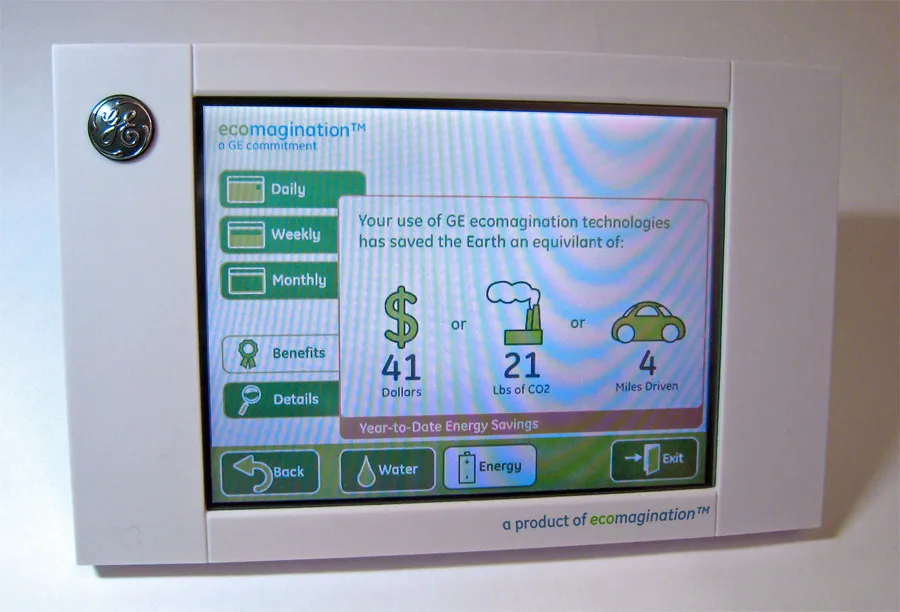
v1 Eco Dashboard
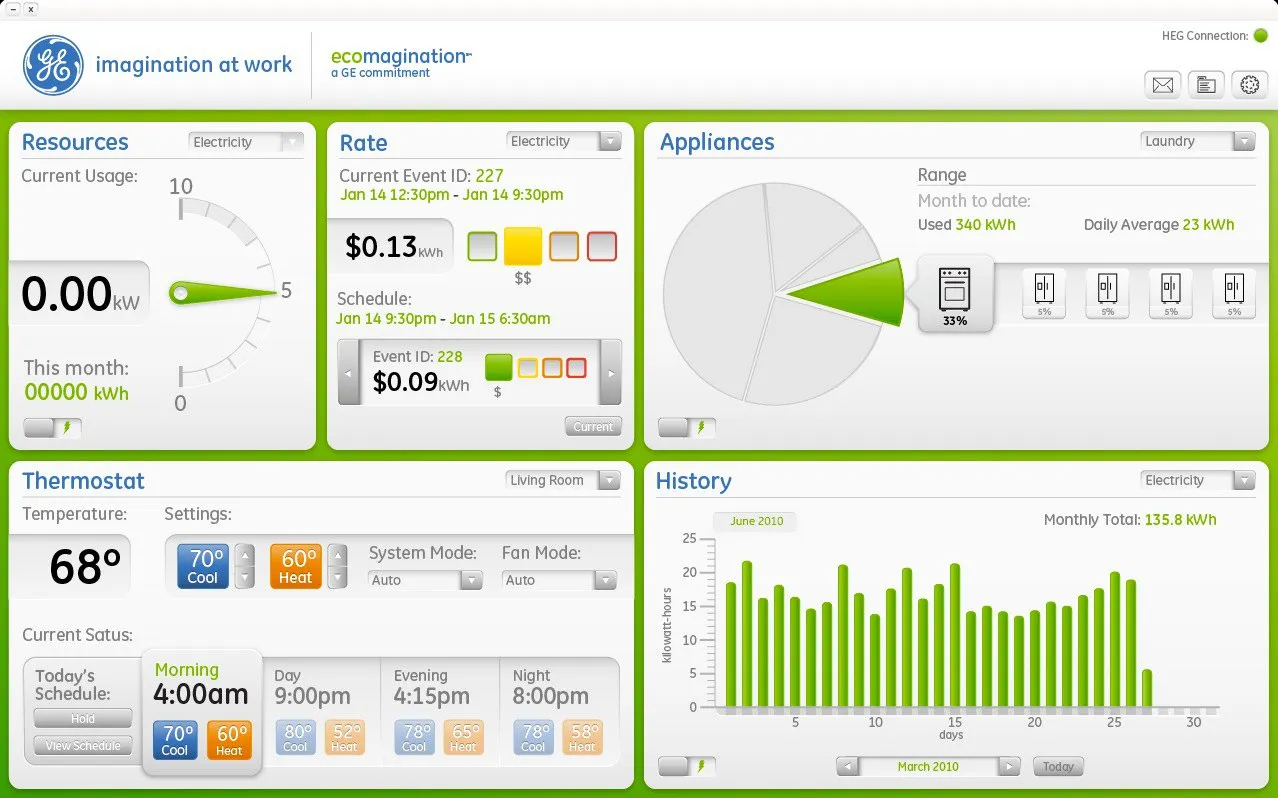
The Eco Dashboard, the first generation, on the wall, beside four of its redesigned screens: home, HVAC control, and energy and water by week.
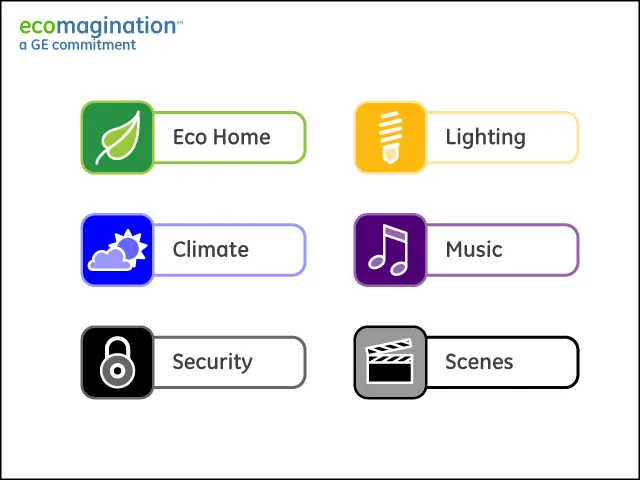
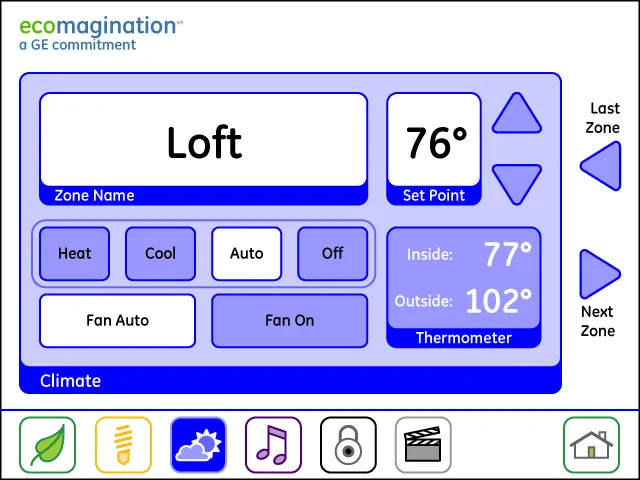
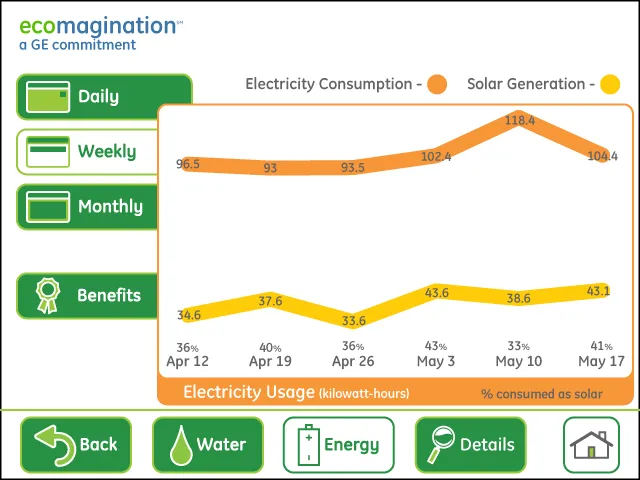
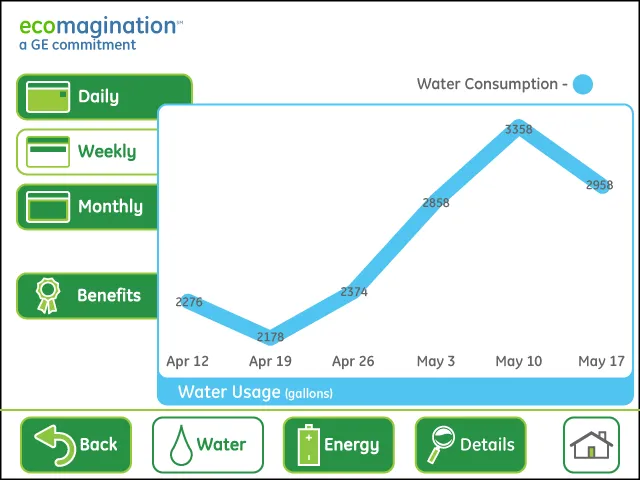
Home screen, HVAC control, Energy & Water usage.
iPhone Prototype
Two screens of the phone interface I designed for the 2008 demo, shown on an original iPhone: the refrigerator at 130 watts set to Normal, and the water heater at 4,200 watts set to High.
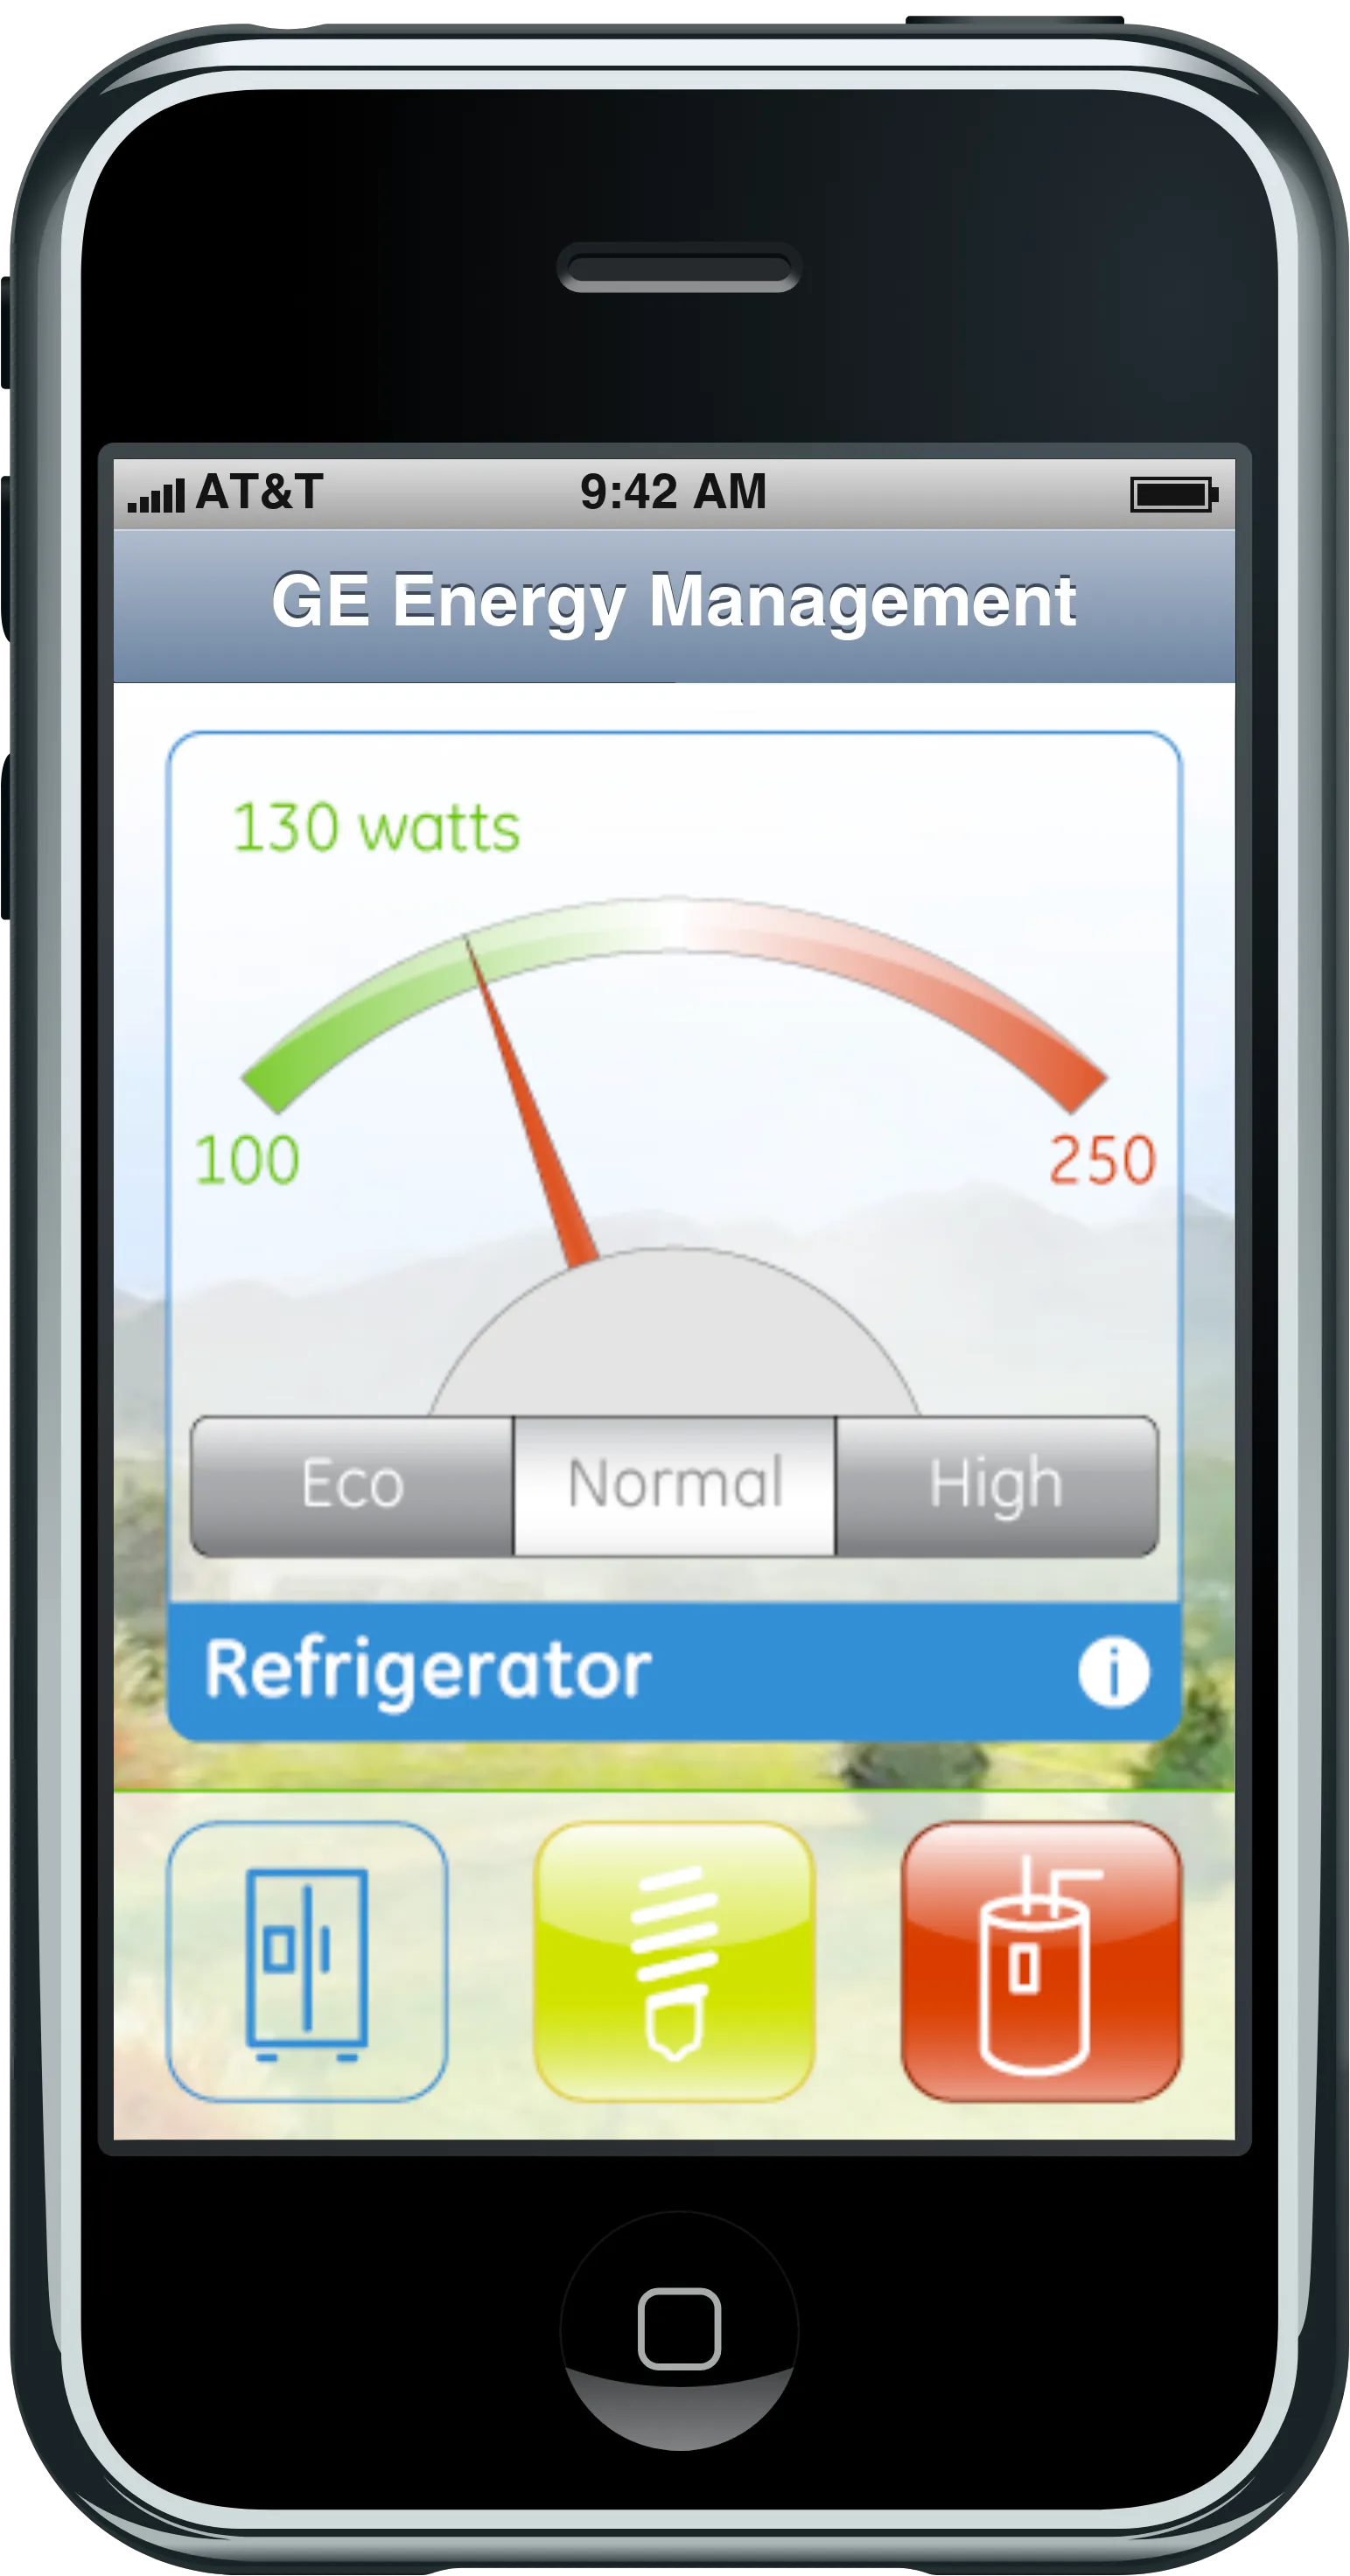
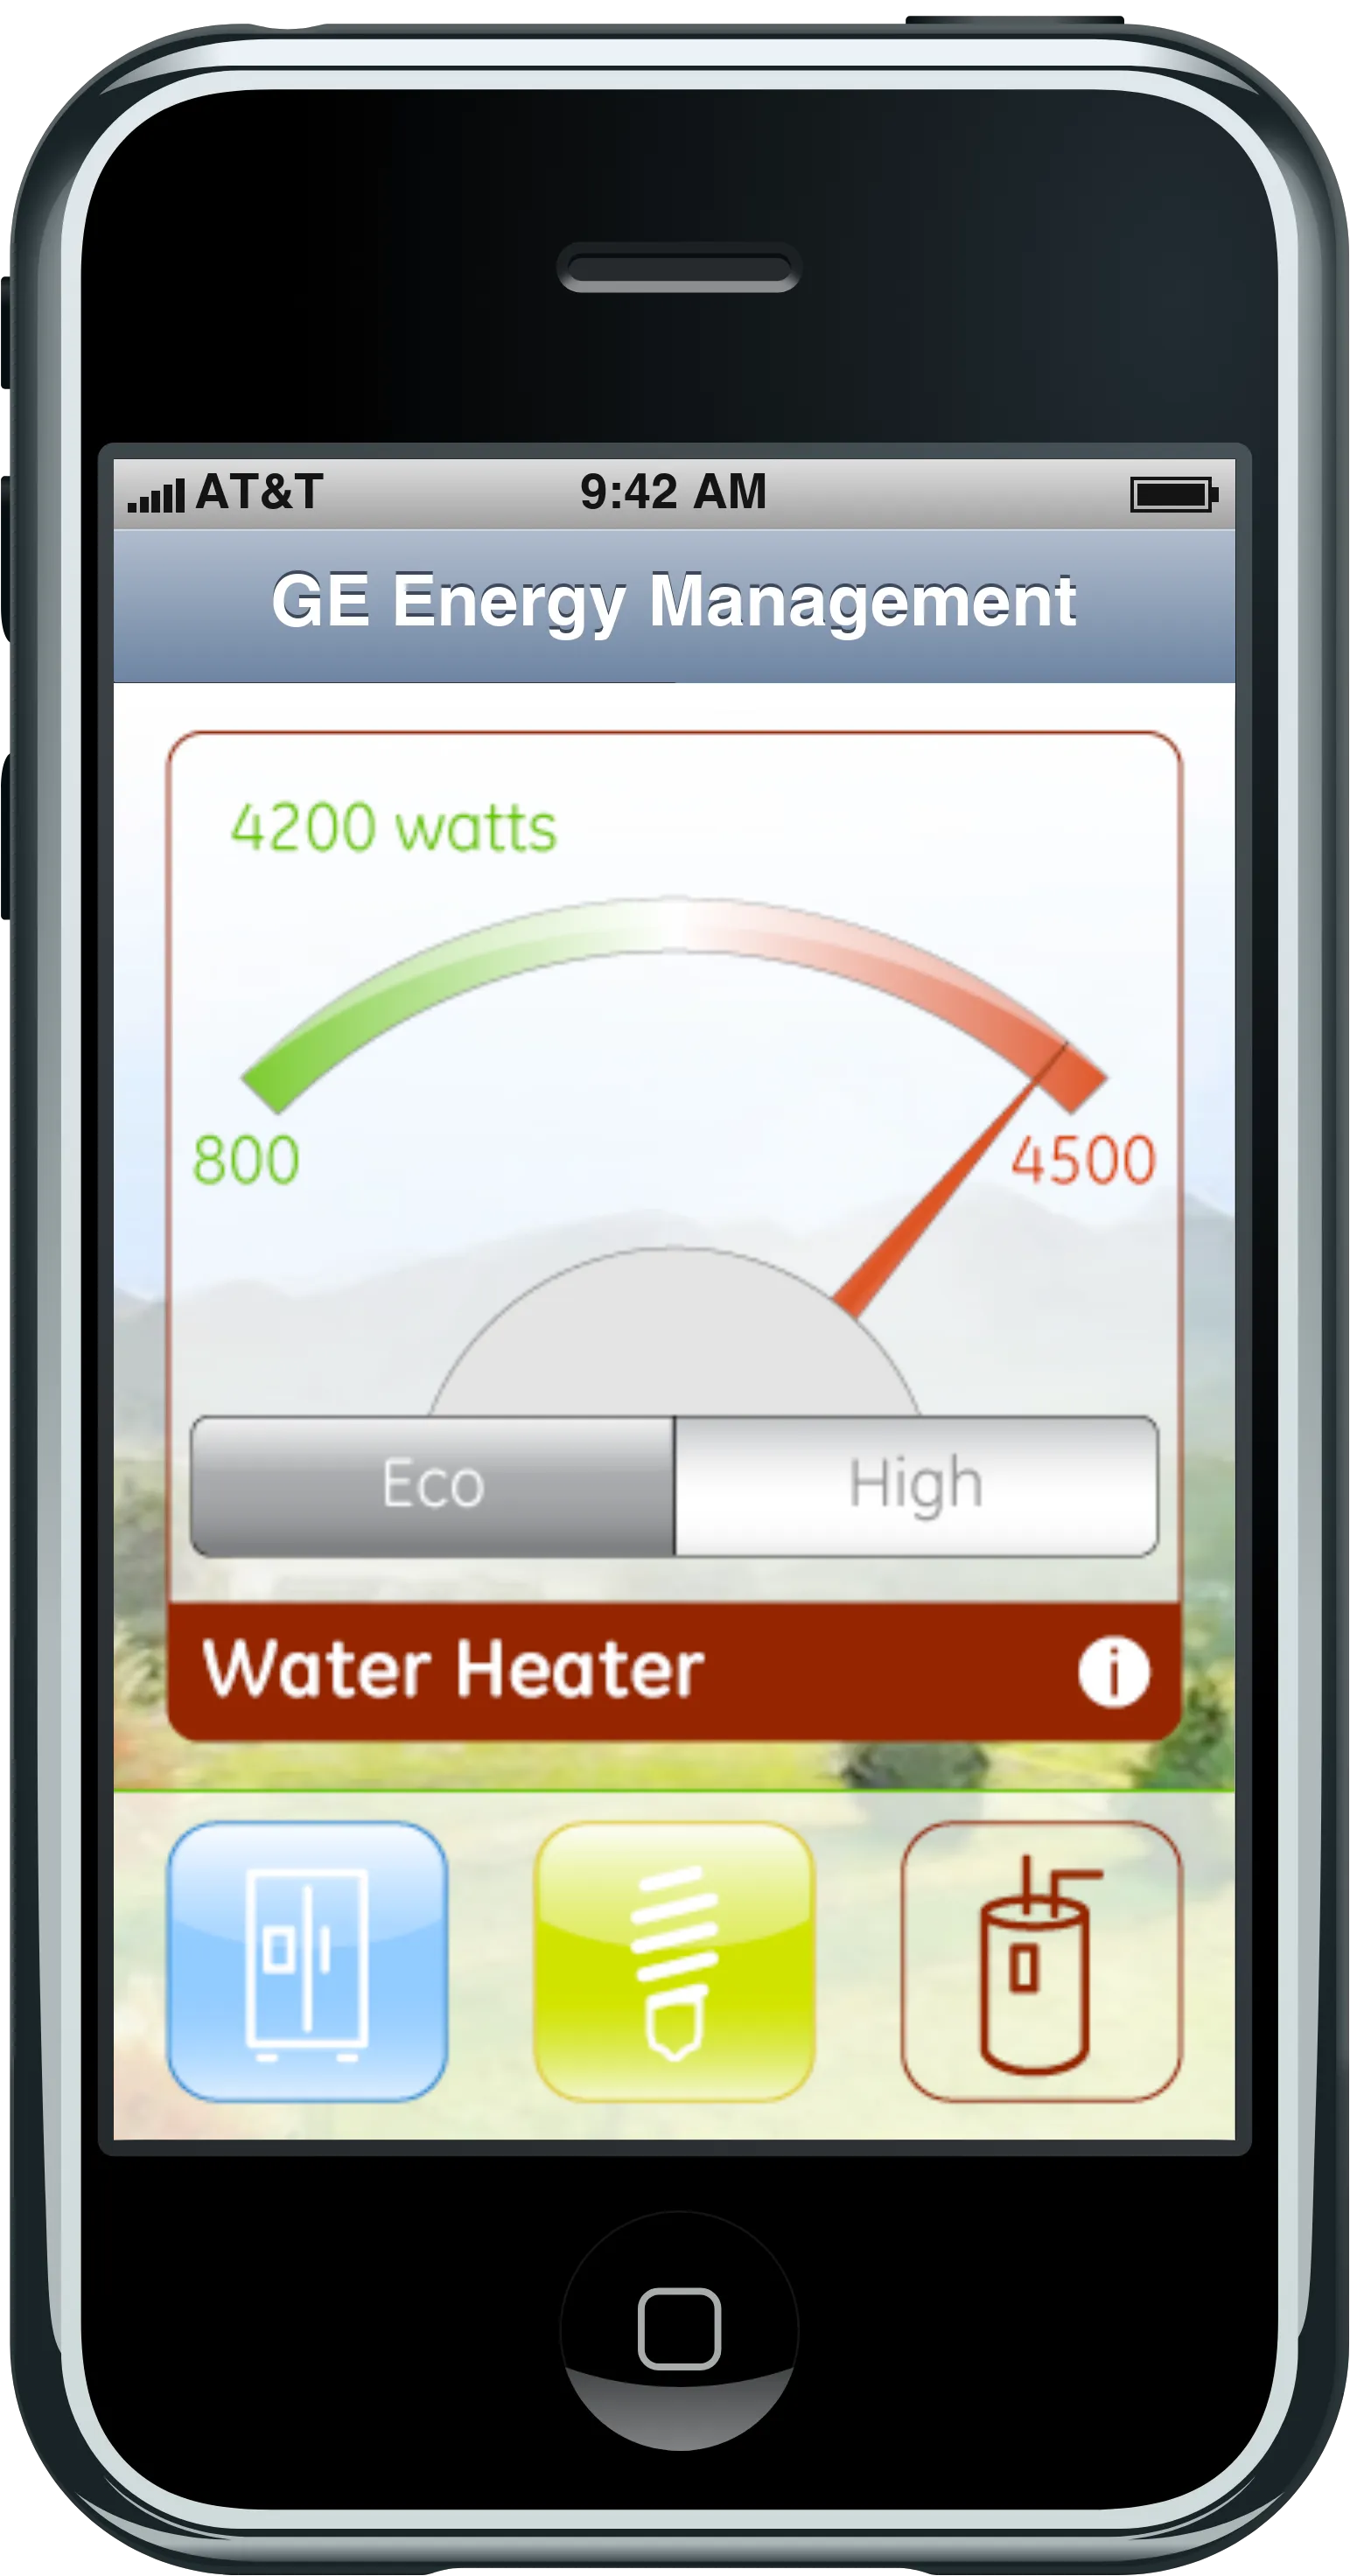
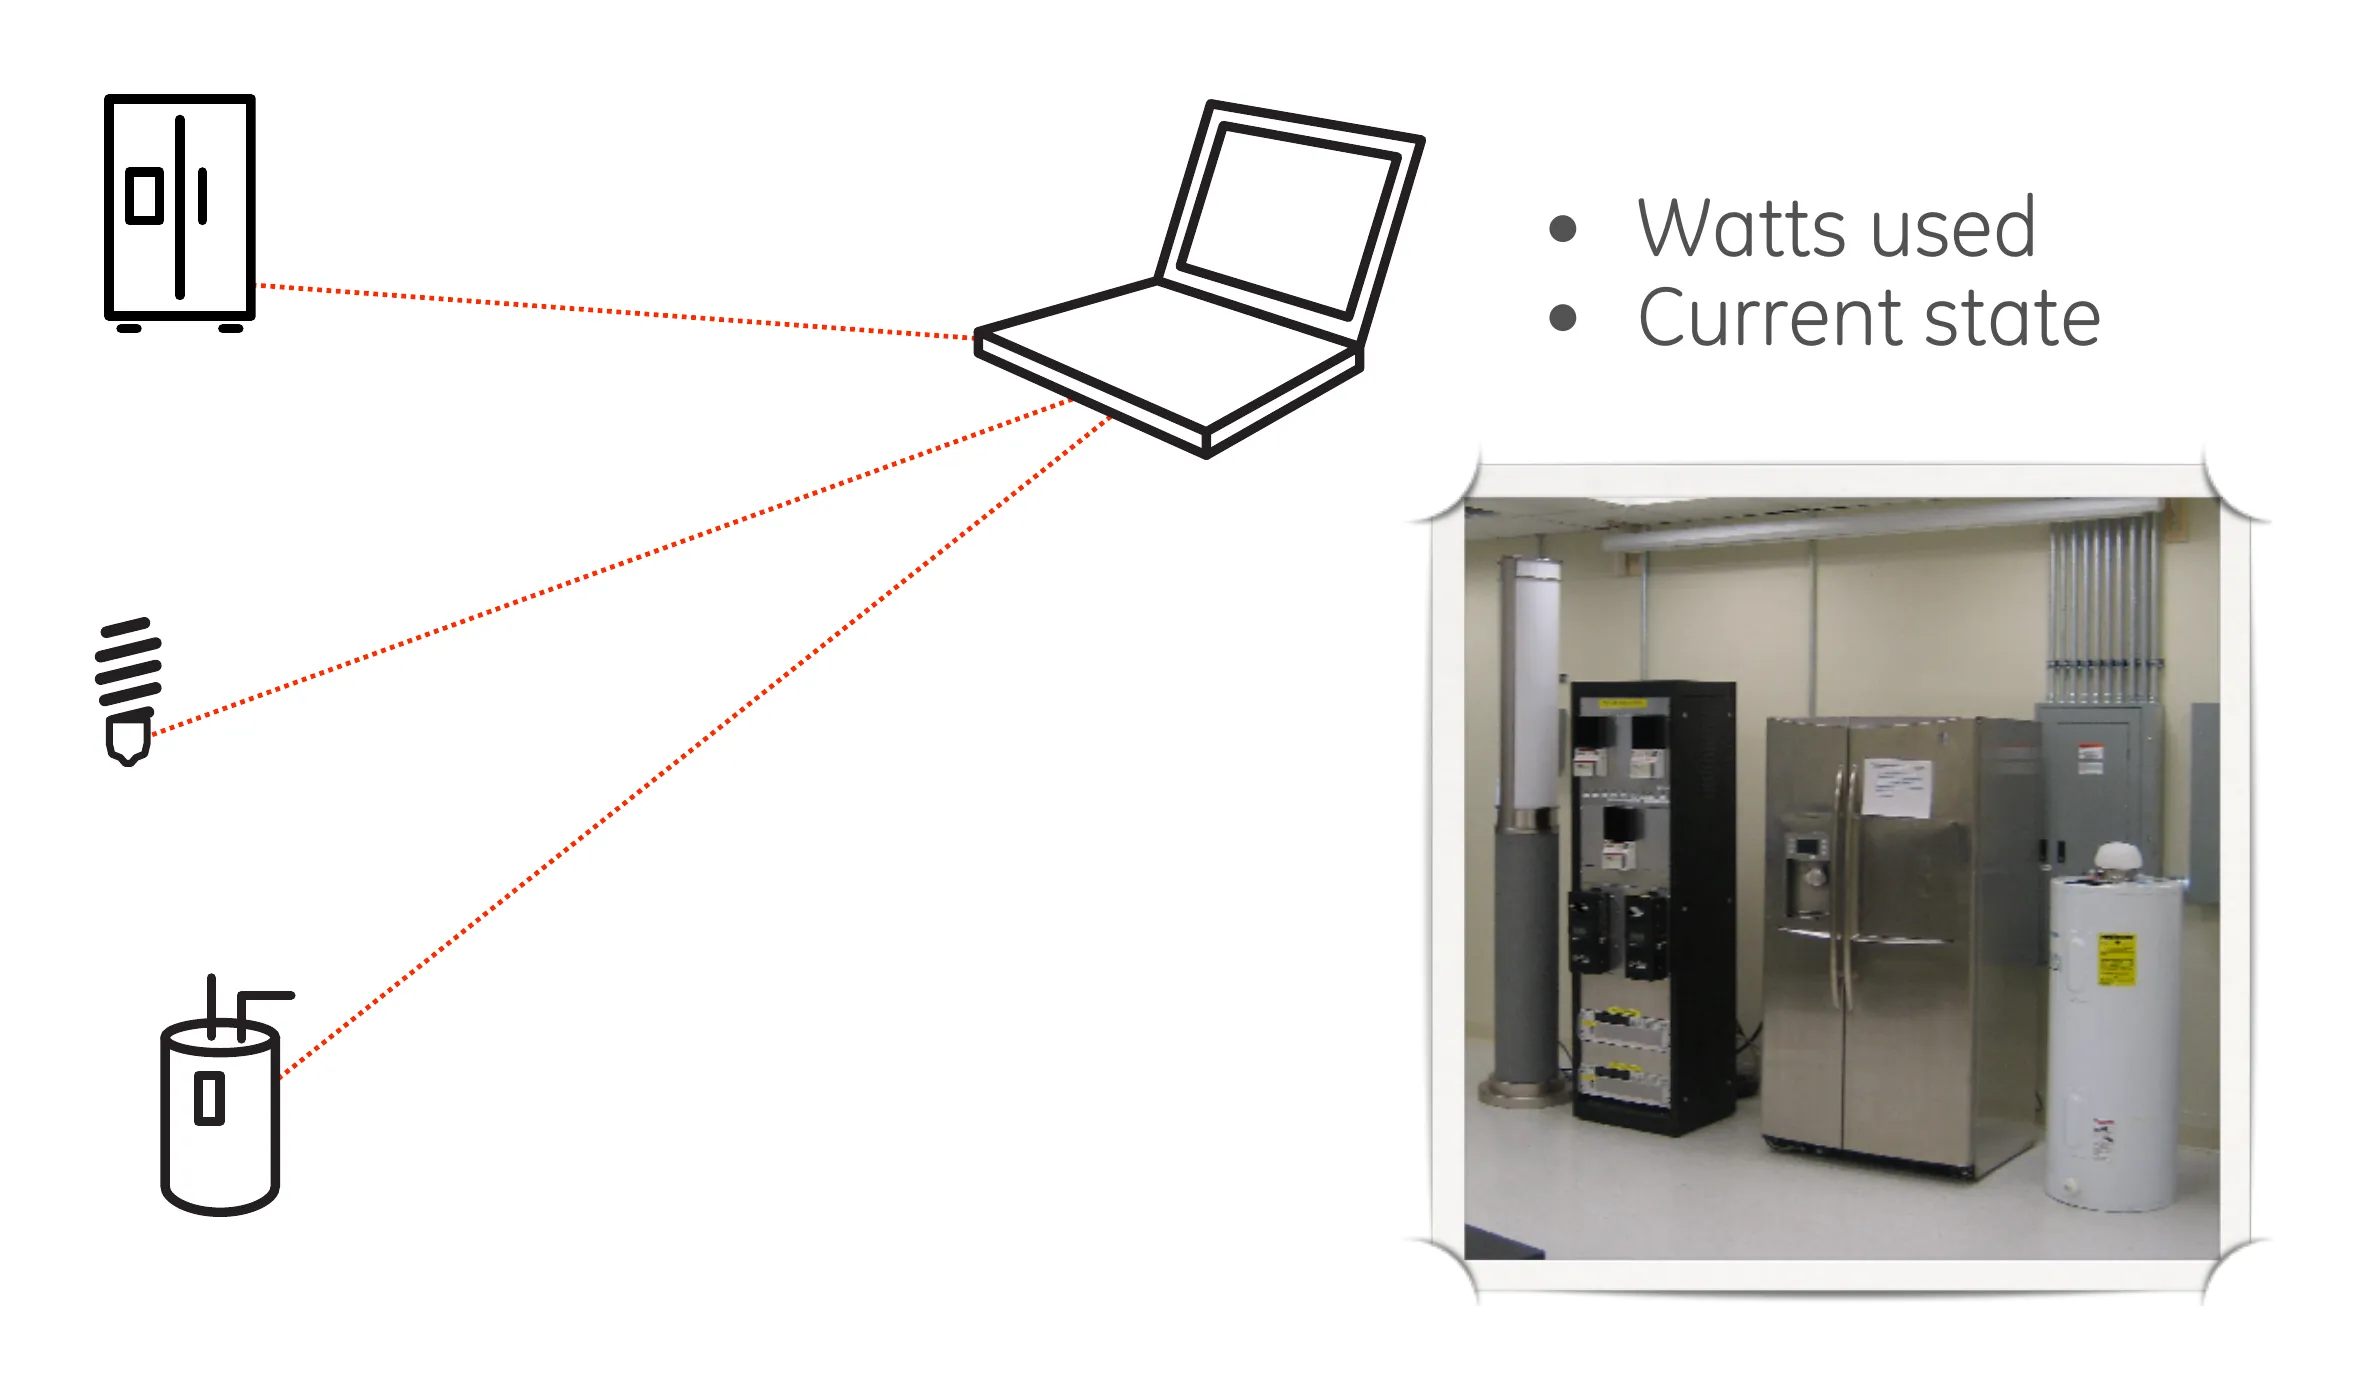
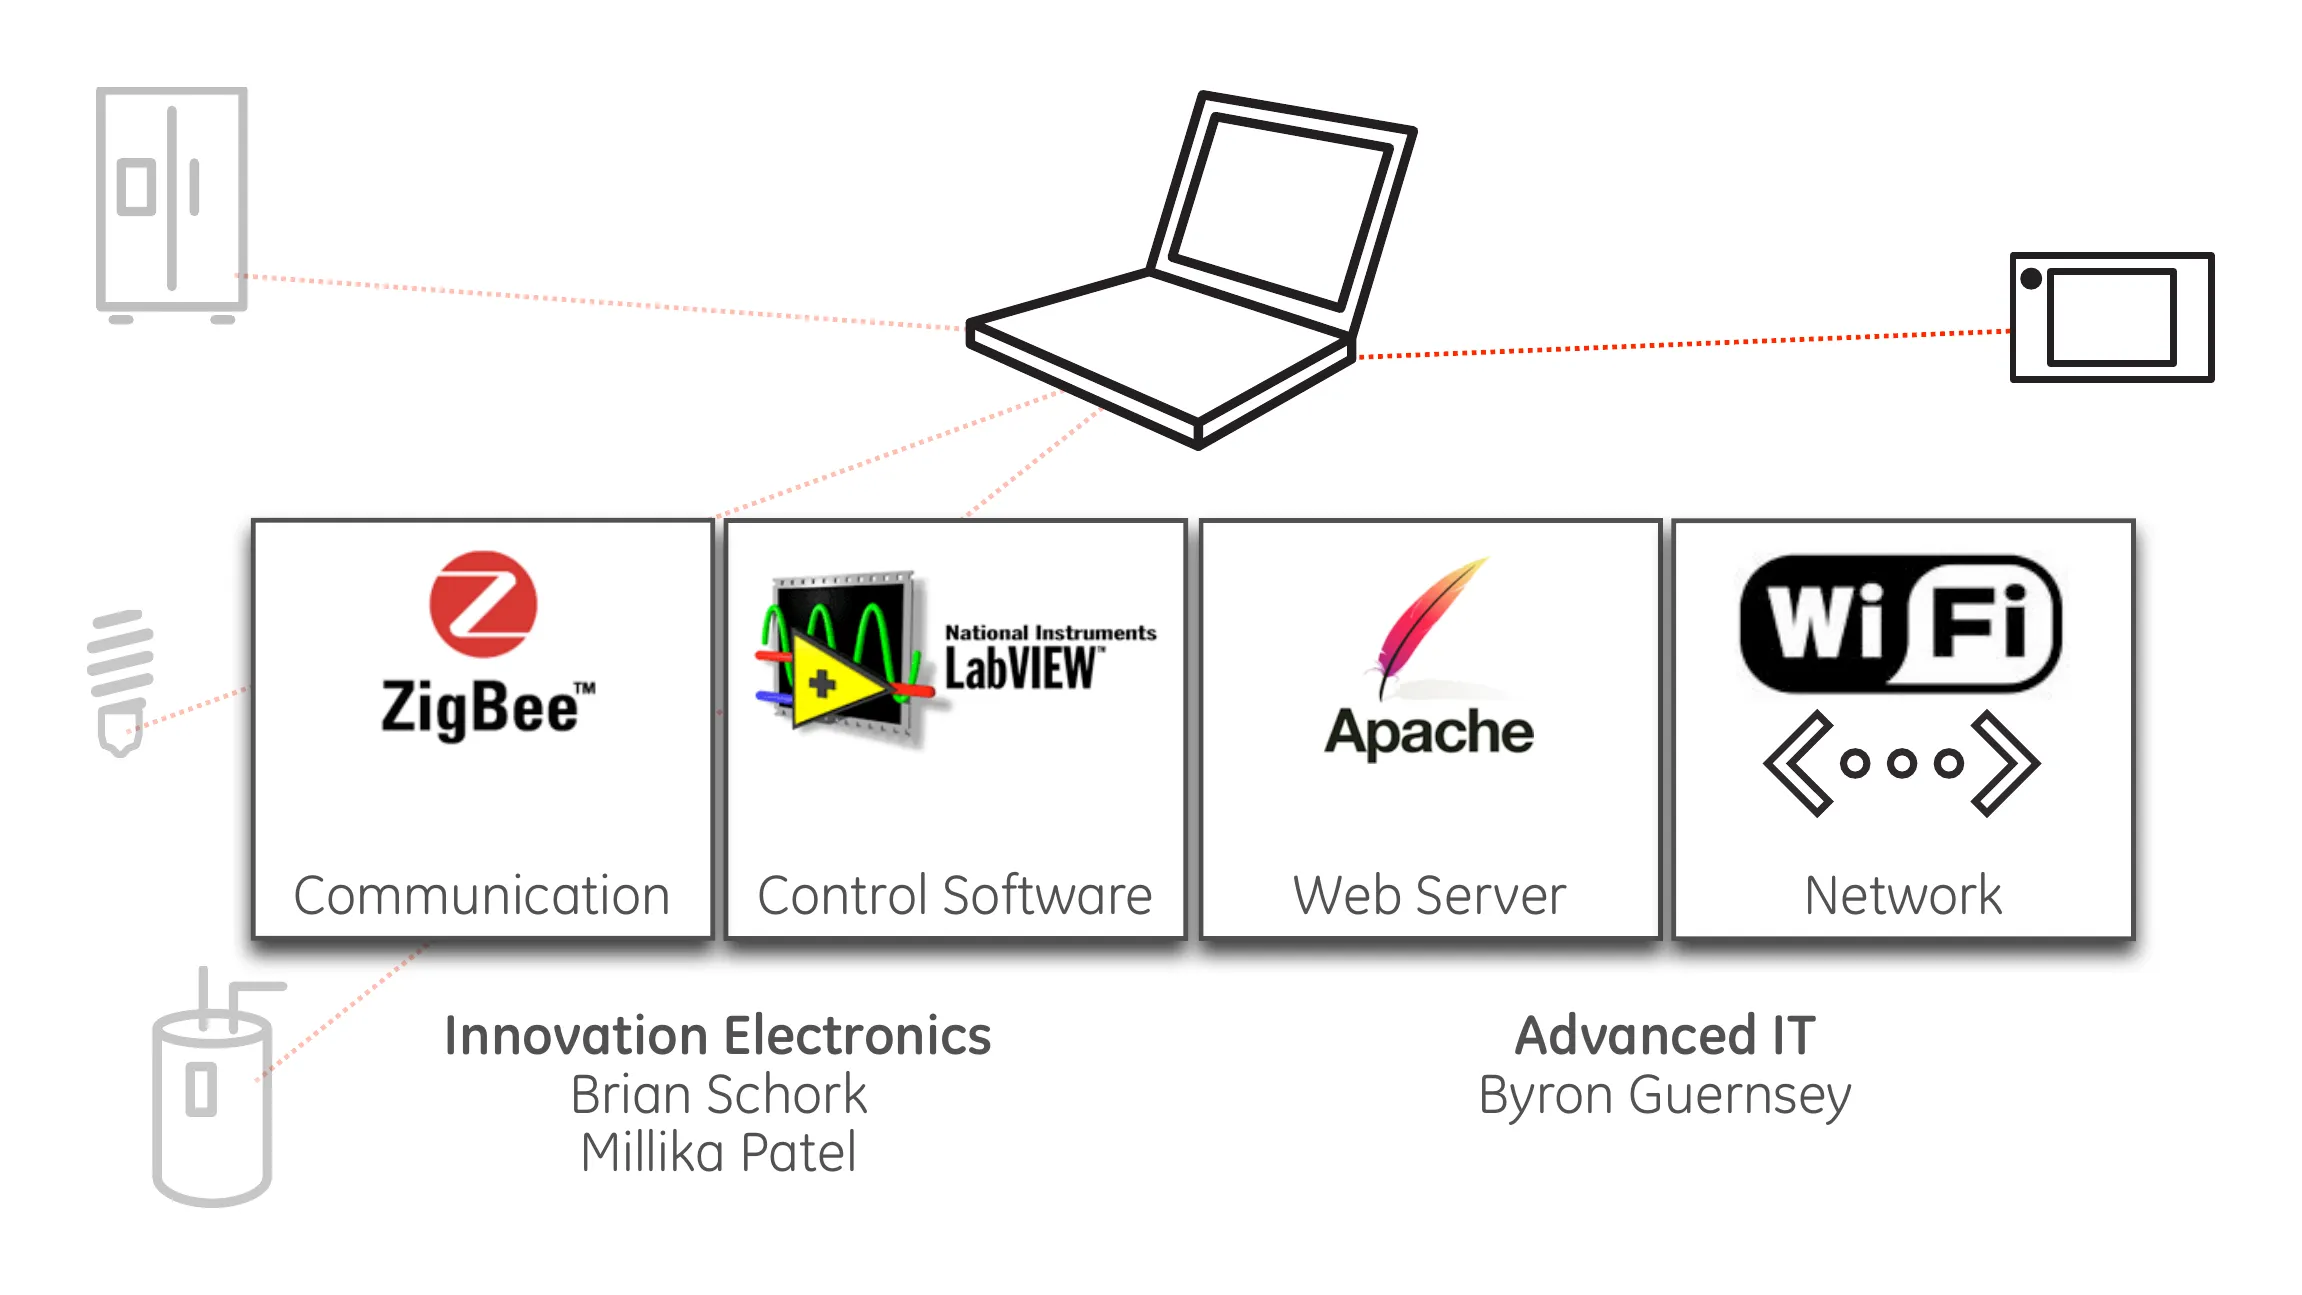
After the iPhone was announced, I designed a simple prototype for senior leadership to experience appliance control and energy information in the palm of their hand. In collaboration with the R&D team, we connected multiple appliances via Zigbee to a laptop that interpreted two-way communication in Labview, then ported it through a local-running webserver and wifi network. As I presented the concept, I asked if anyone in the audience had an iPhone (they were still brand new at this time). The phone connected to the laptop wifi and webserver and presented functional control and energy data. Executives could tap the phone screen and see the appliances adjust right there in the room. It was the start of GE appliance IoT and remote control.
The two demos built at the research center in the spring of 2008. The first read watts and state from a refrigerator, a bulb and a water heater; the second added ZigBee, LabVIEW control software, an Apache web server and WiFi, and a touchscreen.
v2 Home Energy Manager
The Home Energy Manager as rendered, its edge lighting glowing green: a redesign of the Eco Dashboard that mounted on a wall or stood alone on one power-over-ethernet cable, its touchscreen optional, the light and sound carrying energy and water use.
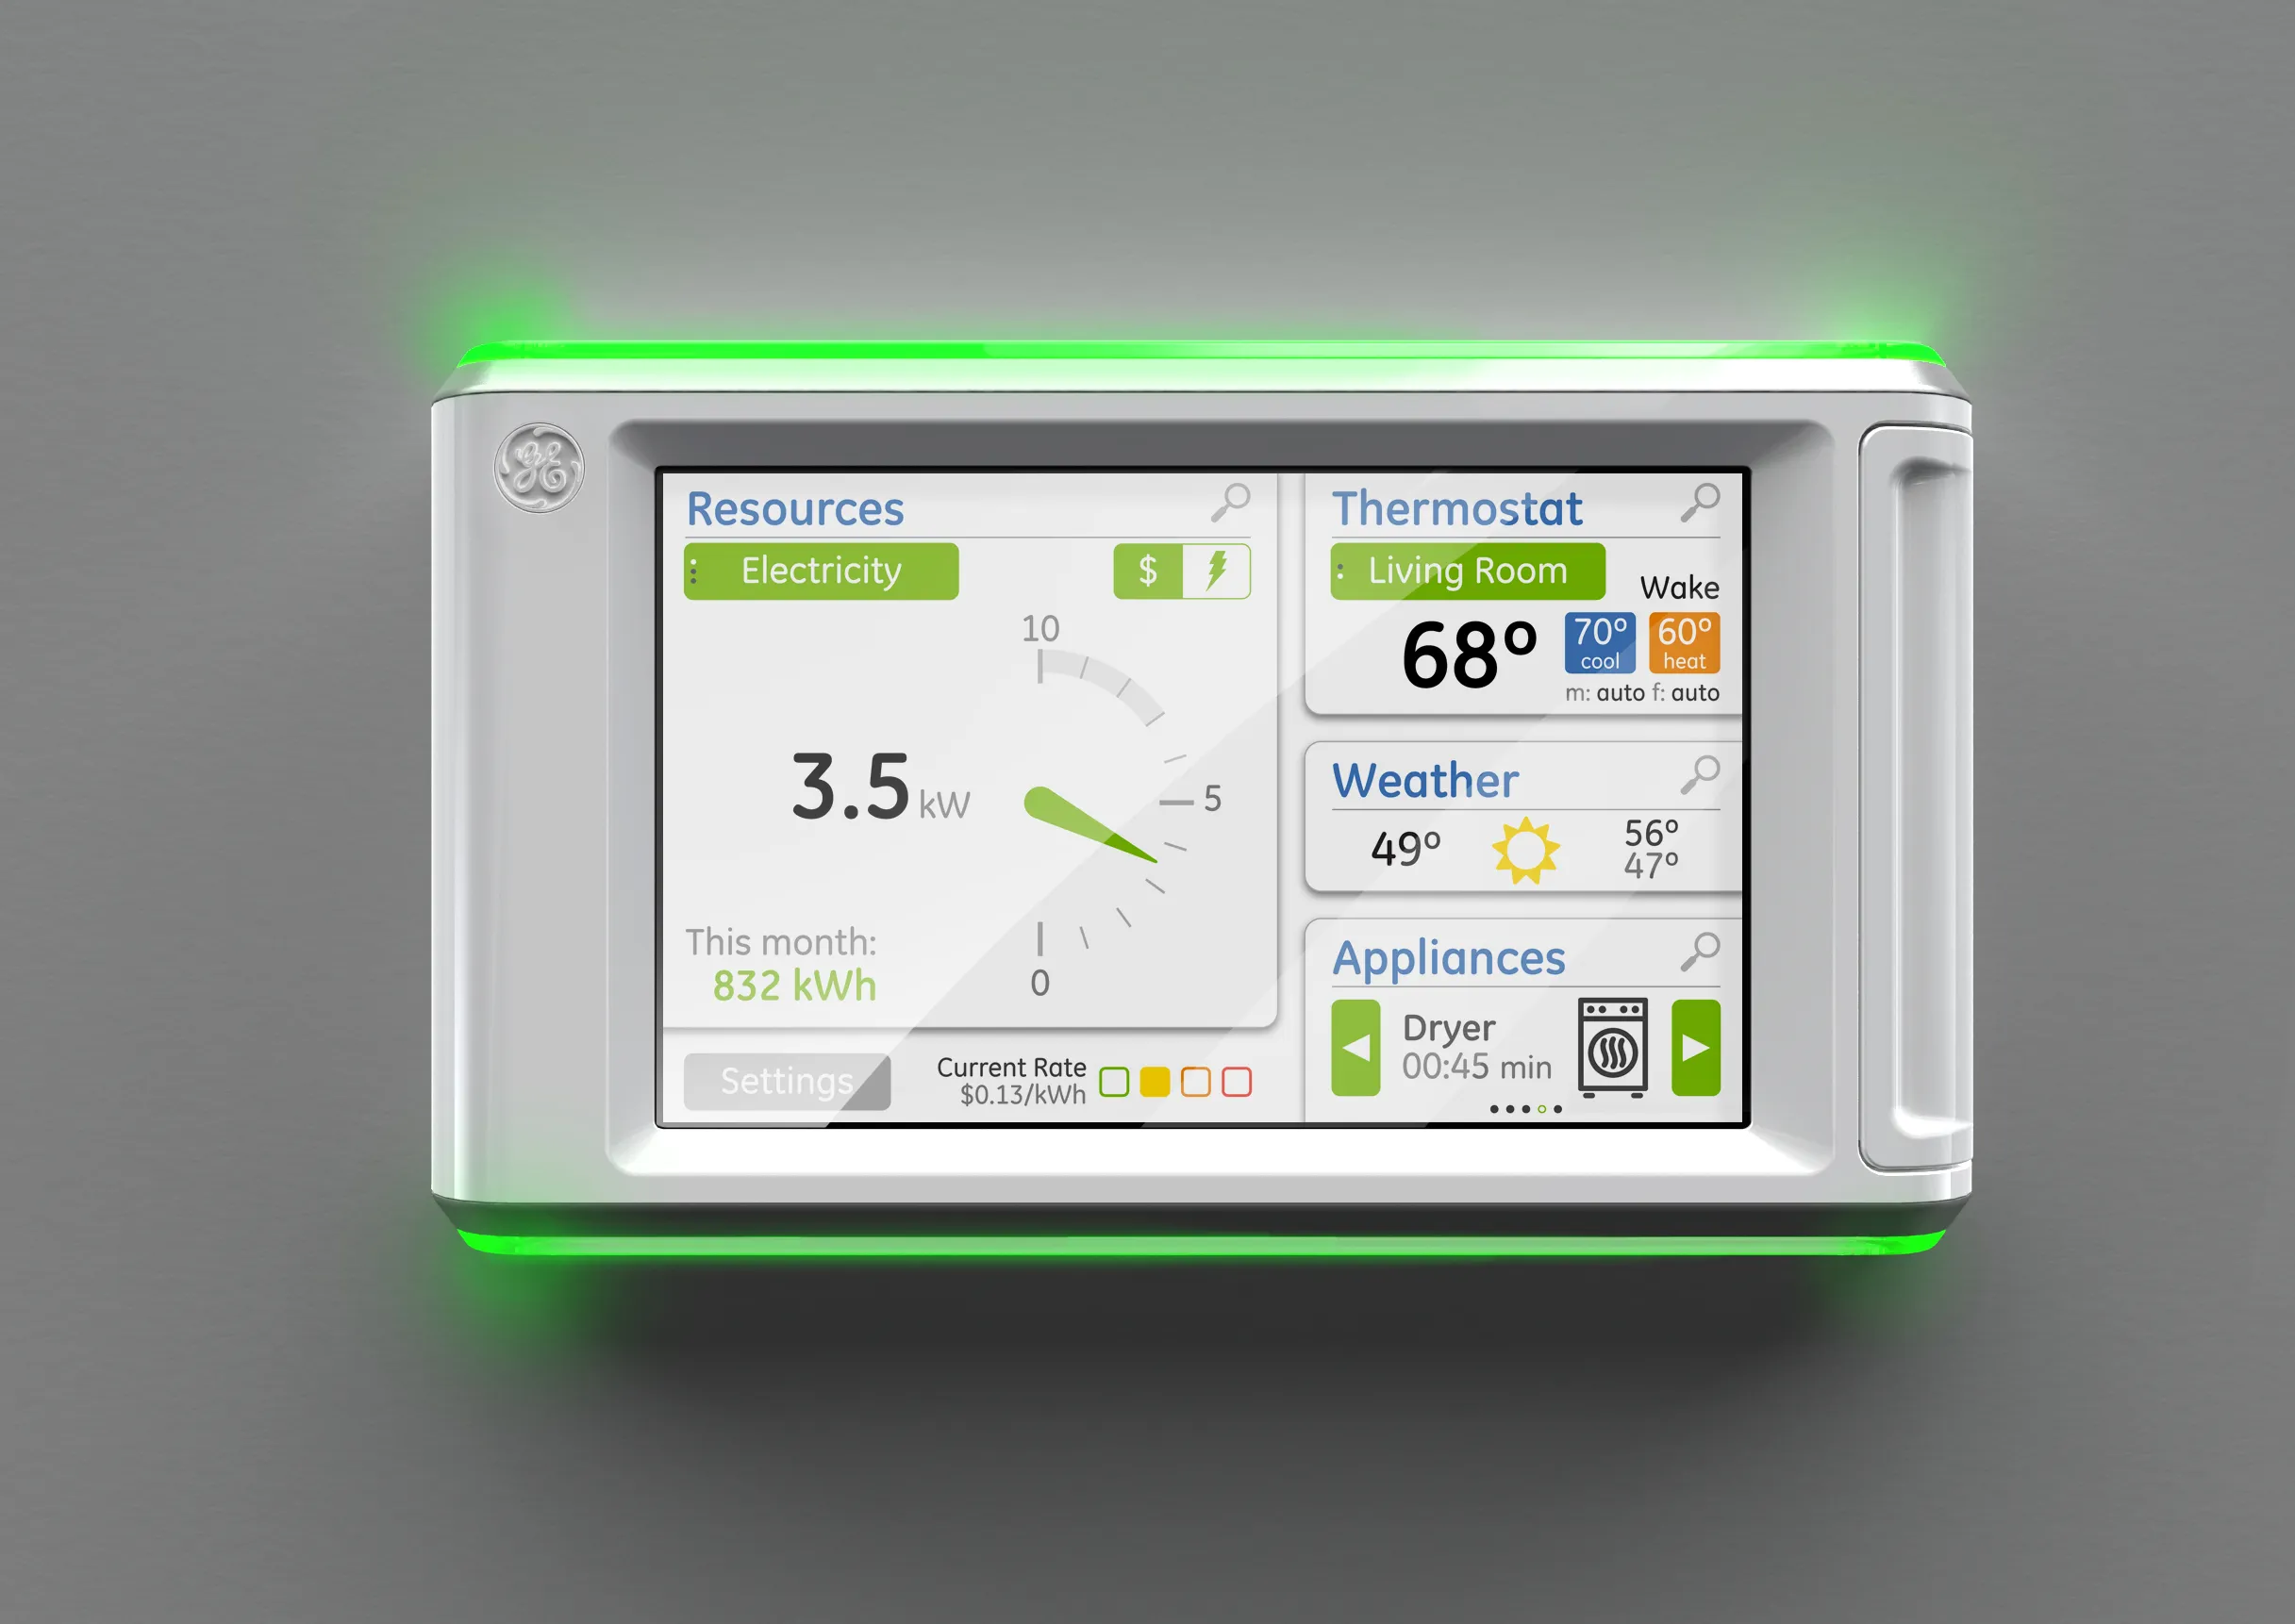
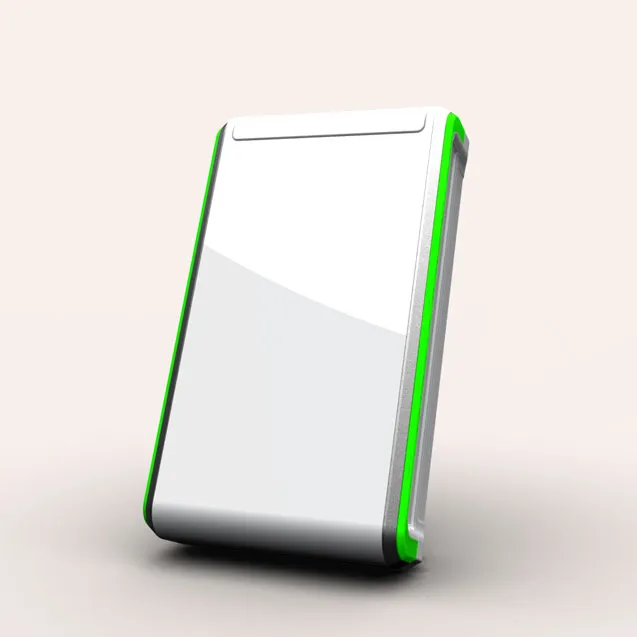
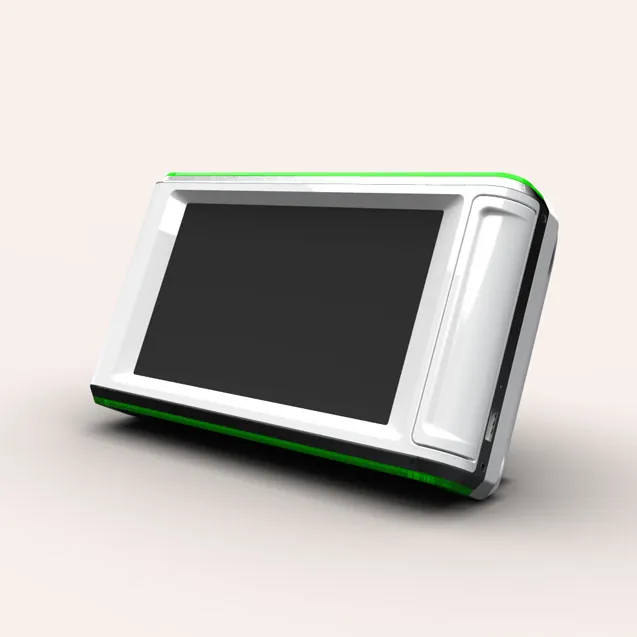
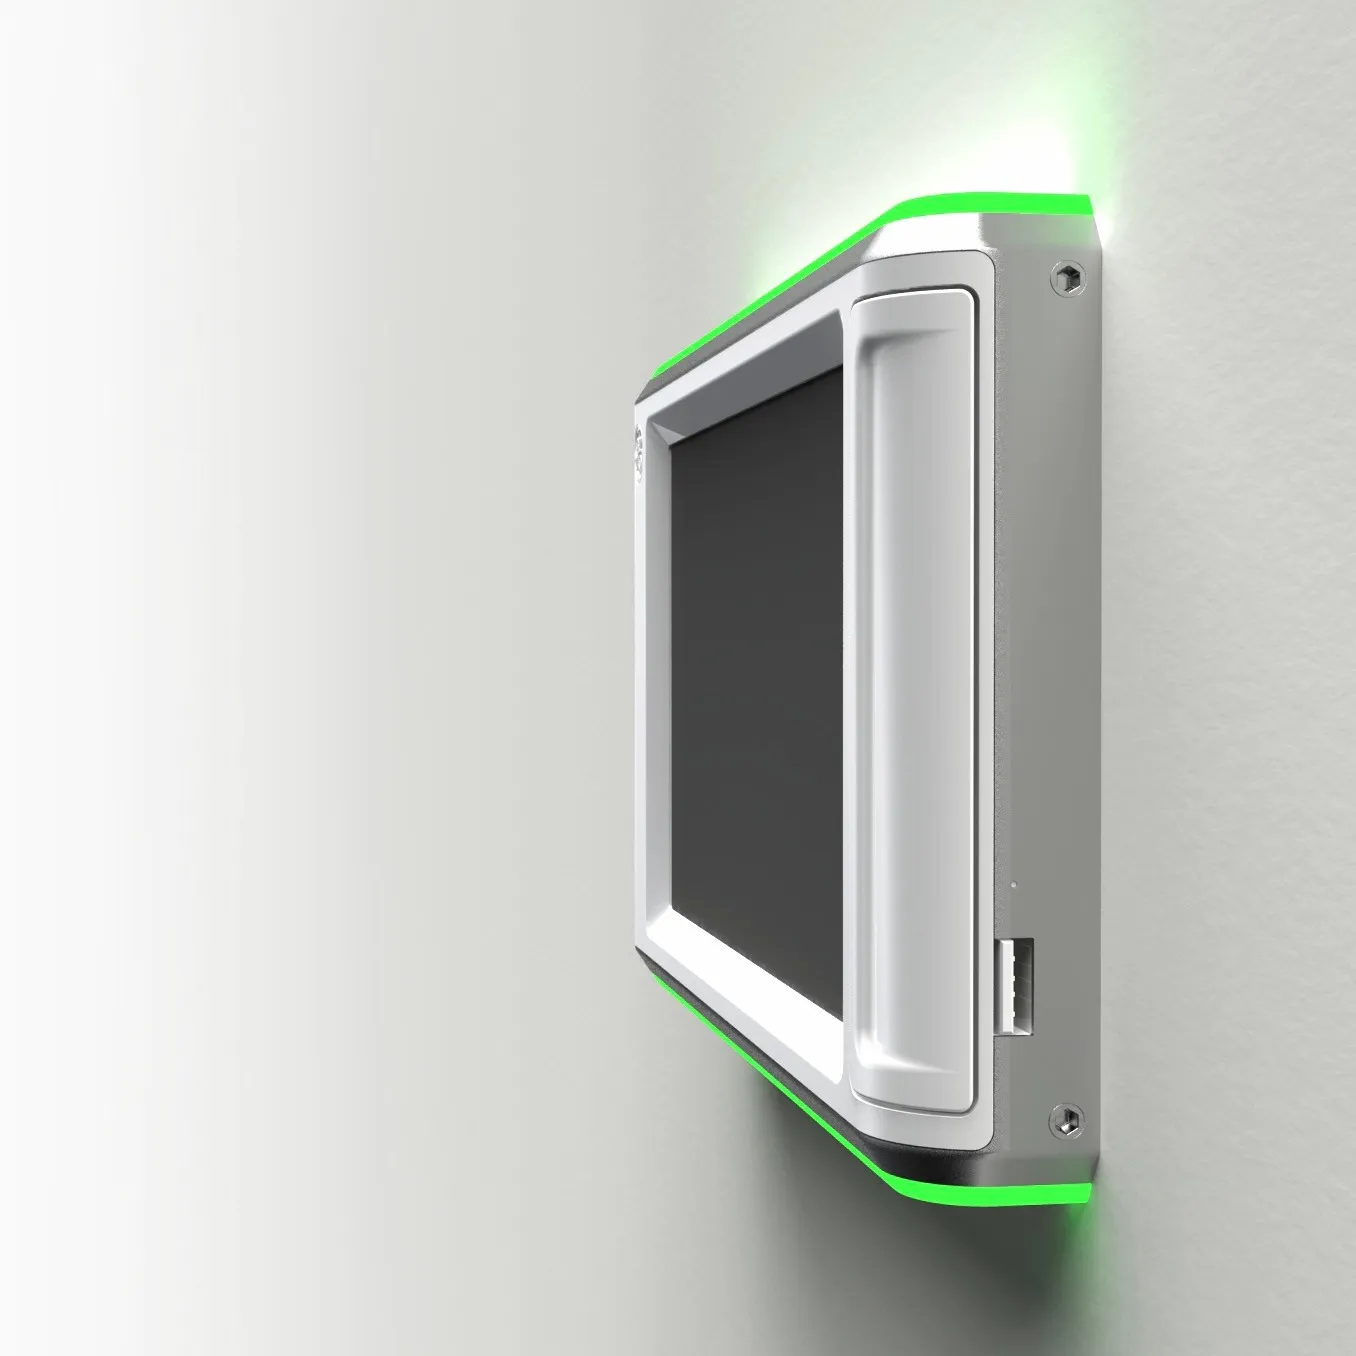
The Home Energy Manager was a complete redesign of the original Eco Dashboard. This device could be attached to a wall or sit self-standing, both setups using a single power-over-ethernet cable for easy installation. Following our iPhone prototype, the HEM touchscreen was now optional with the faceless version providing ambient lighting and audio to communicate energy and water usage.
Three renderings of the Home Energy Manager: the faceless version standing alone, the touchscreen version standing alone, and the touchscreen mounted on a wall, each lit green along its edges.
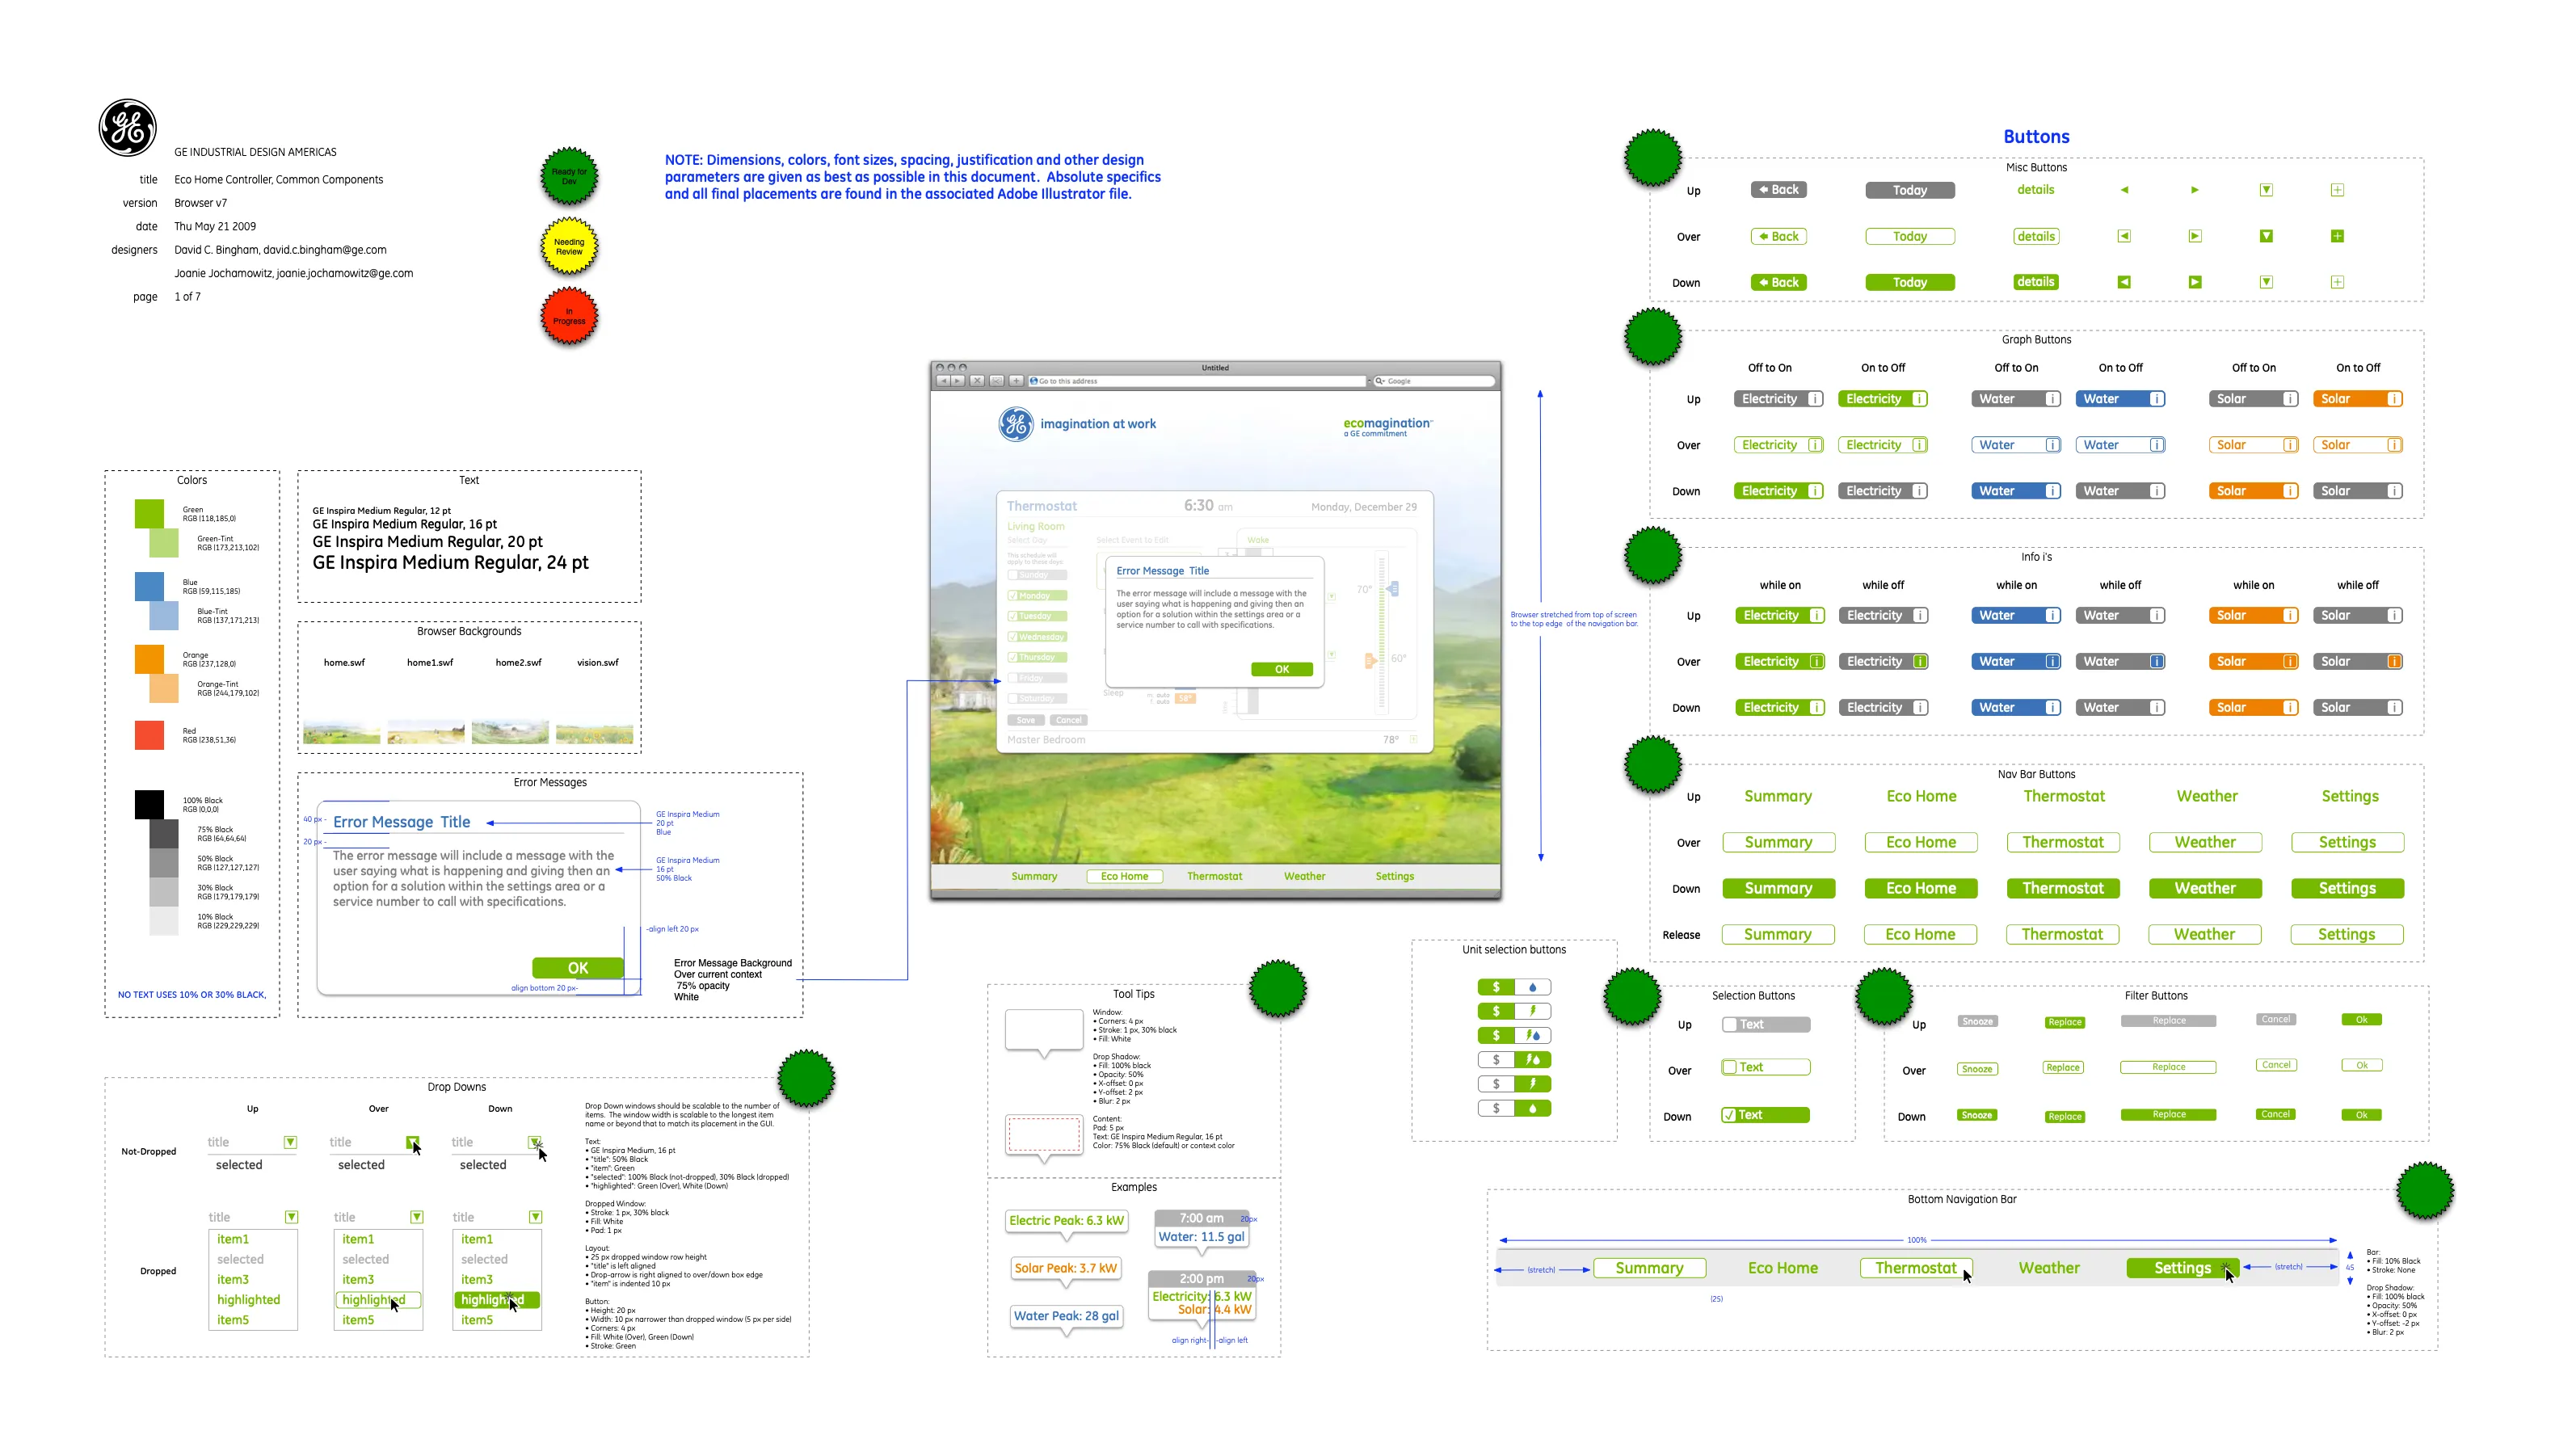
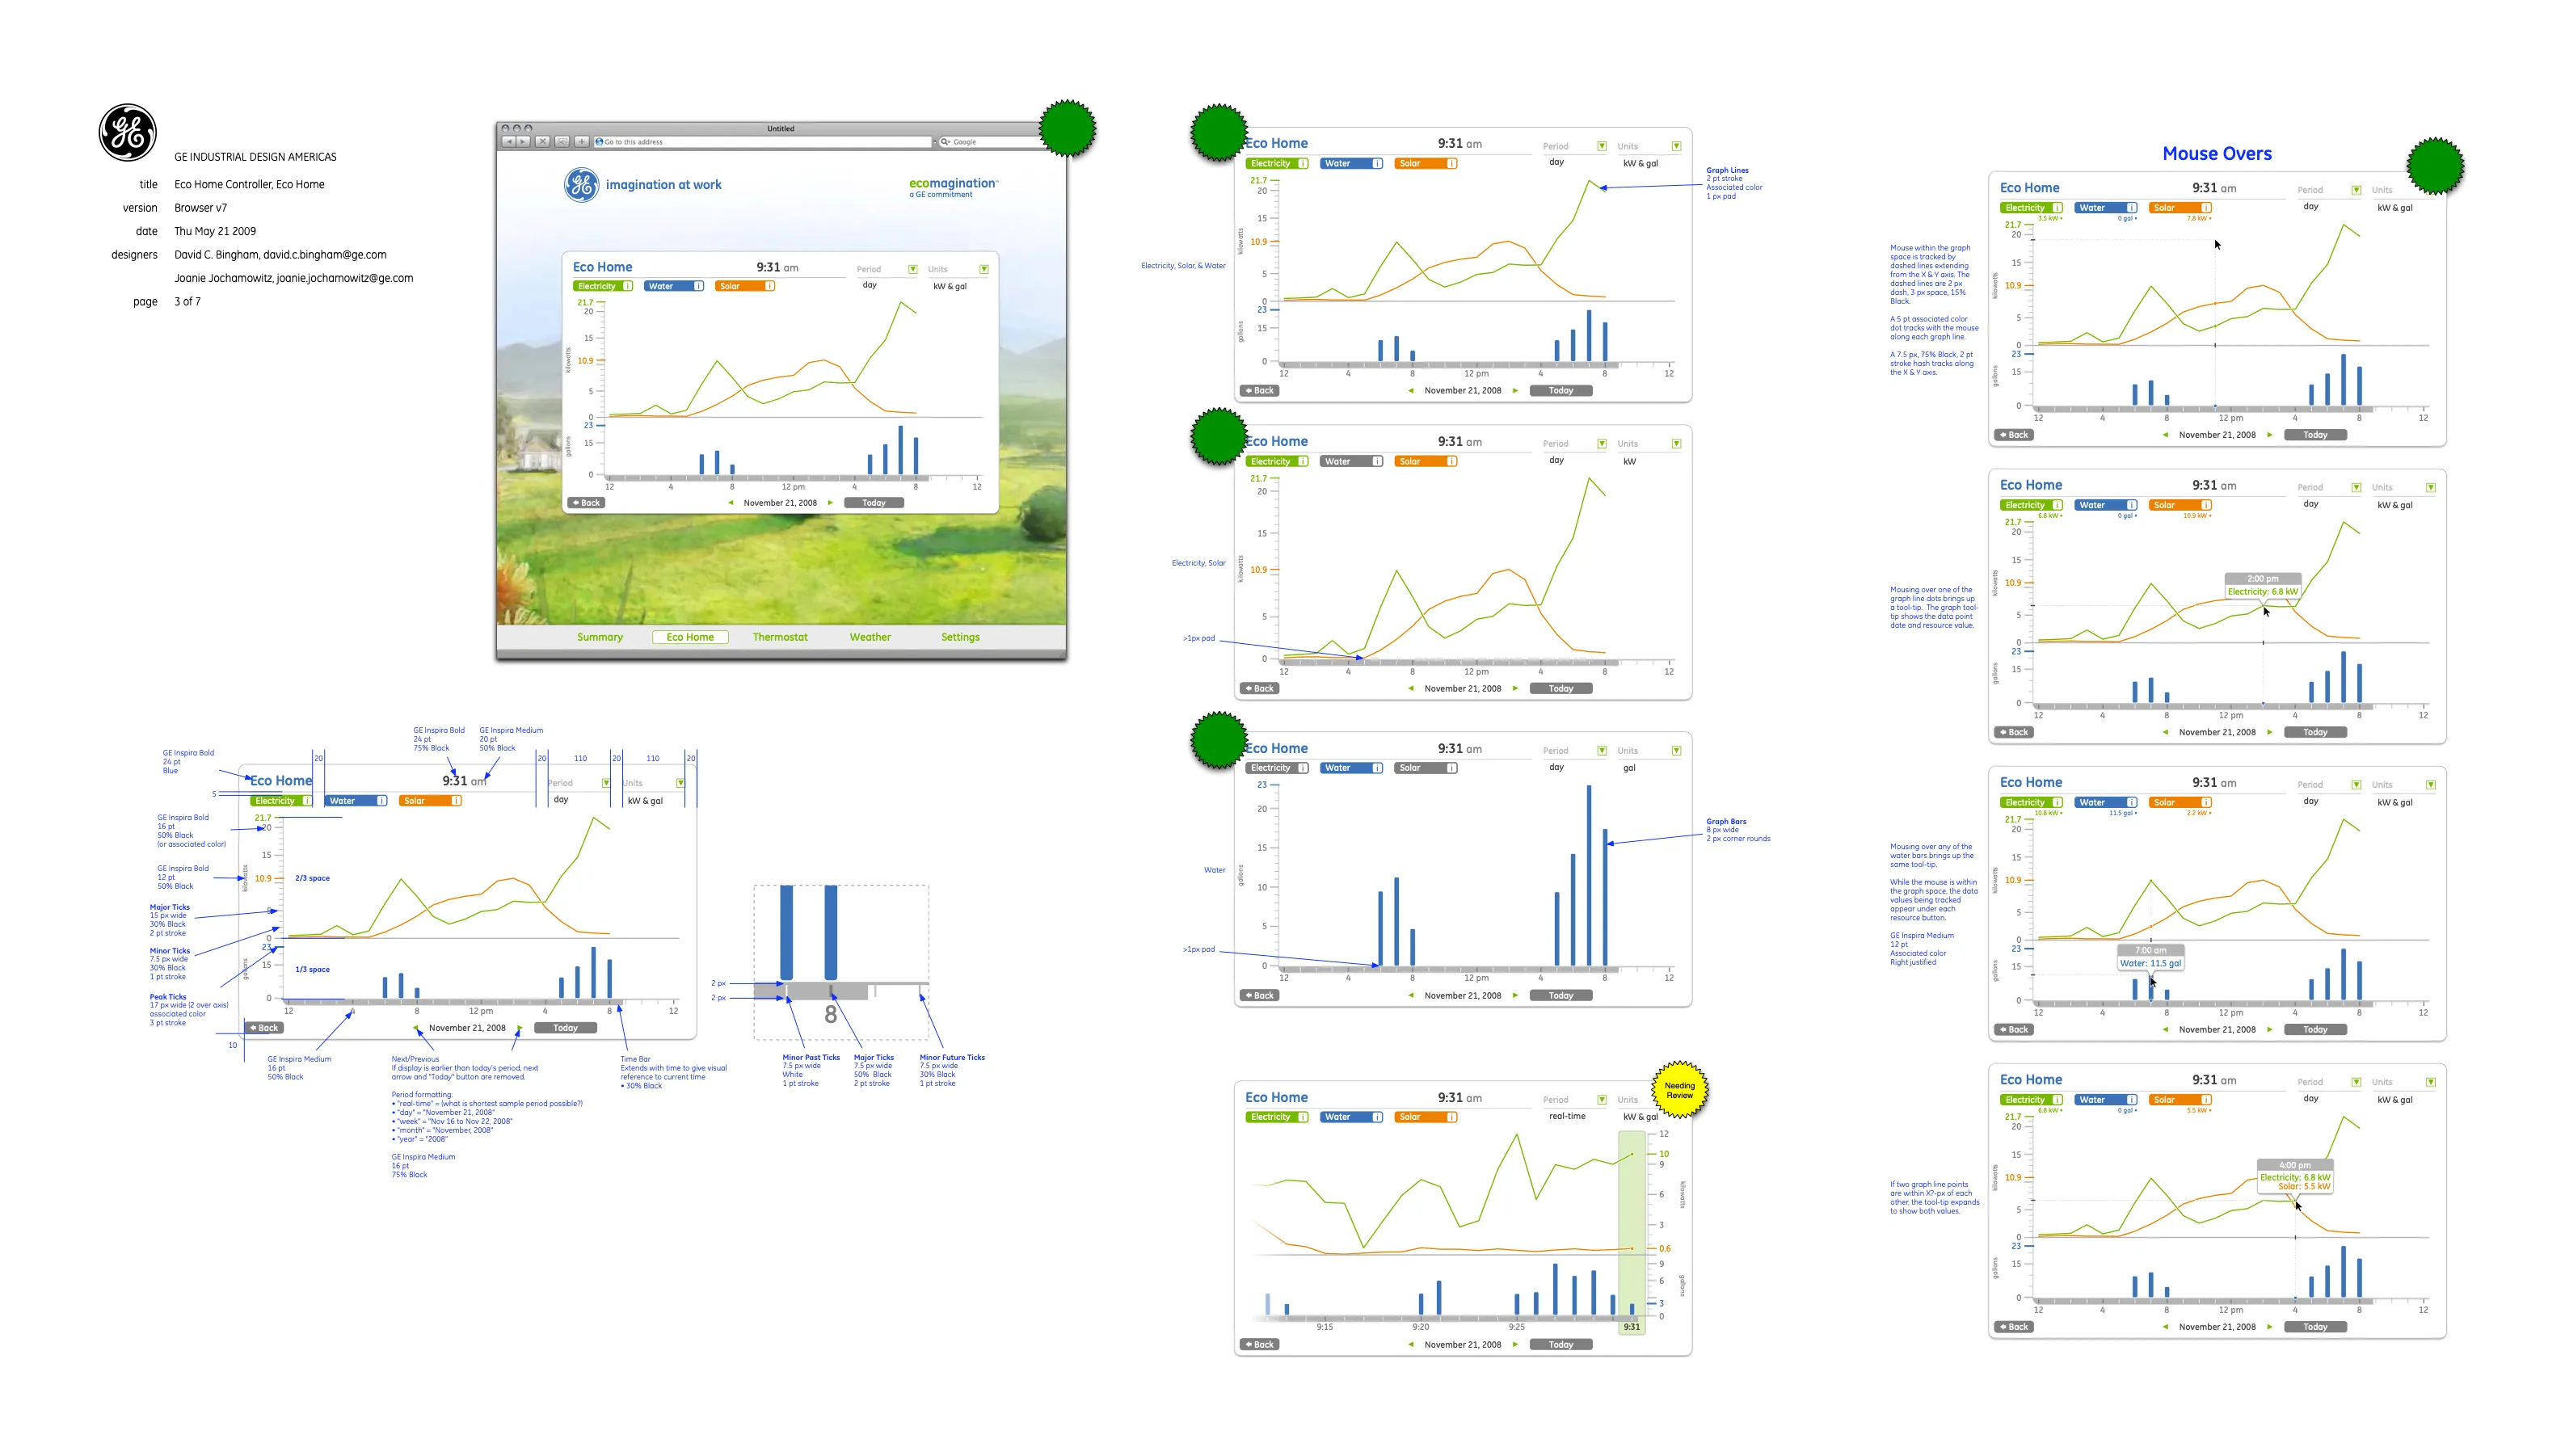
Two pages of the Eco Home browser specification I wrote with Joanne Jochimowitz in May 2009: the common components, from colors and type to buttons and error messages, and the Eco Home charts with their mouse-over states.
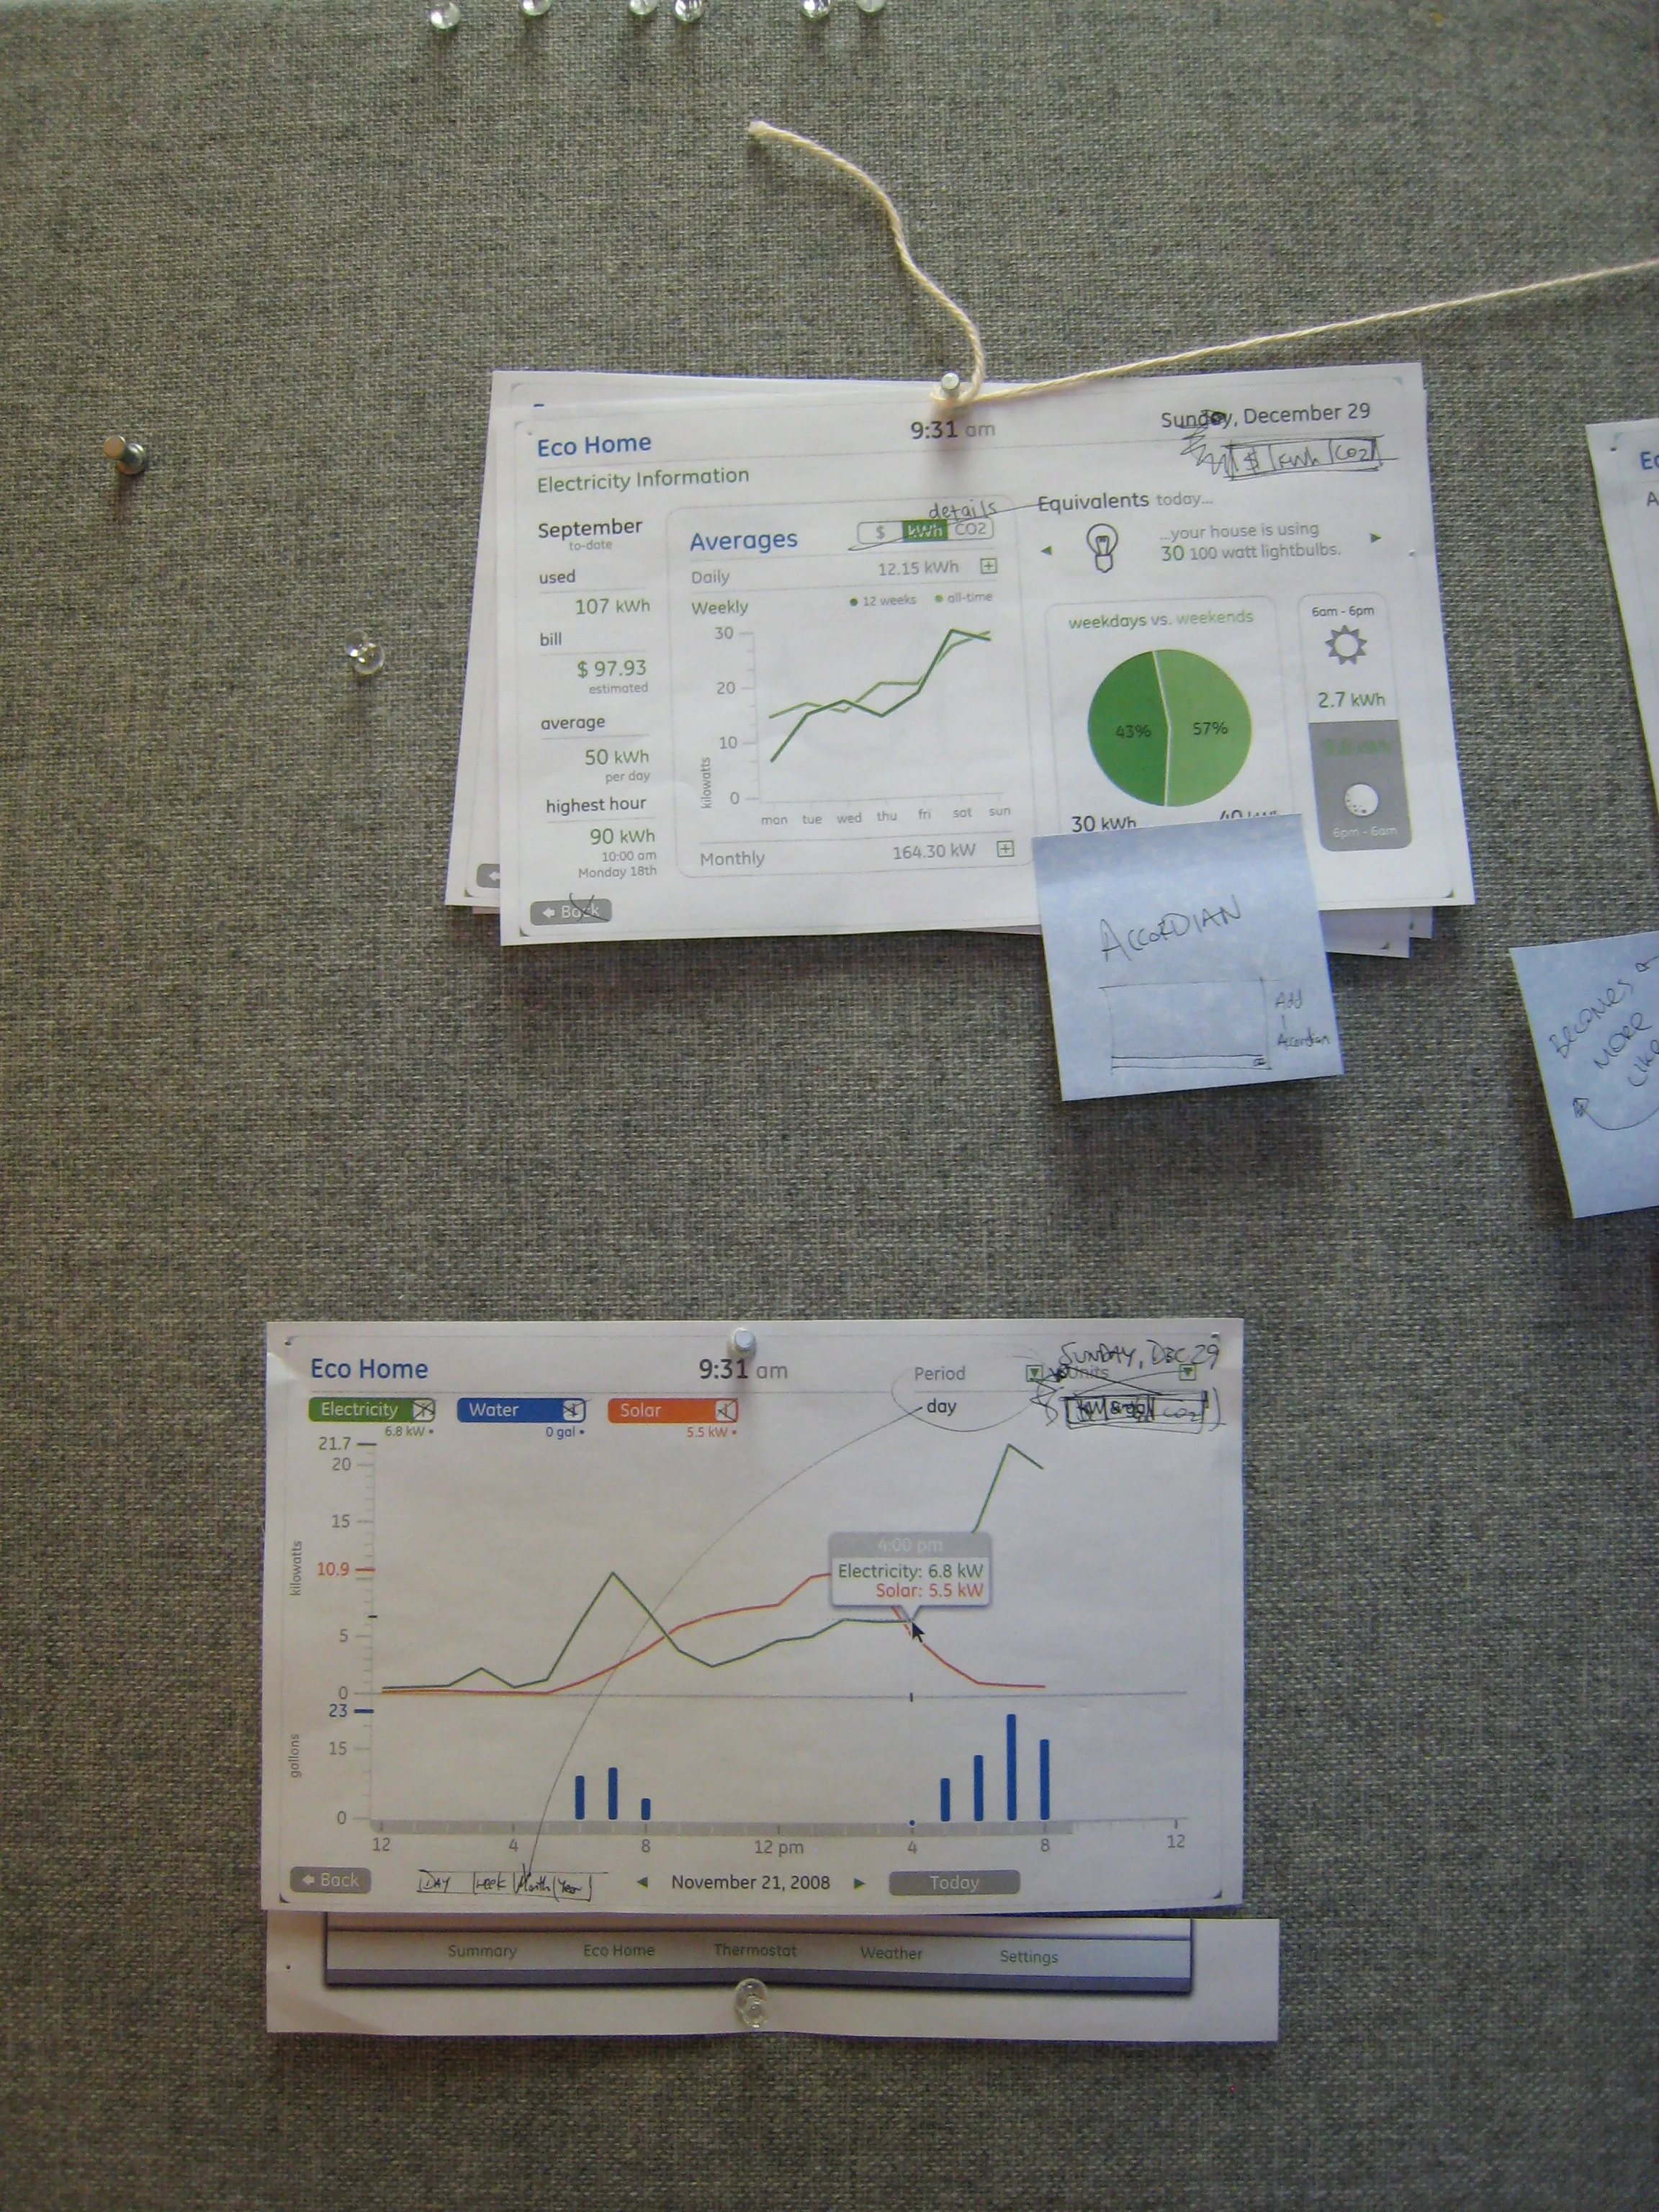
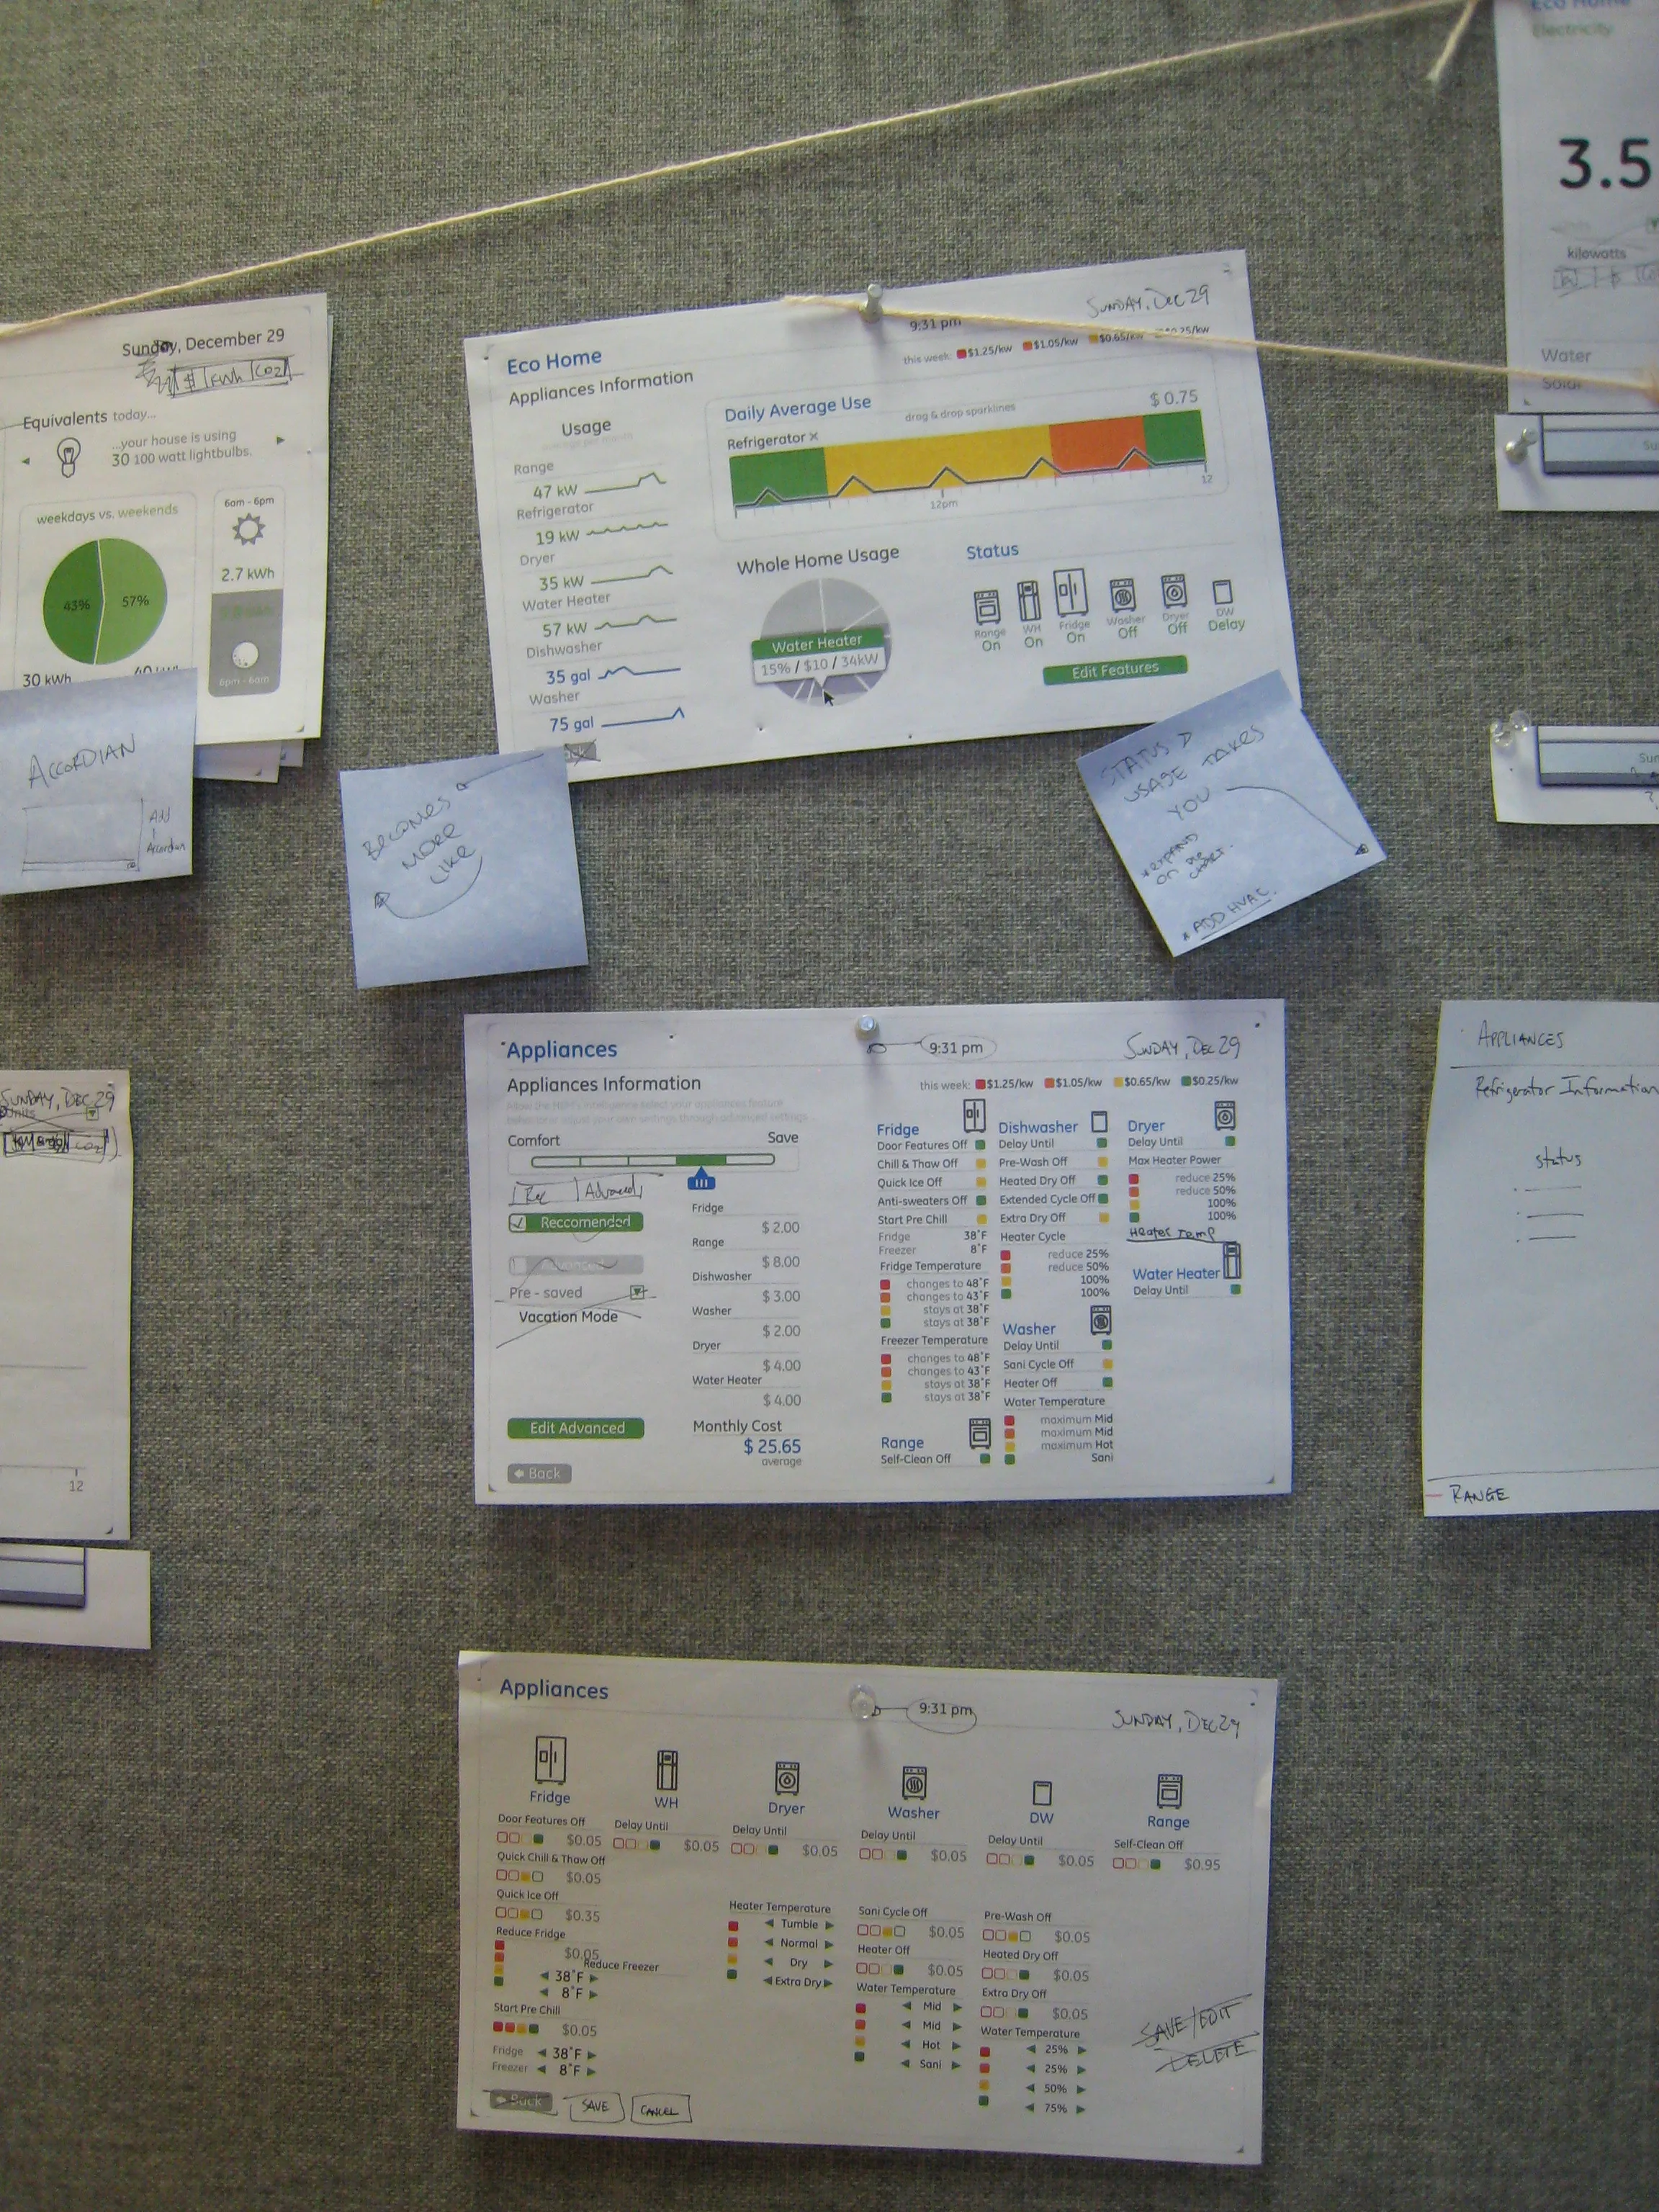
Printed screens pinned to a wall with string and sticky notes in May 2009, while we reorganised the browser navigation. Working at this scale let the team move whole screens between sections and see the result at once.
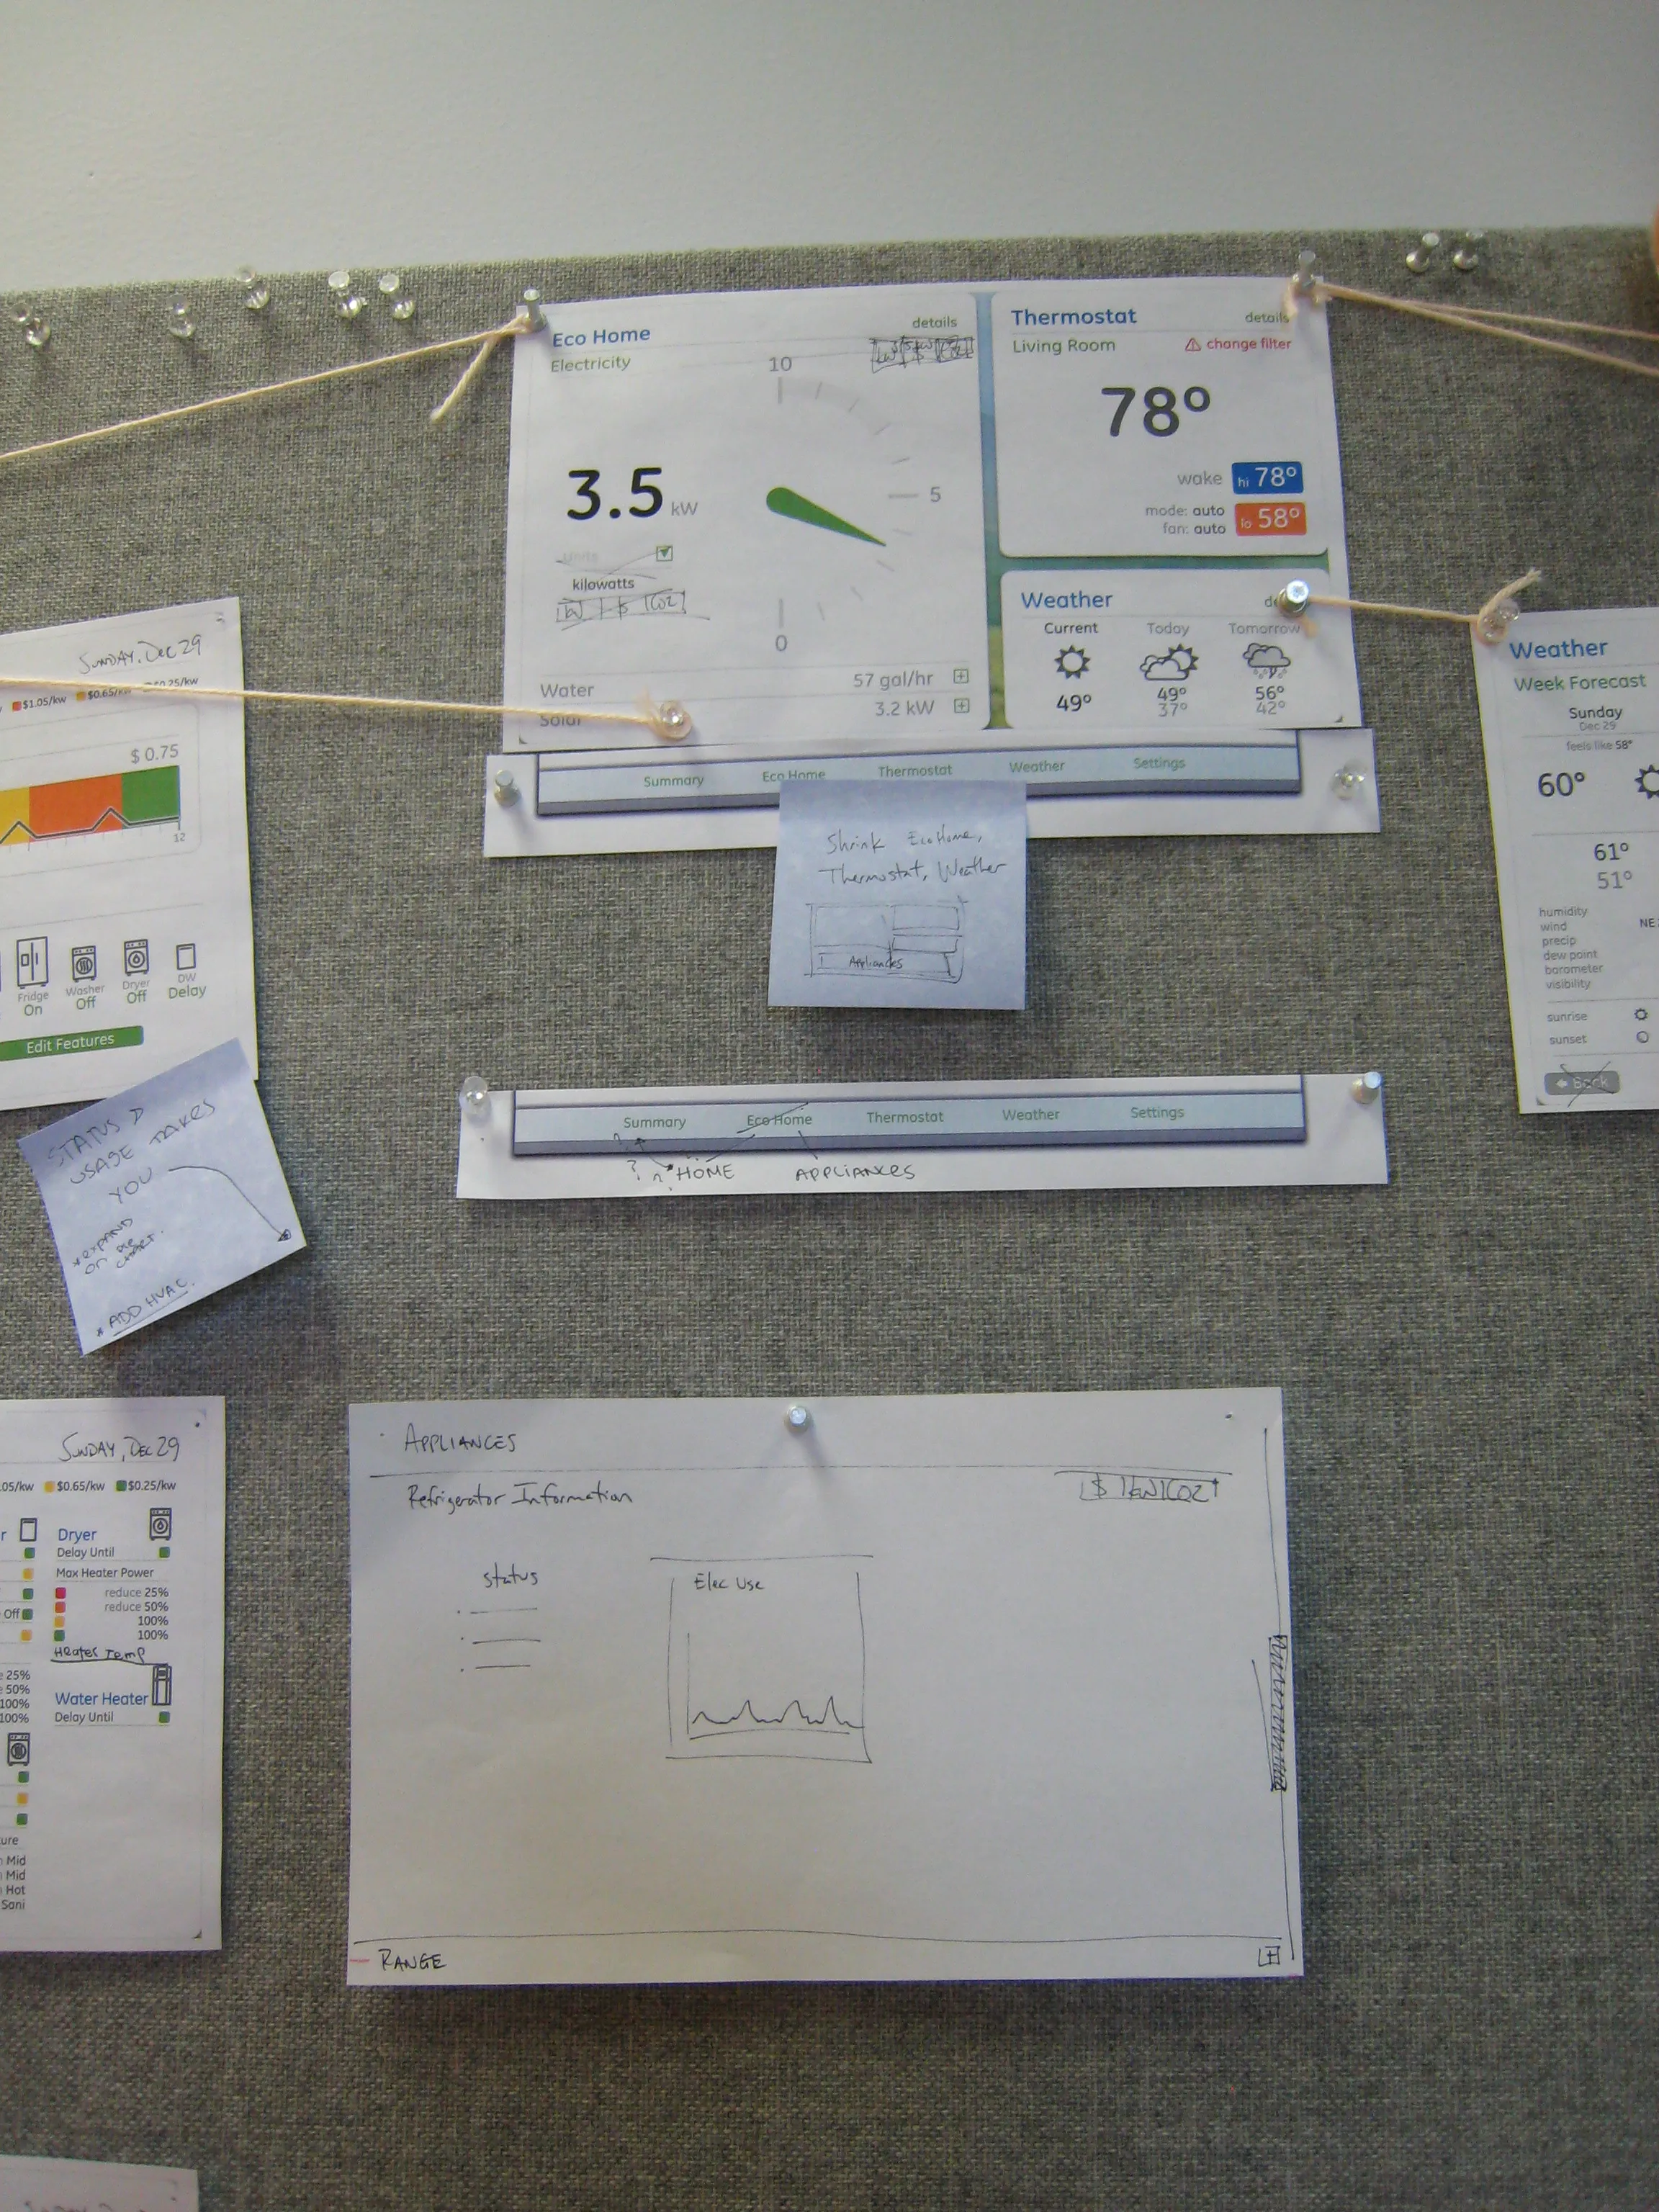
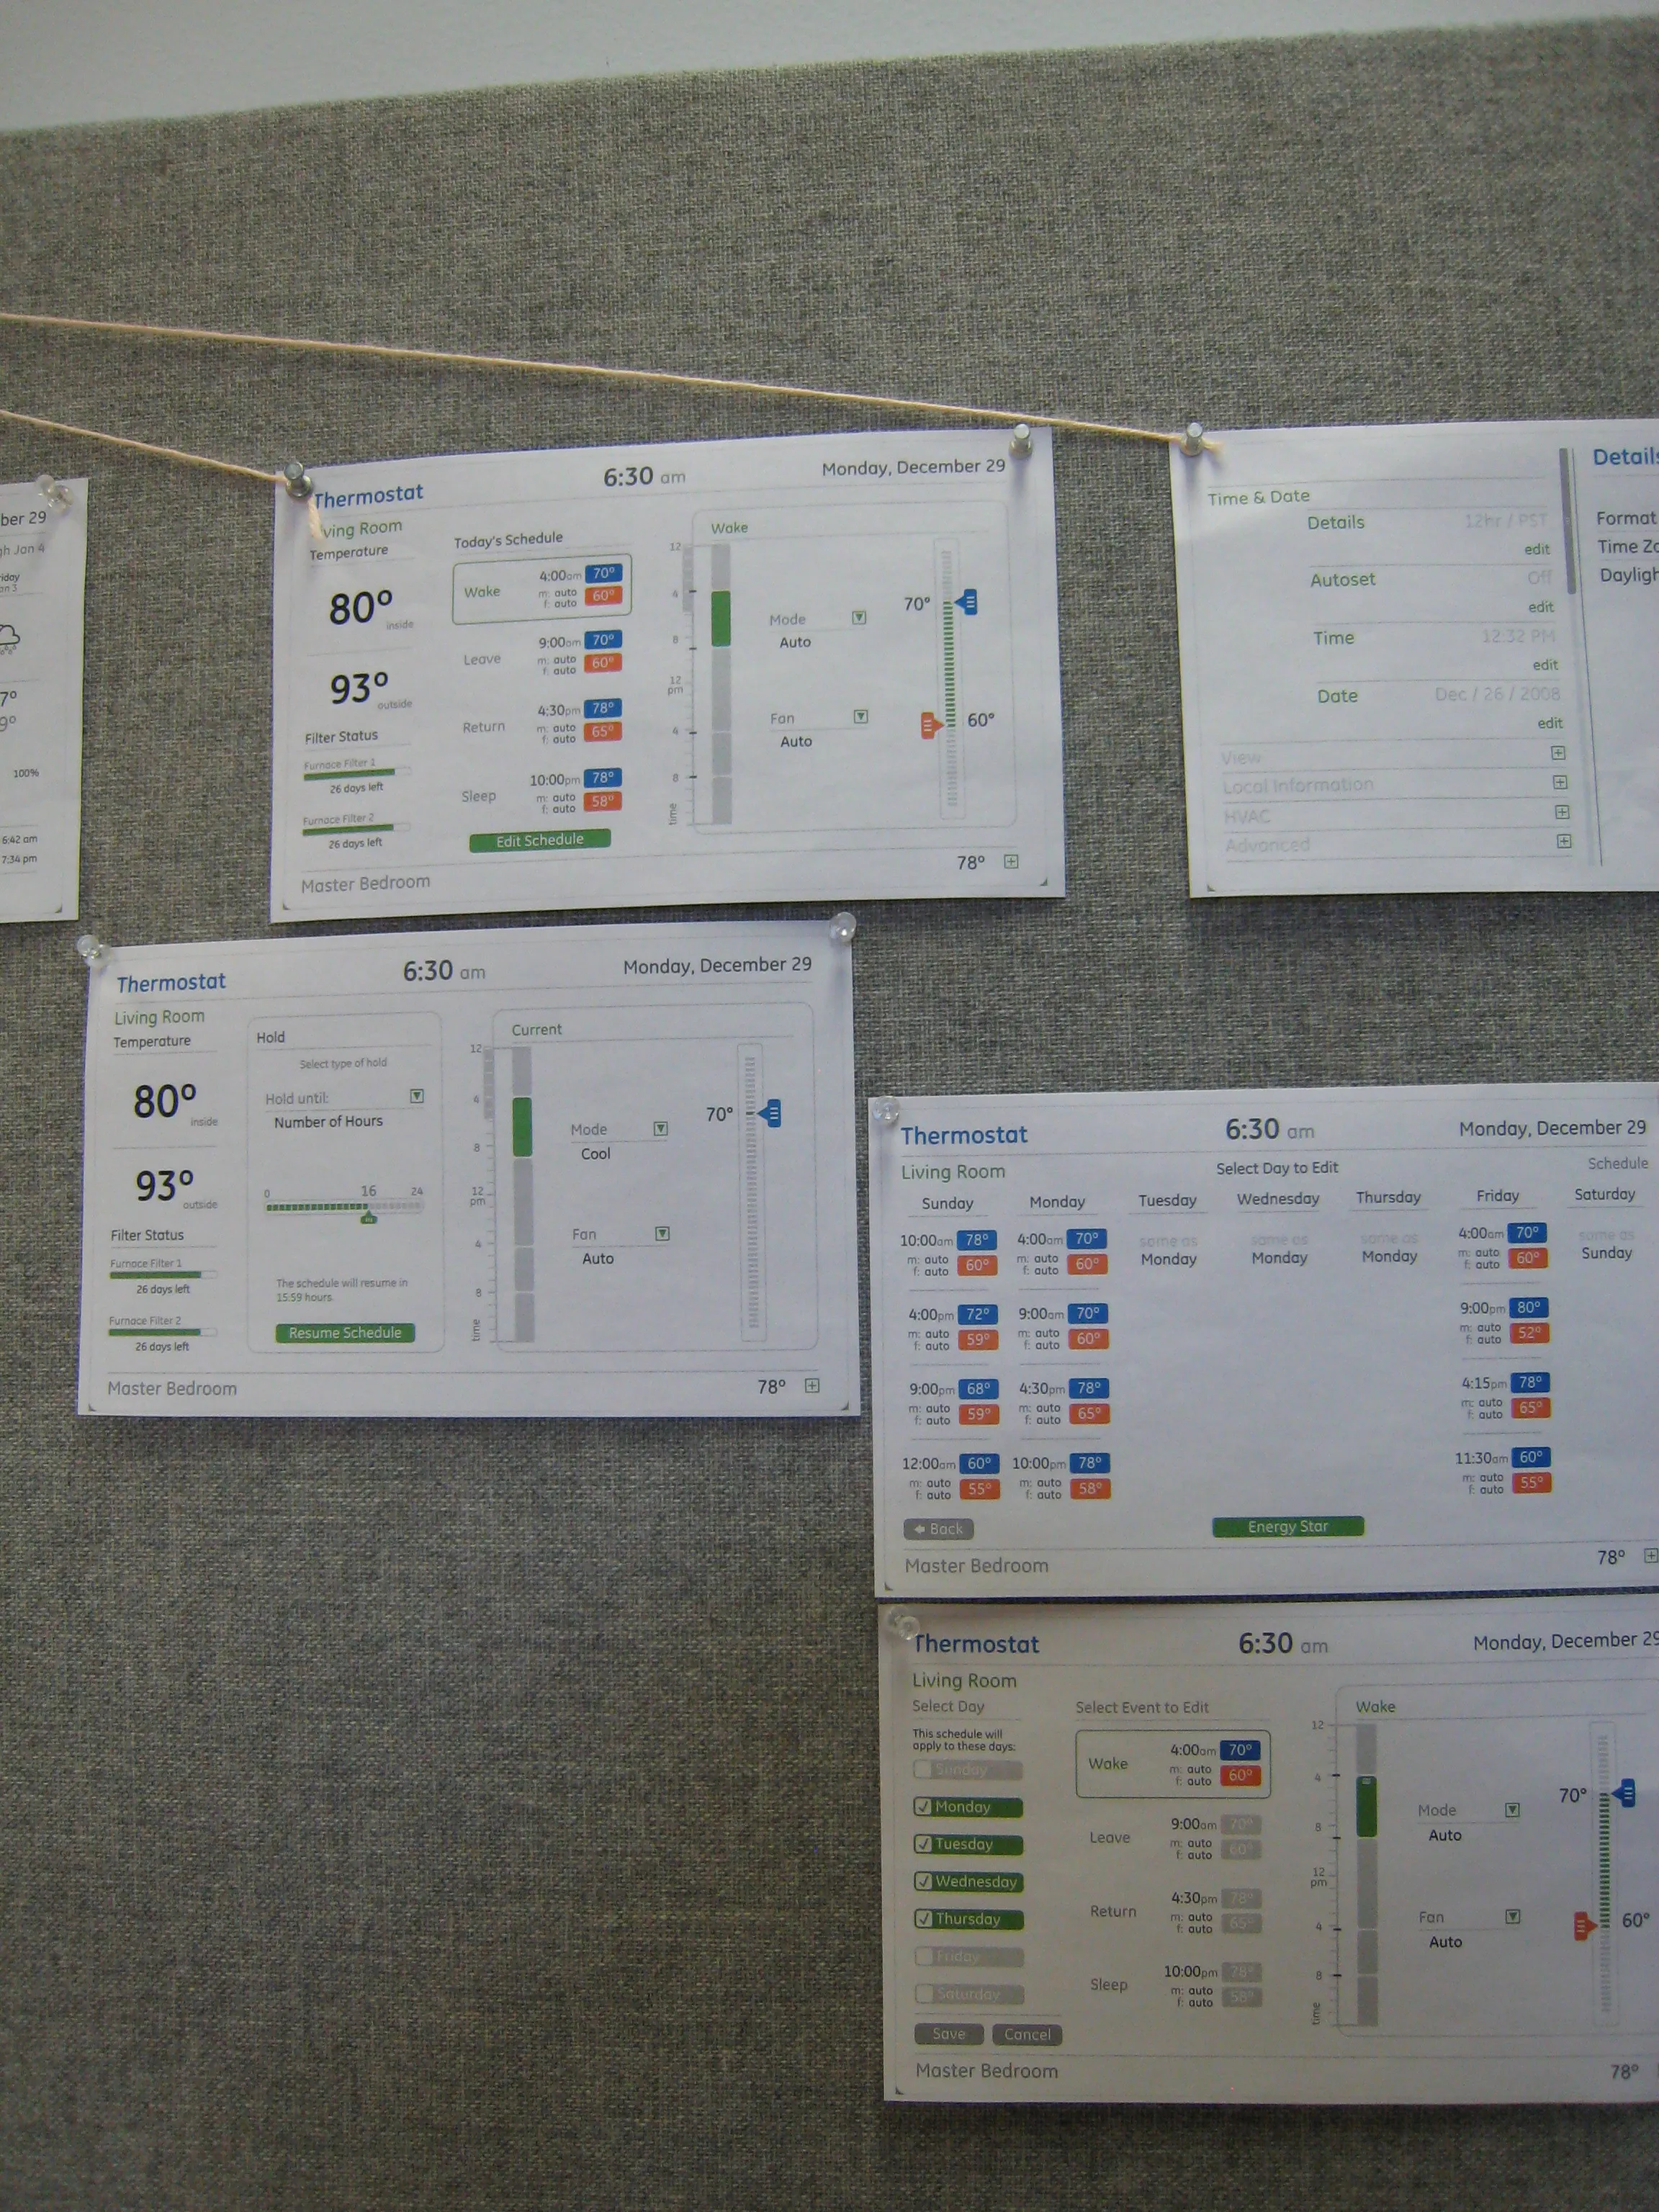
True-sized images of the HEM touchscreen were printed out for feedback and evaluation.
The menu map I drew for the Home Energy Manager's touchscreen in October 2009, for the Masdar City version: the summary screens, resources by energy, water and cooling from yearly to daily, history, appliances with demand response settings, weather and the thermostat.
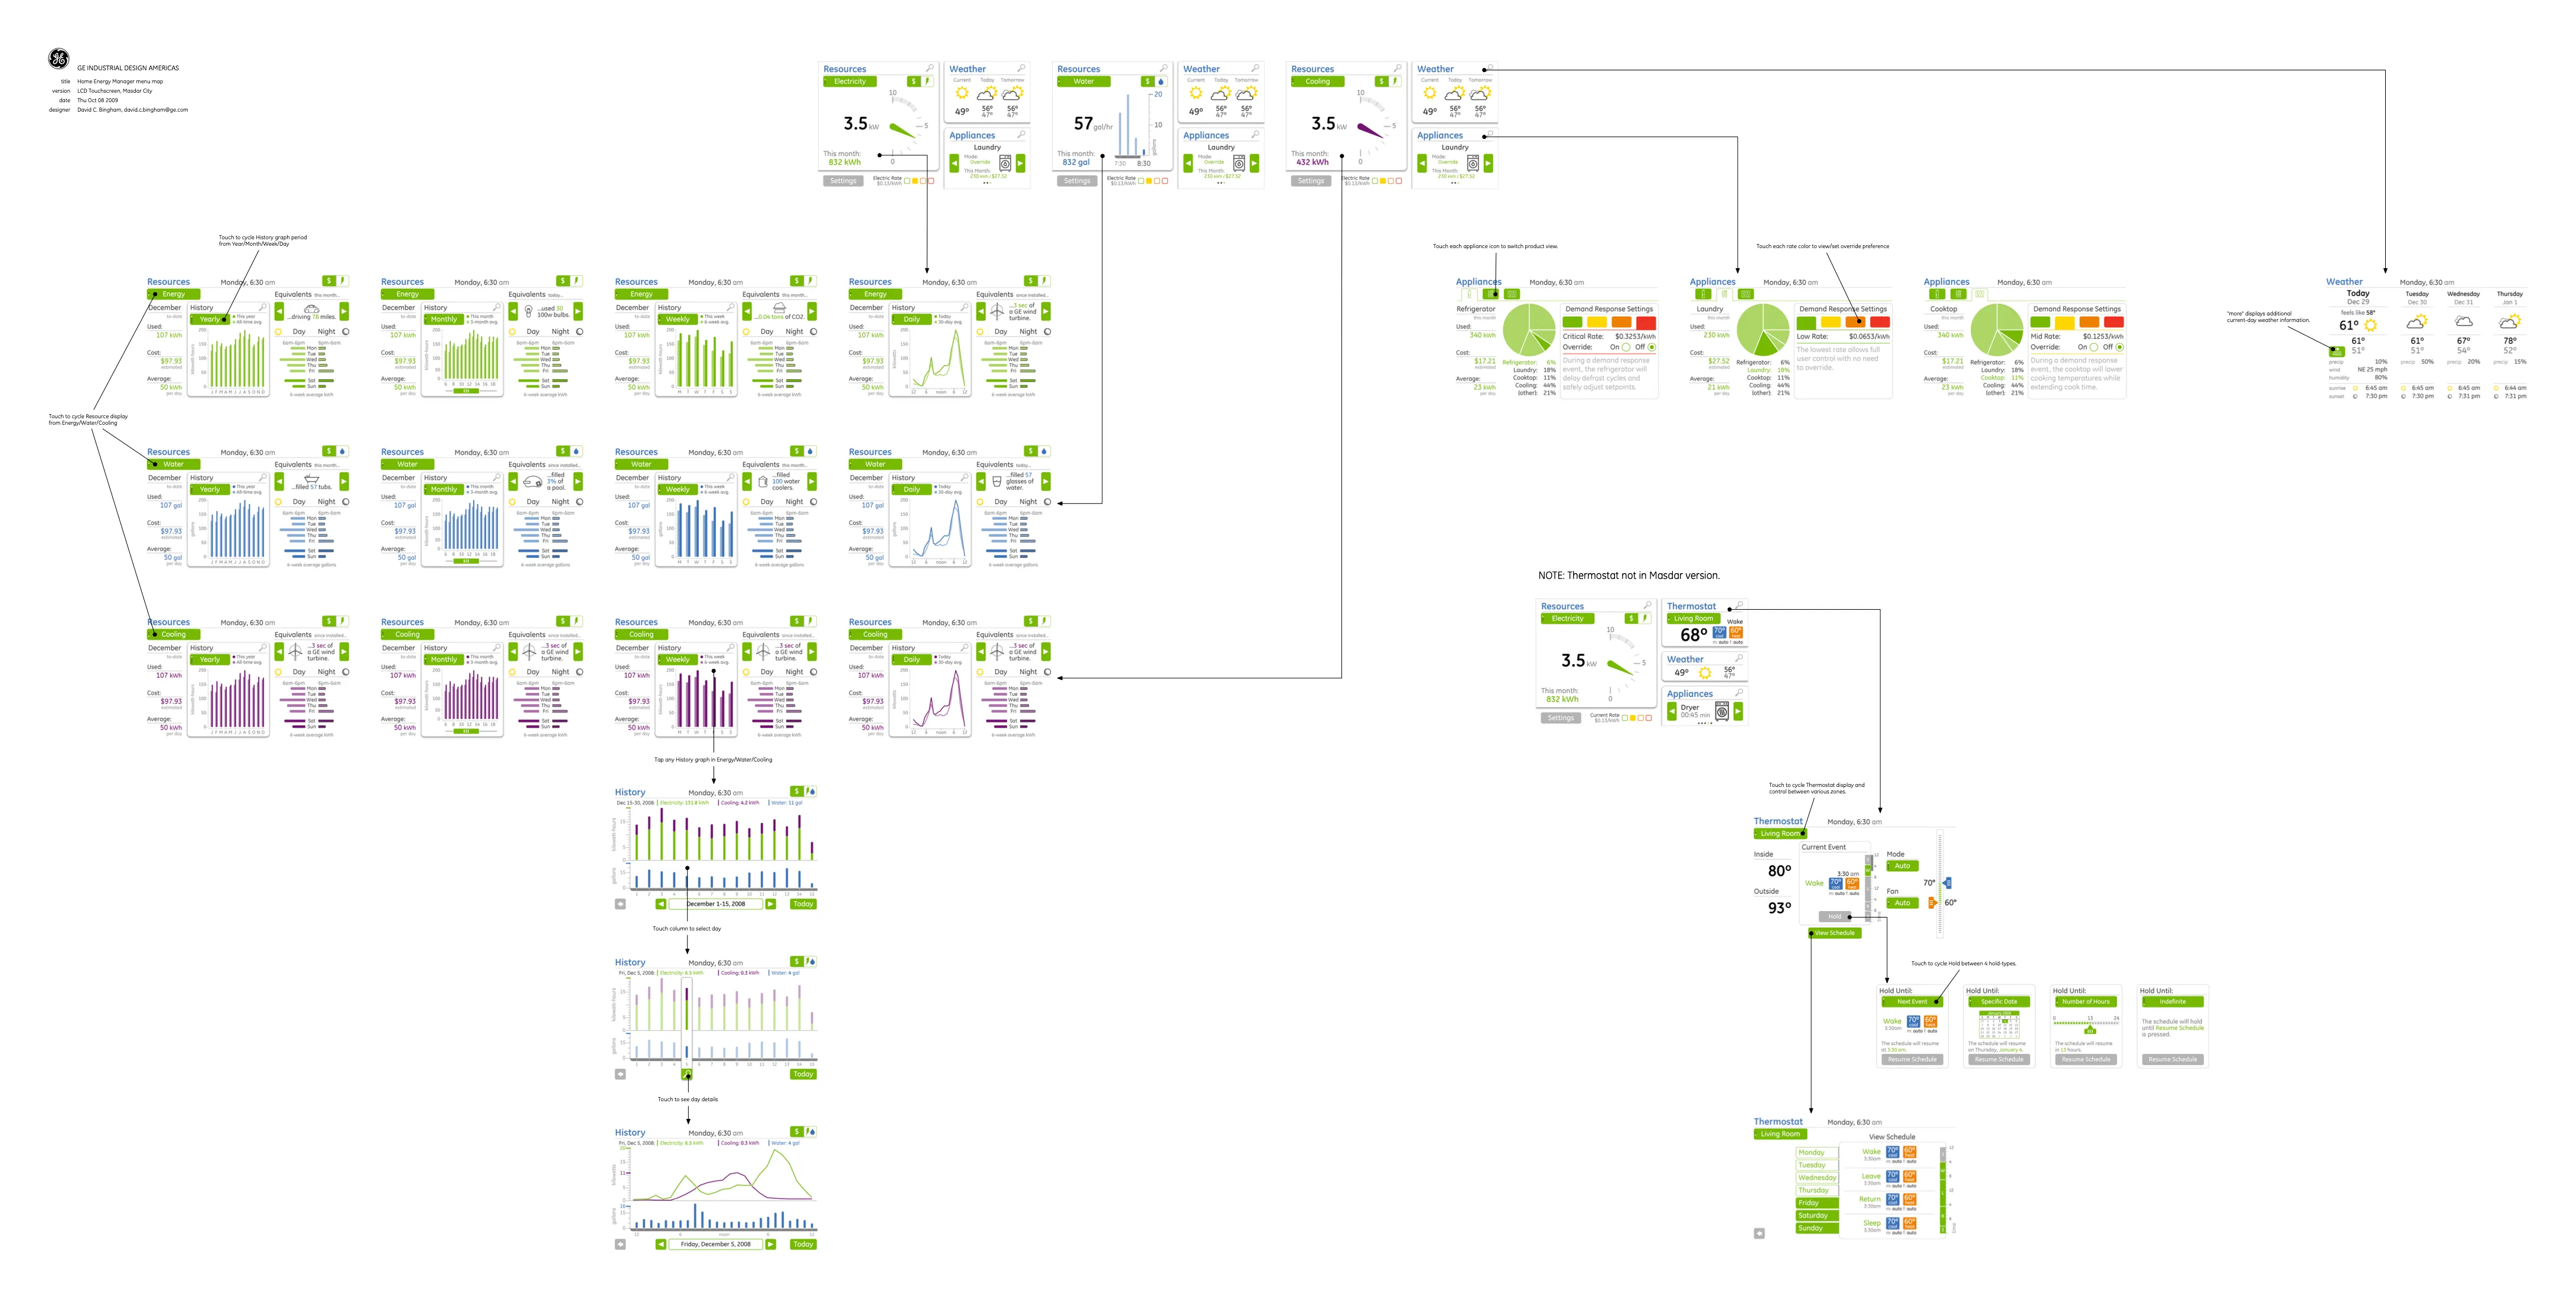
What became of the Home Energy Manager, as a record: the utility pilot in Louisville, its public debut in July 2009, the Masdar City field test, the small run built for pilots and prototyping, and four patent filings.
From late 2008 · Louisville Gas & Electric
Utility pilot in Louisville
GE employees in Louisville lived with demand response appliances, a smart meter, tiered pricing and an in-home energy monitor on the kitchen counter. Six months in, participants reported savings of up to 20 percent, and most “liked the control” of using their appliances when they needed them; the dishwasher and laundry were the hardest to shift. One of them: “Watching that meter has driven behavior changes in my house that have resulted in reduced energy consumption.”
July 2009 · GE Global Research
Public debut
GE introduced the Home Energy Manager at its smart grid symposium as “the central nervous system for the Net Zero Energy Home”, due “as early as 2010” and, in its own note, dependent on utility participation. CleanTechnica and phys.org carried the story.
October 2009 · Masdar and GE
Field test in Masdar City
Ten of the Masdar Institute’s 100 residences took a Home Energy Manager and European-size demand response appliances for a two-year pilot, GE’s first outside the US, built for the purpose. Its stated aim was early feedback on how residents use energy when the grid can ask them to wait. Masdar’s CEO, Dr. Sultan Al Jaber, called it “a significant milestone” toward the city as “a unique metropolitan-scale test bed for these new technologies.”
2009 – 2010 · GE Appliances
Pilots and prototypes
A small quantity were produced for utility pilots and development team prototyping.
Filed 2009 – 2010 · US patents
Four patent filings
The home energy manager system, a critical peak pricing audio alert, the screensaver and water leak detection.
v3 Energy Display
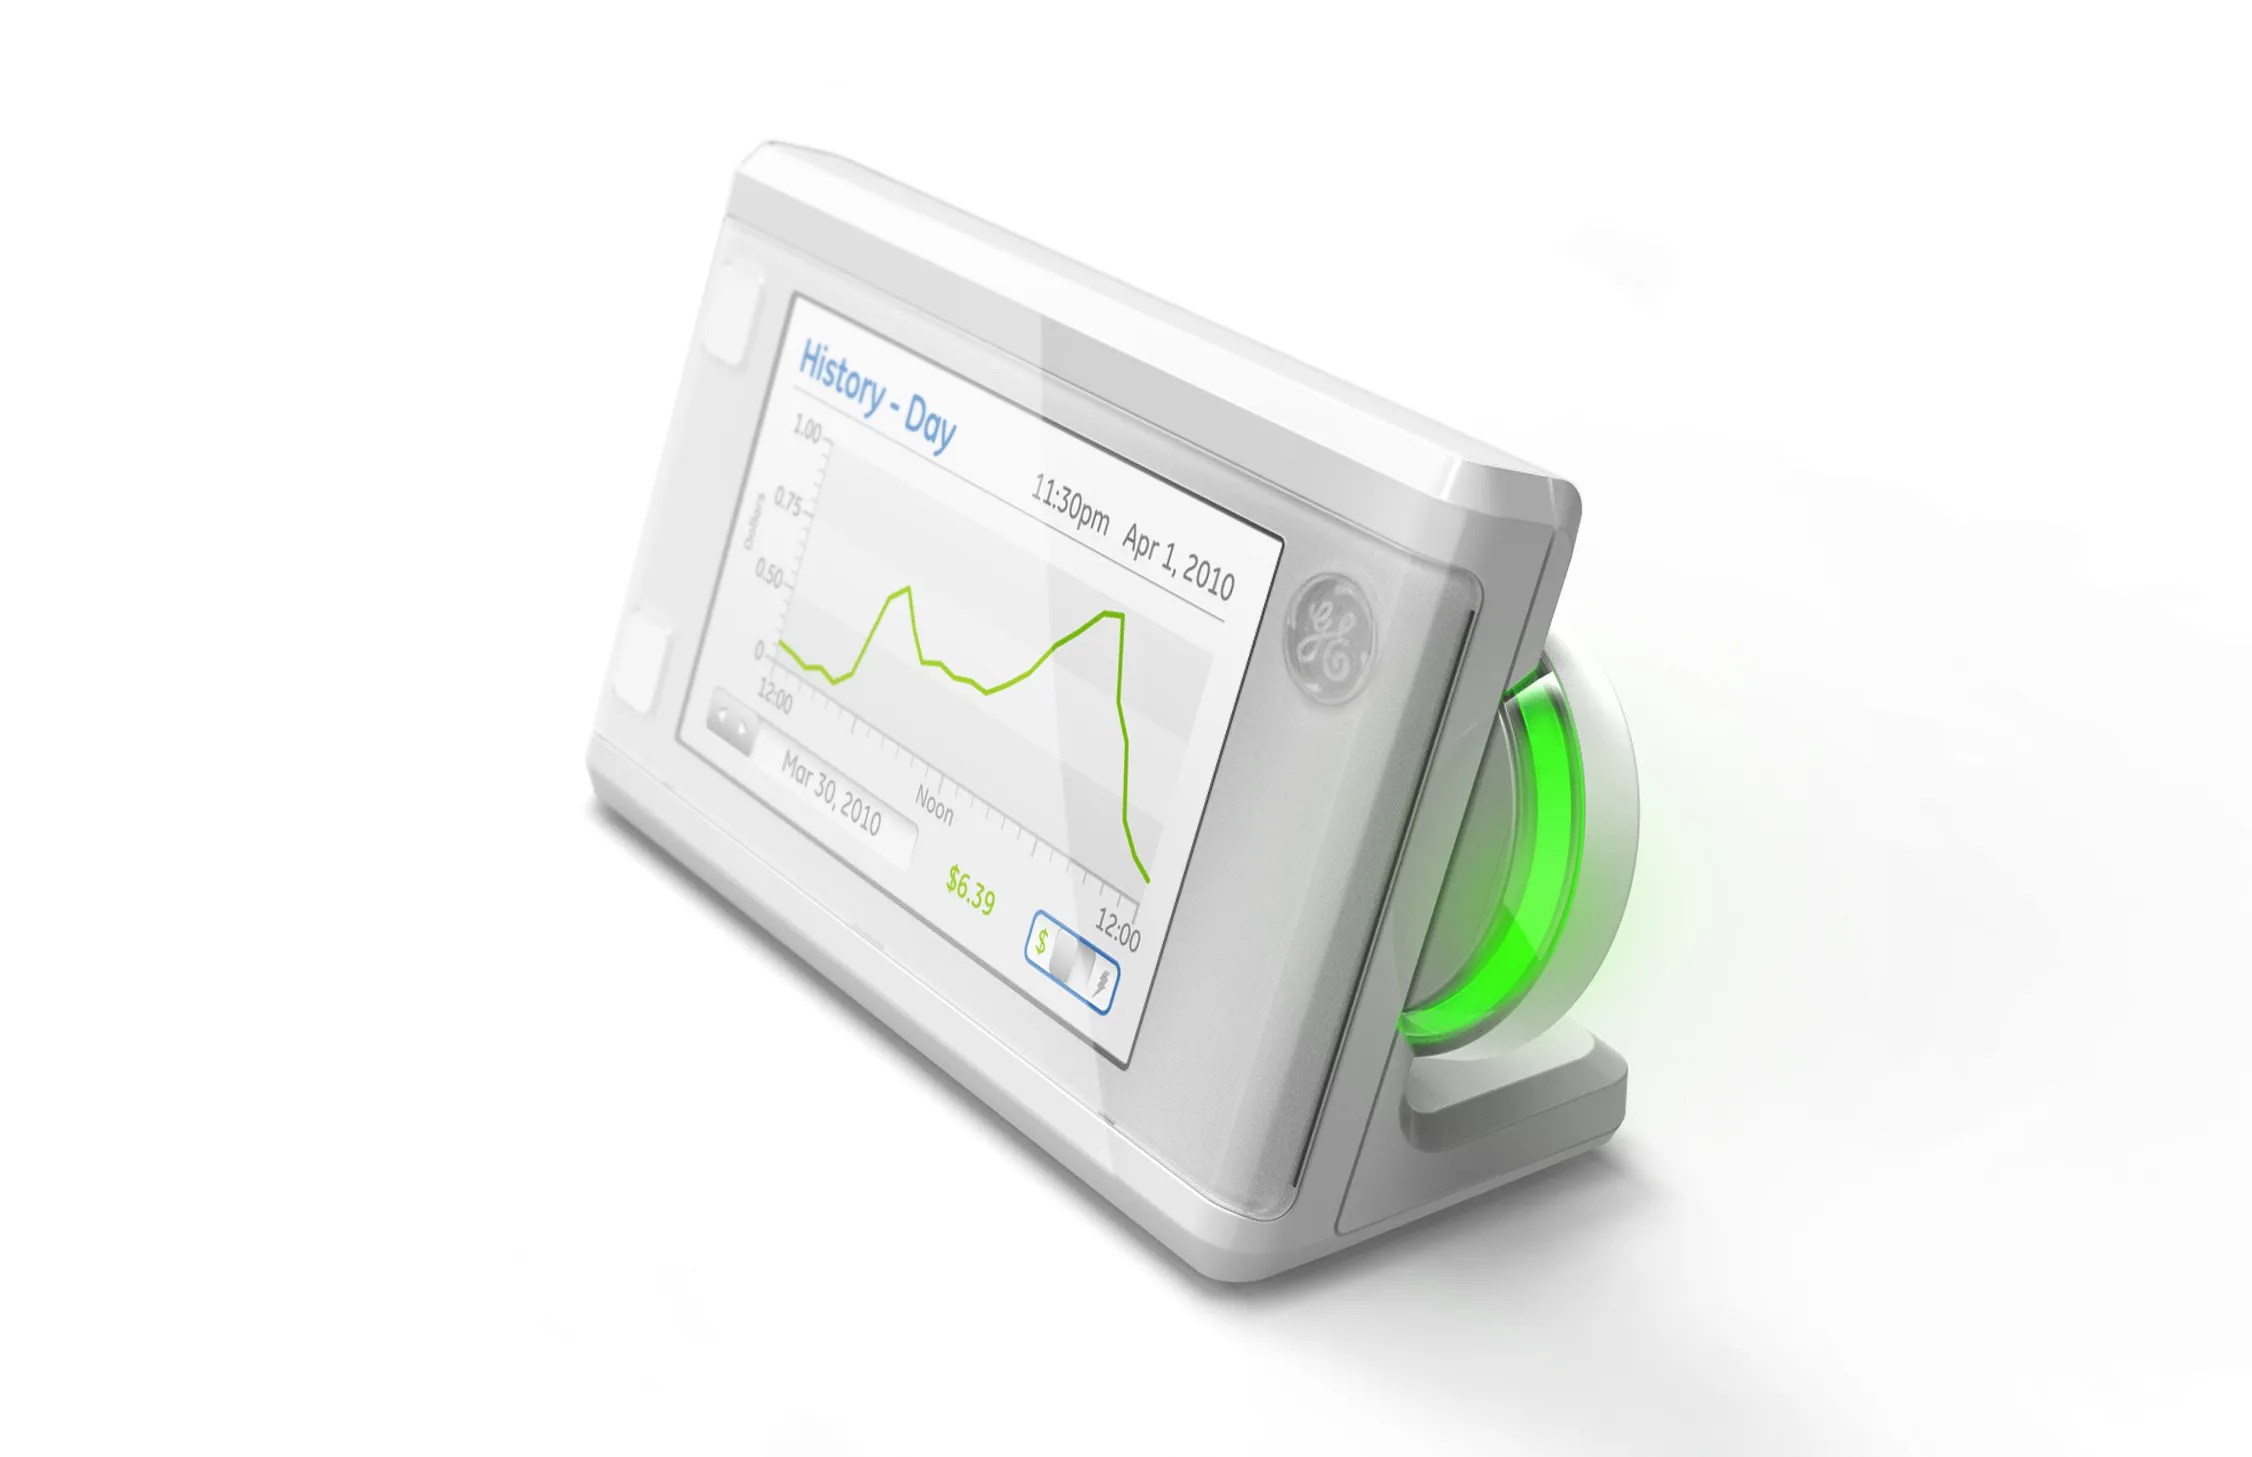
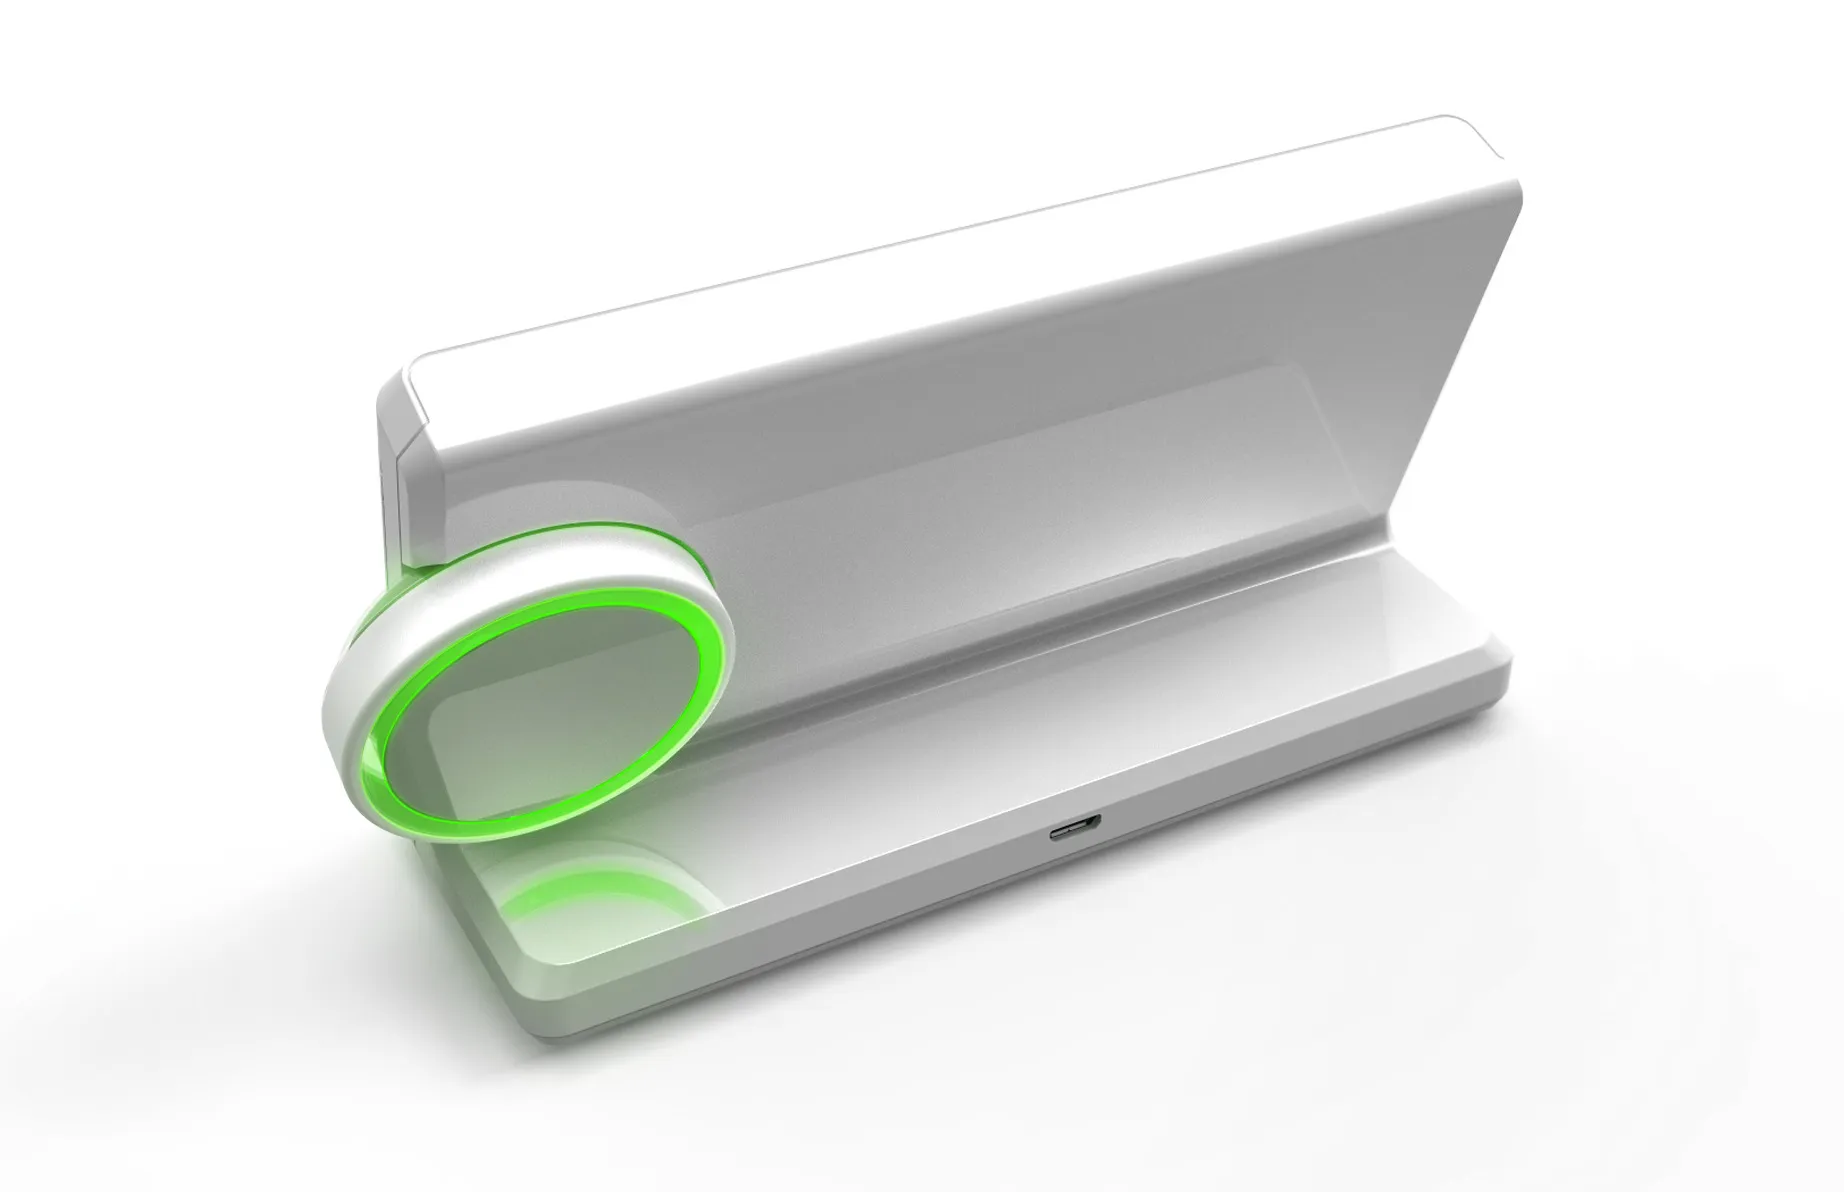
The stand-alone energy display, held in the hand while it pairs with a smart meter, and from behind with its knob ring lit. It came out of the utility pilots, and the dial, two buttons and coloured lighting are what remained after many concepts and research sessions.
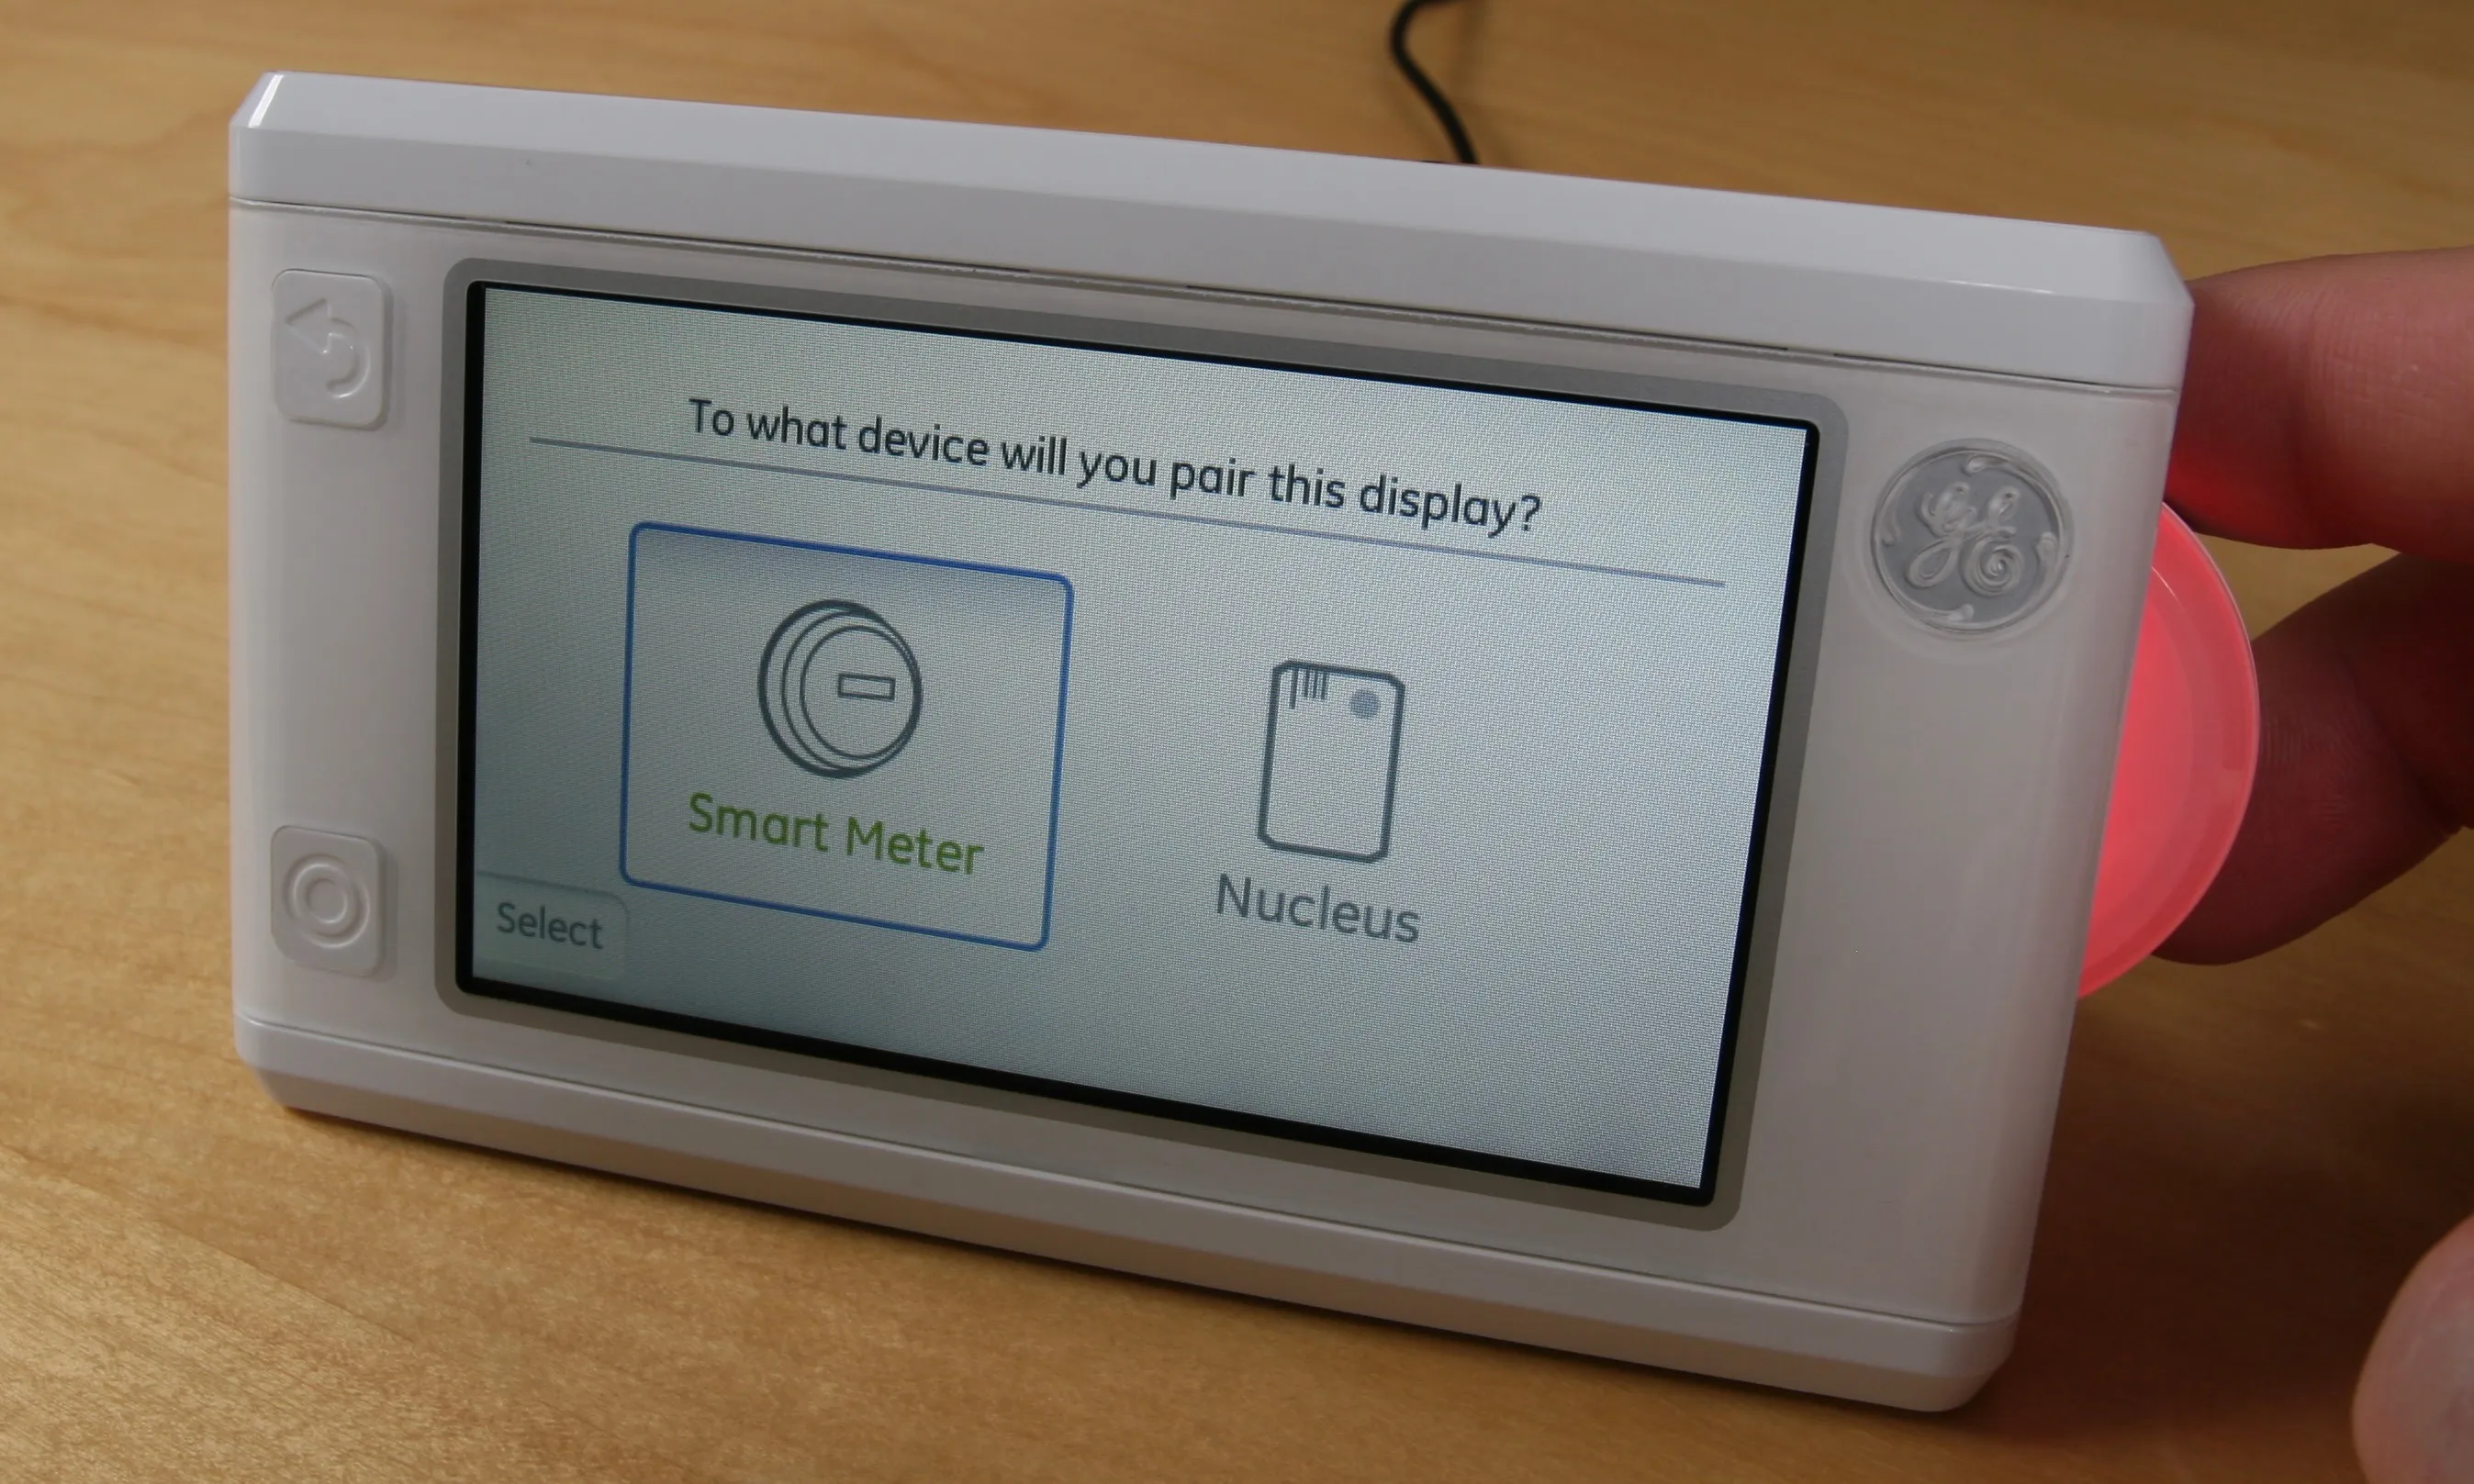
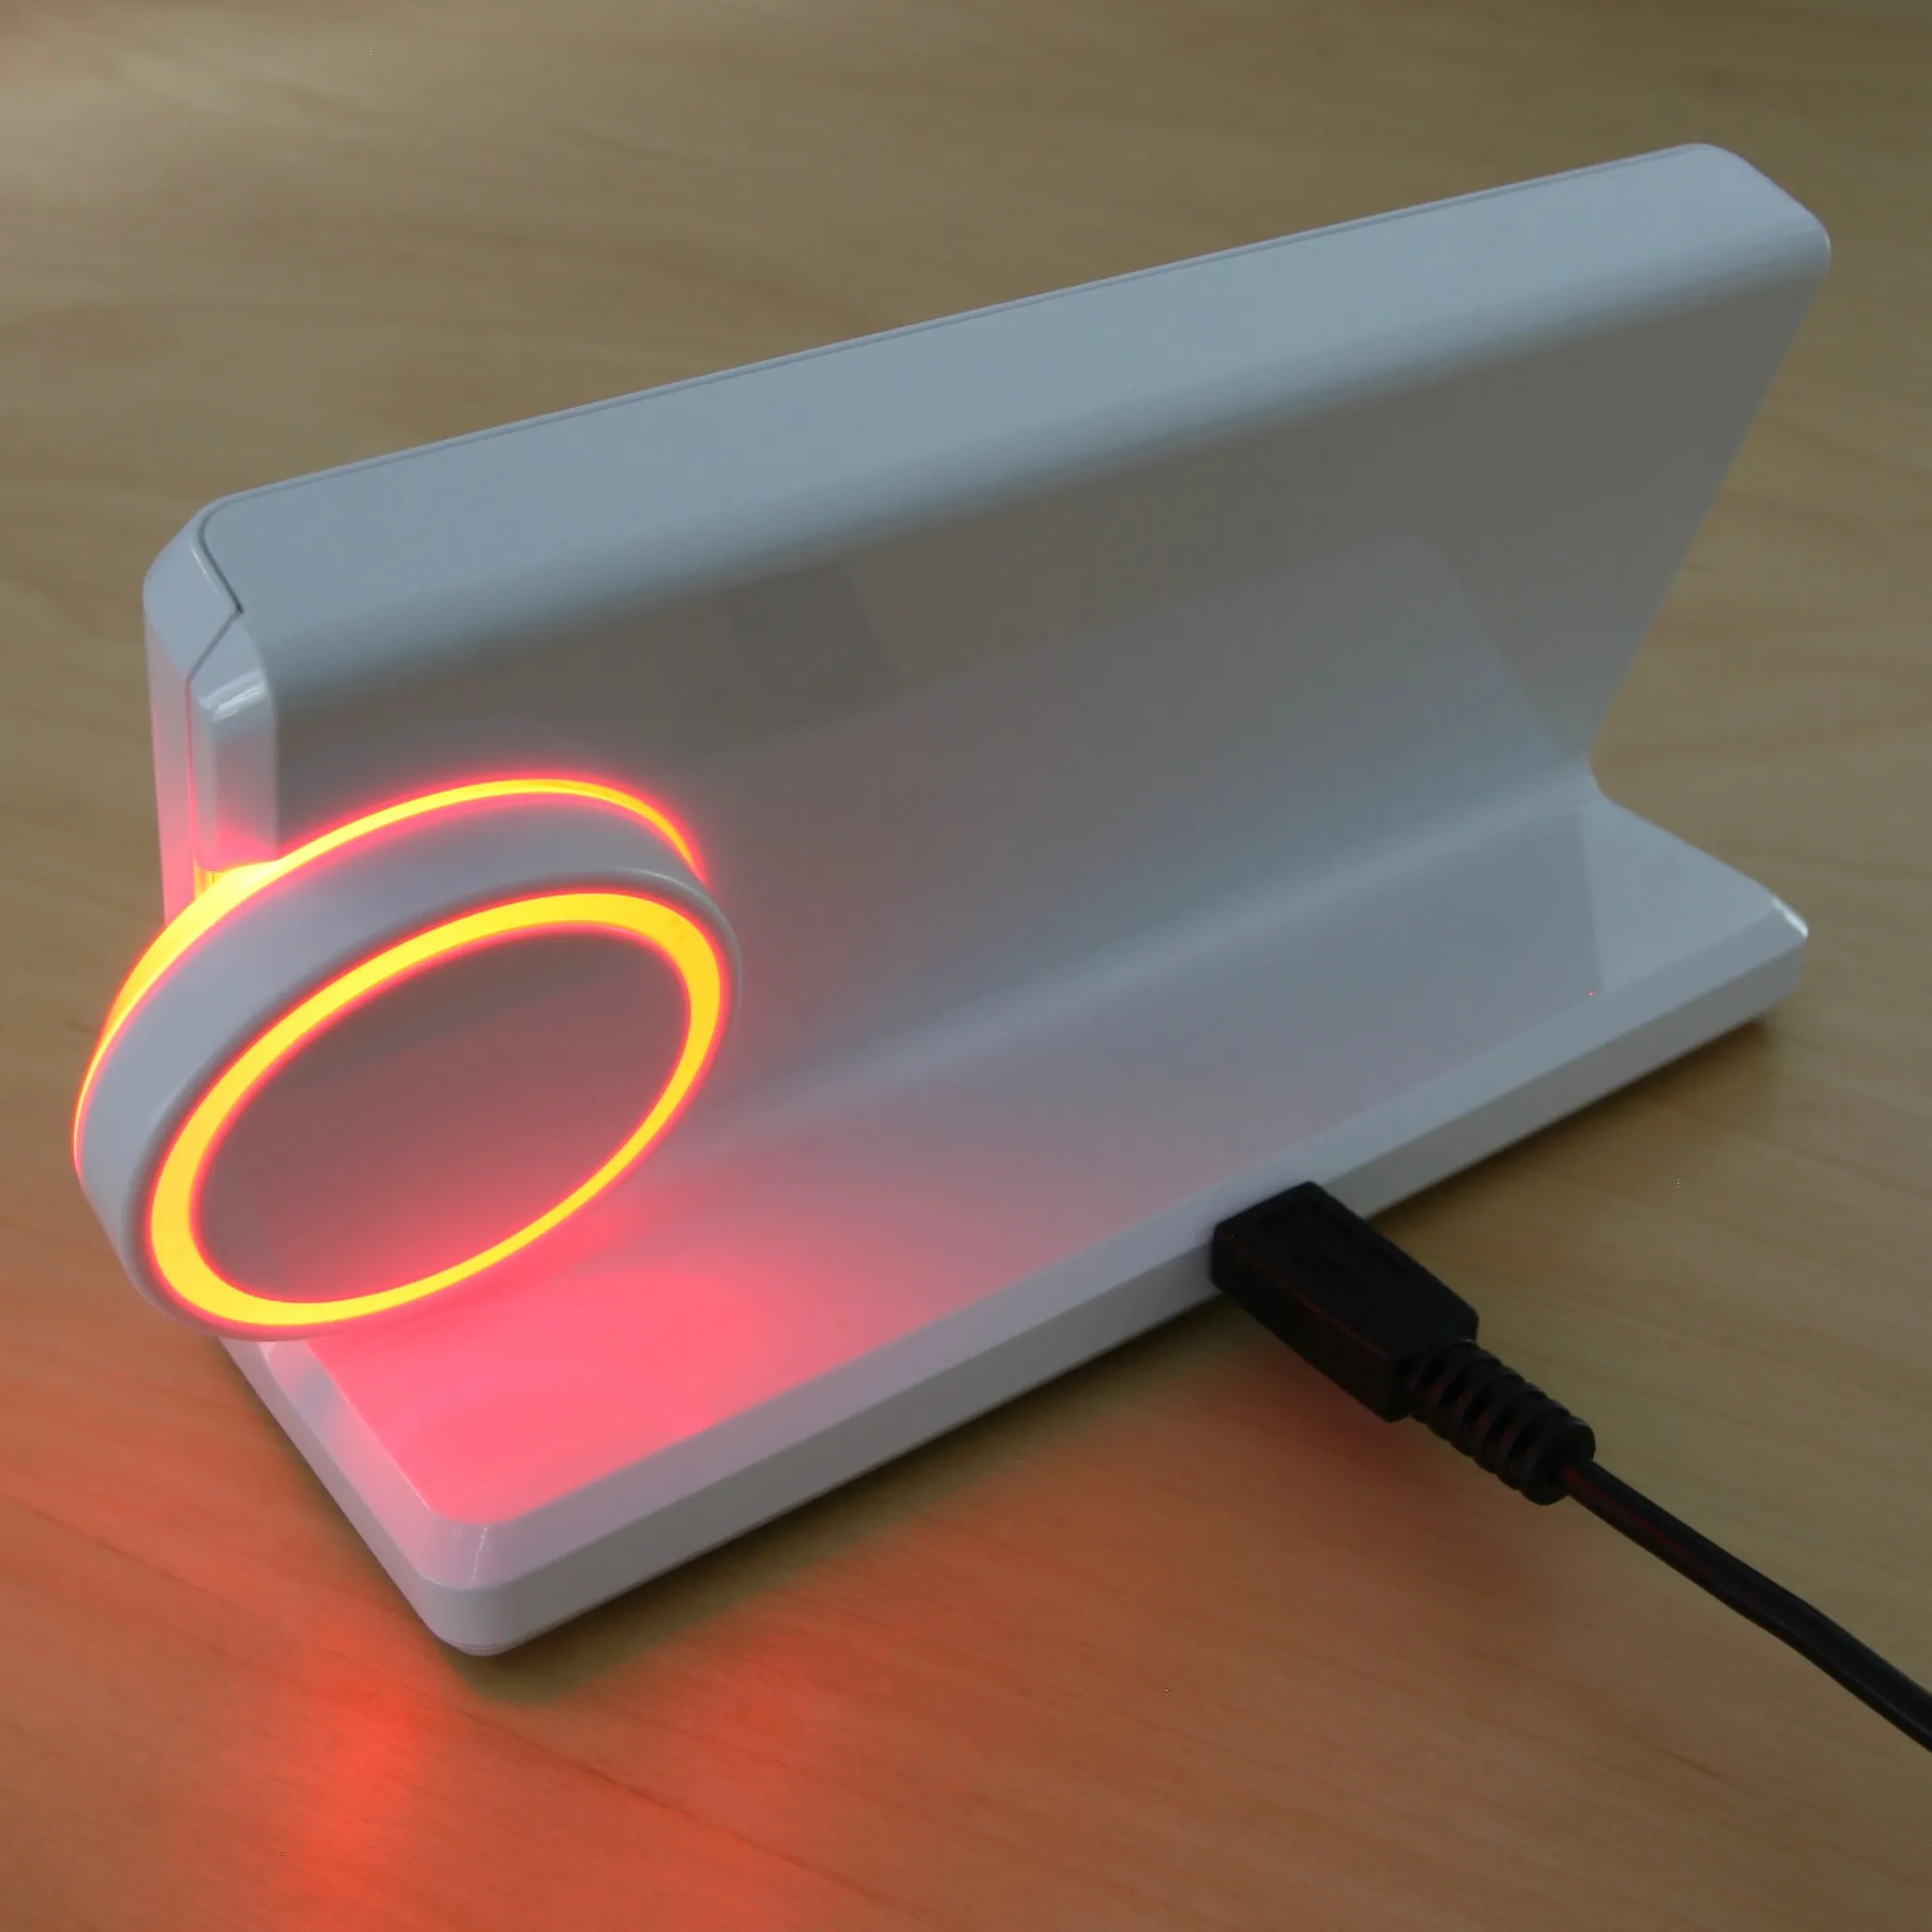
In response to utility pilot projects, the energy display is a simple stand-alone product that receives information directly from the smart meter. Numerous design concepts and user research sessions led to a simple dial and two button navigation model with multi-color product lighting to communicate utility variable rates.
My March 2010 navigation sketch beside two views each of the first two case concepts. The sketch works out what rotating and pressing the dial does on every screen; the concepts give that dial a body, first as a knob at the side, then as two tactile buttons with the knob moved to the back.
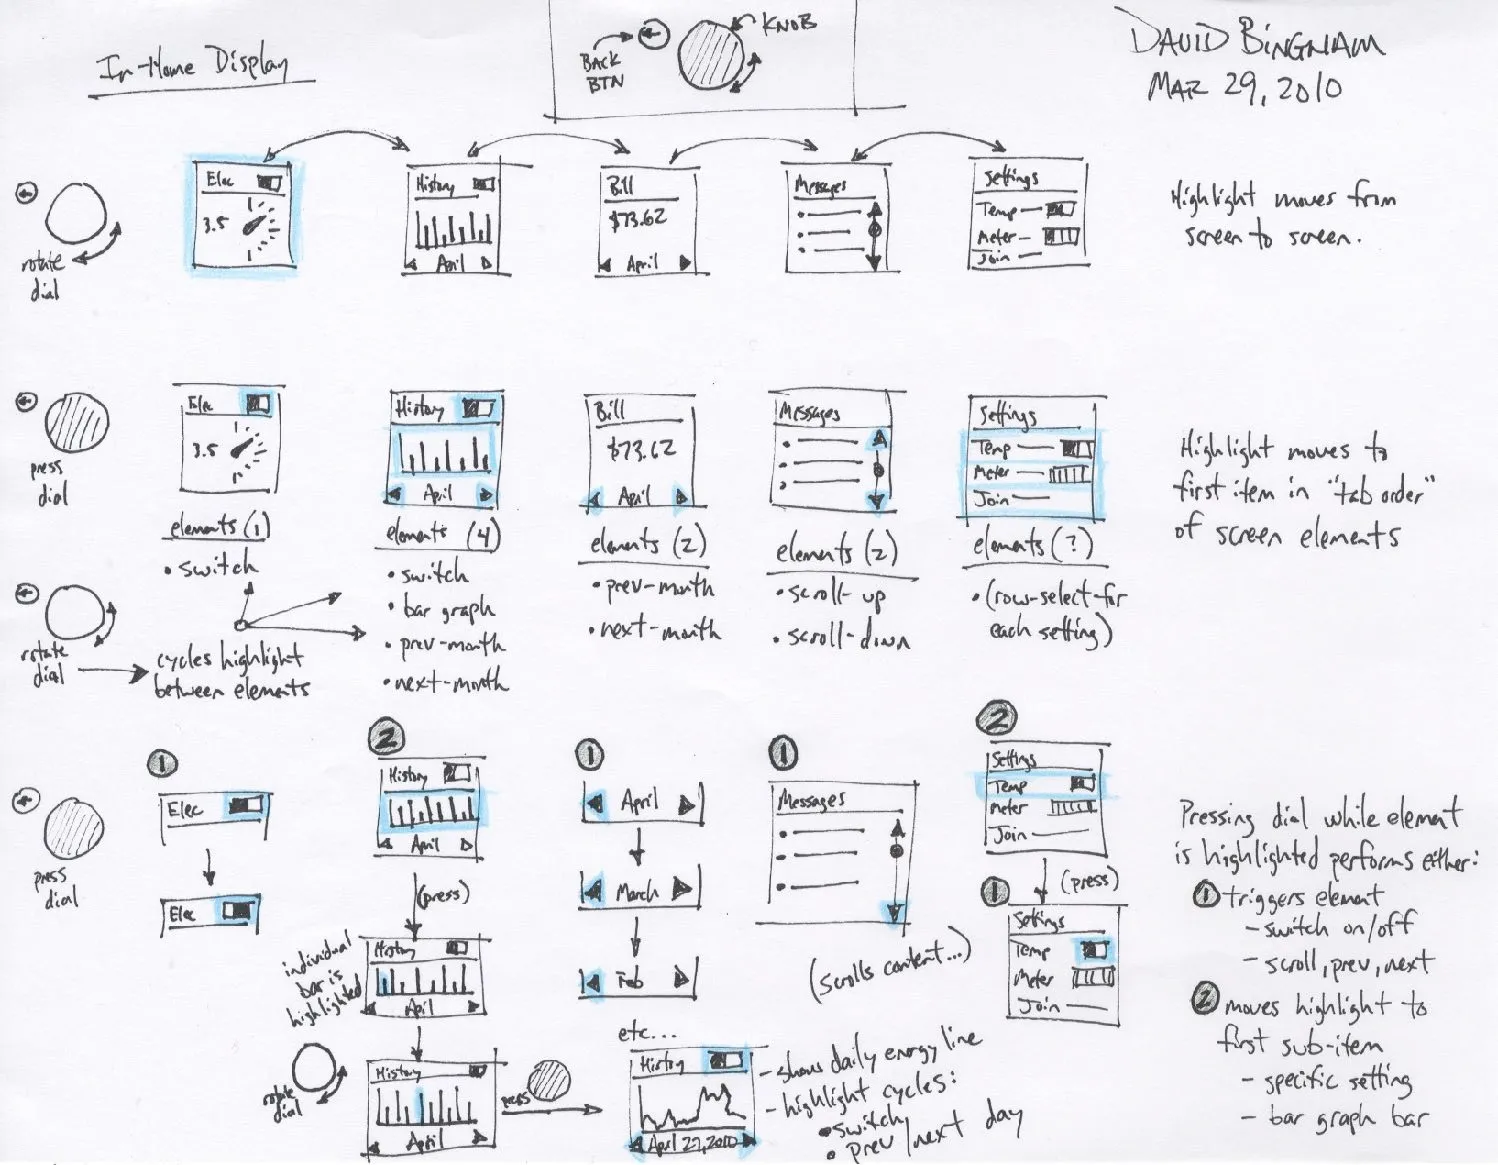
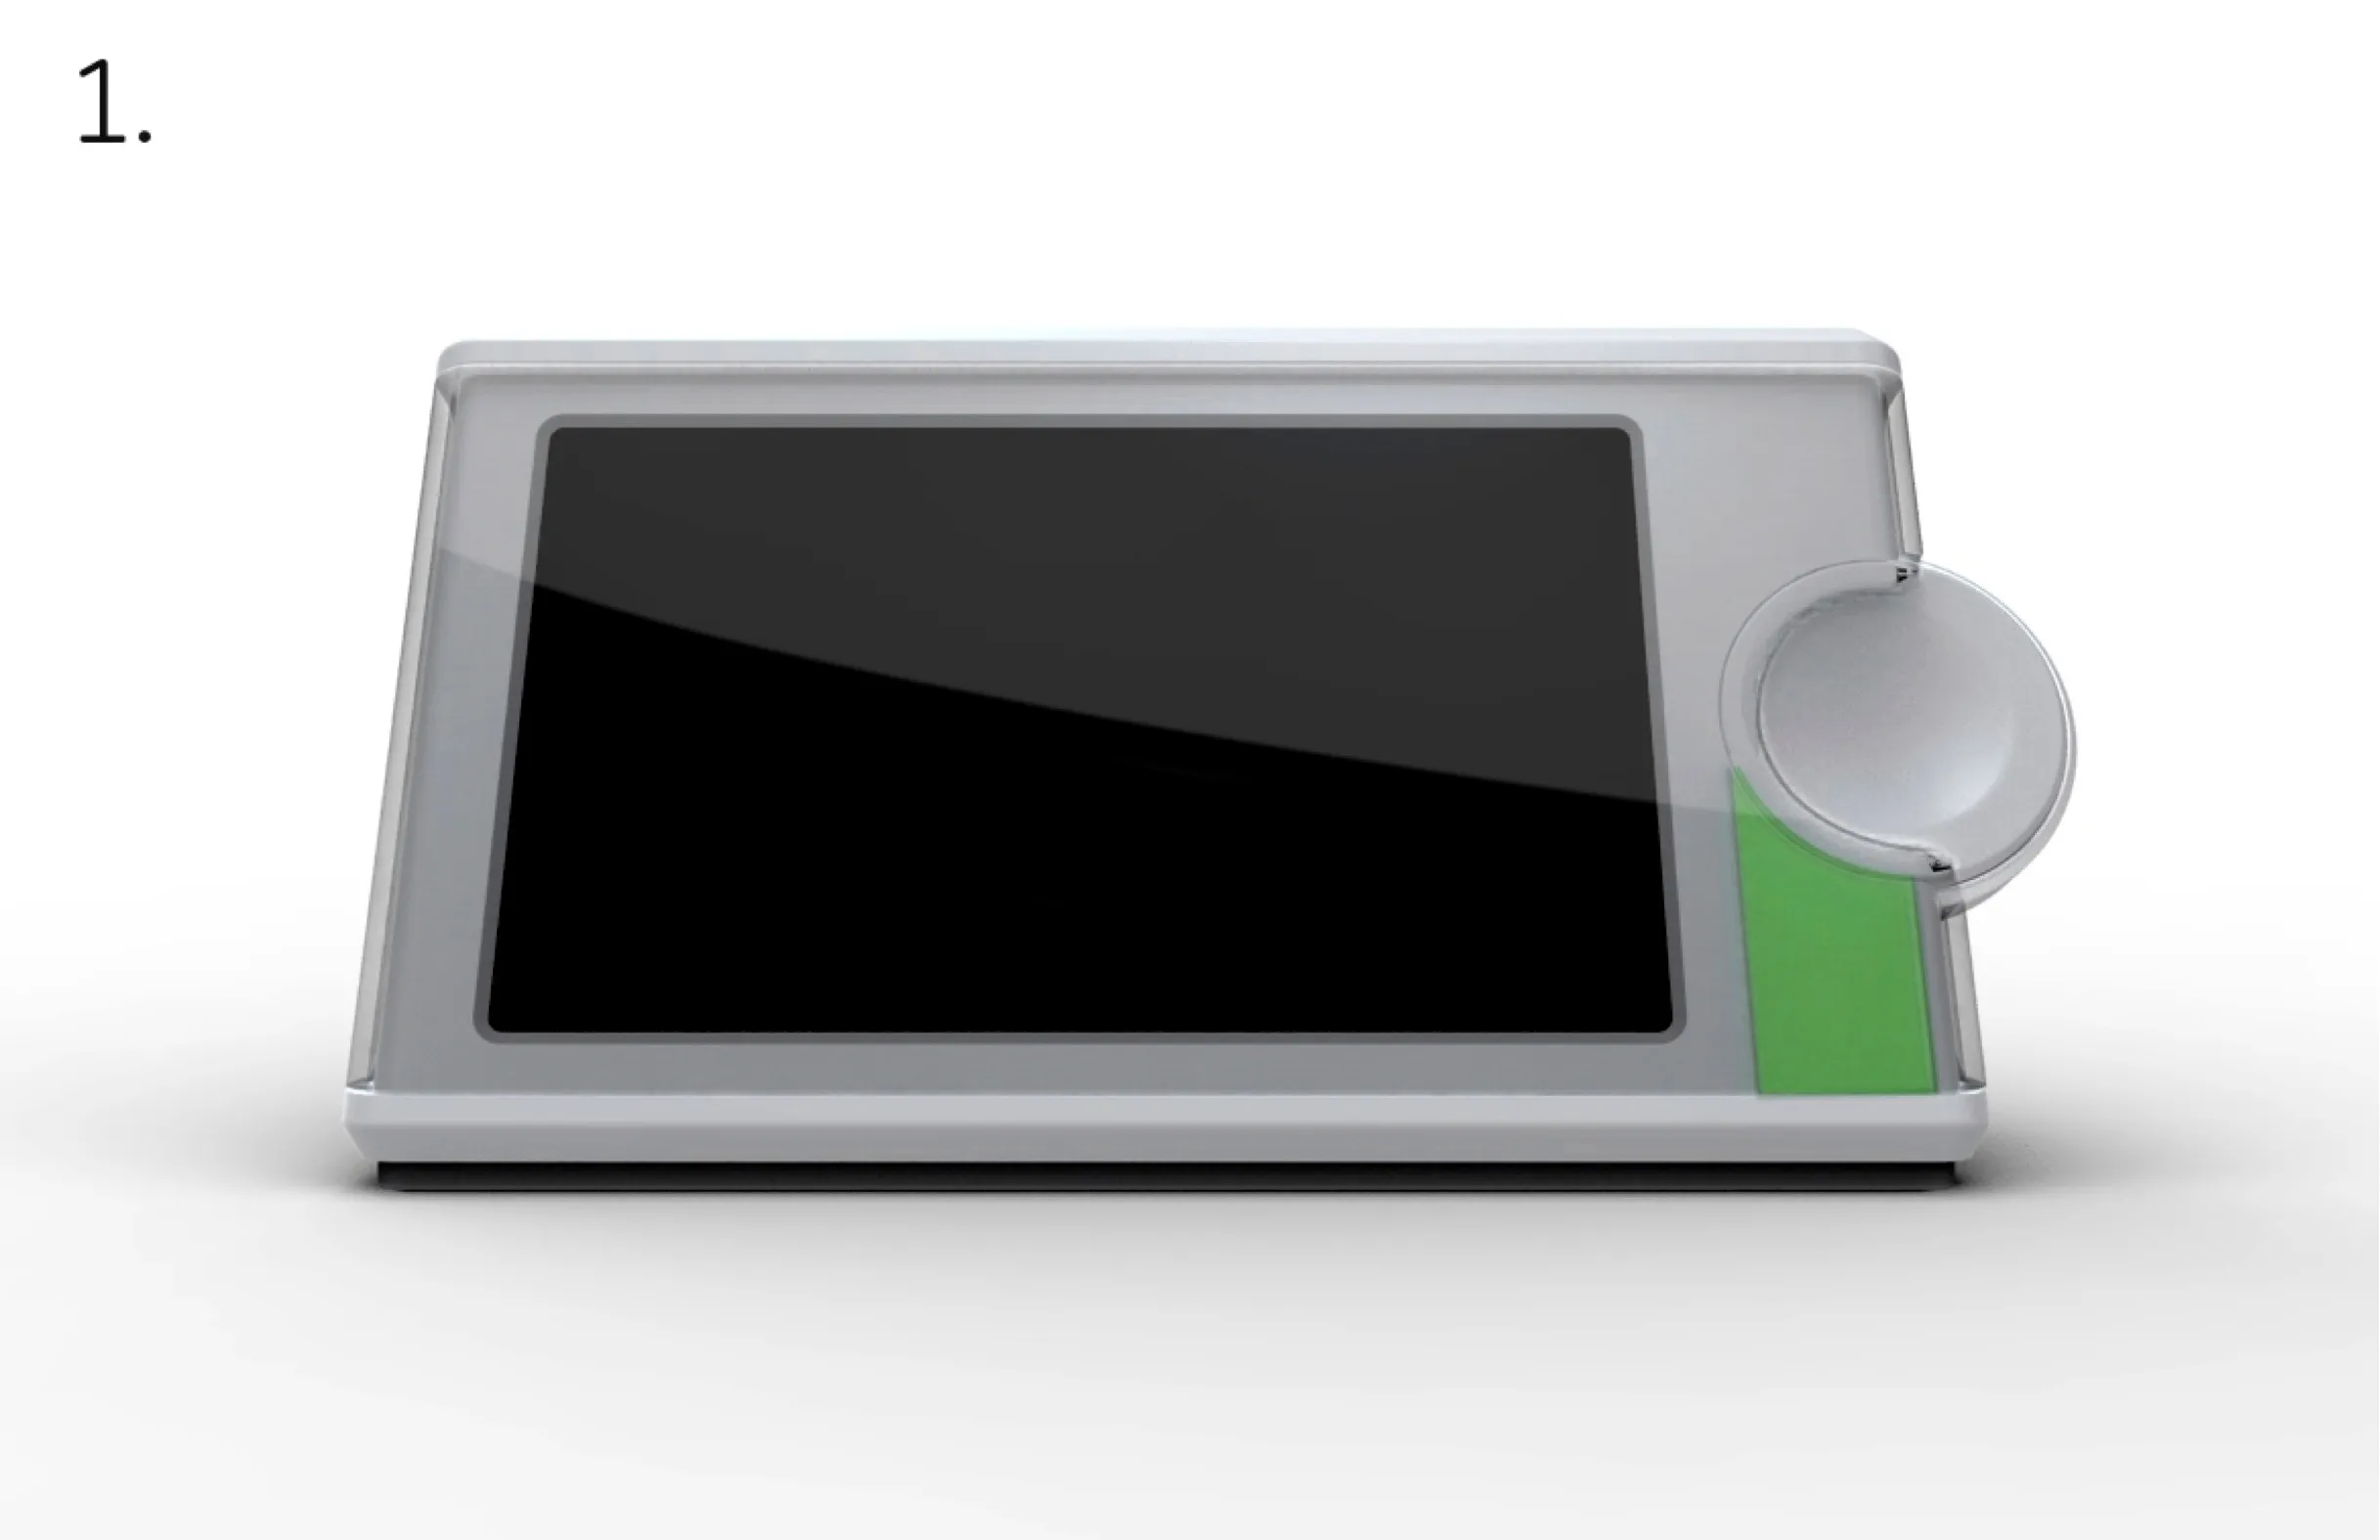
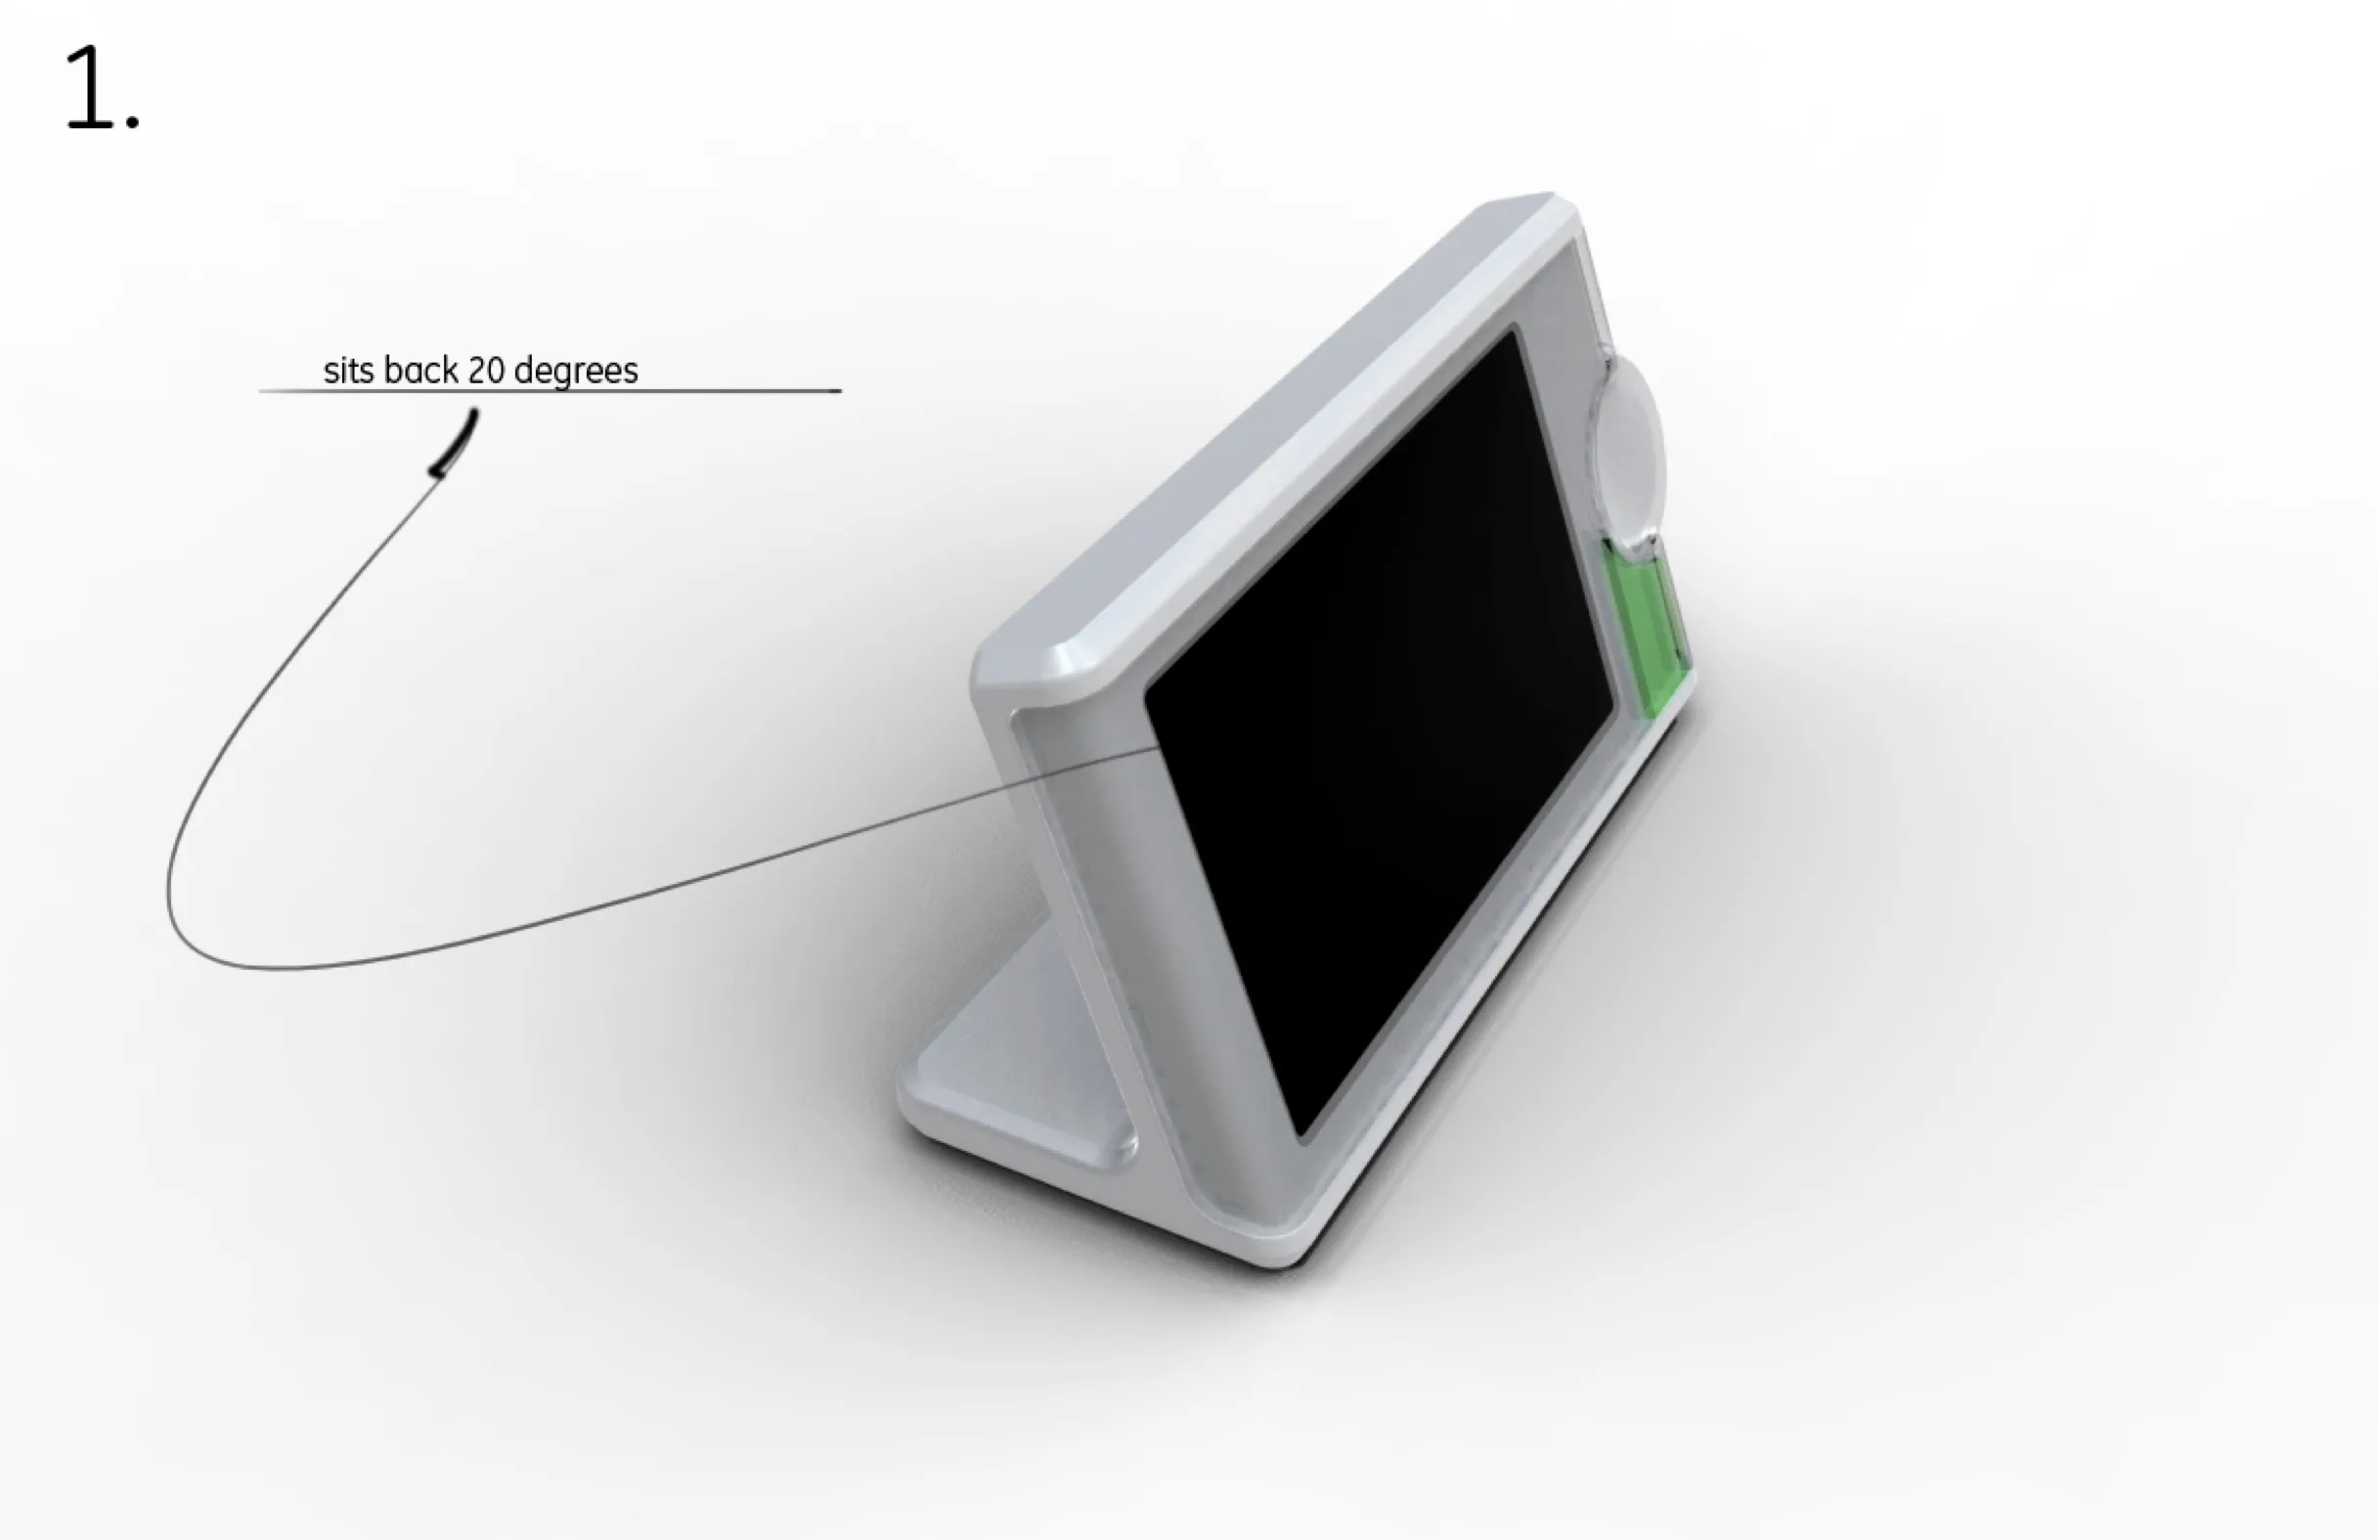
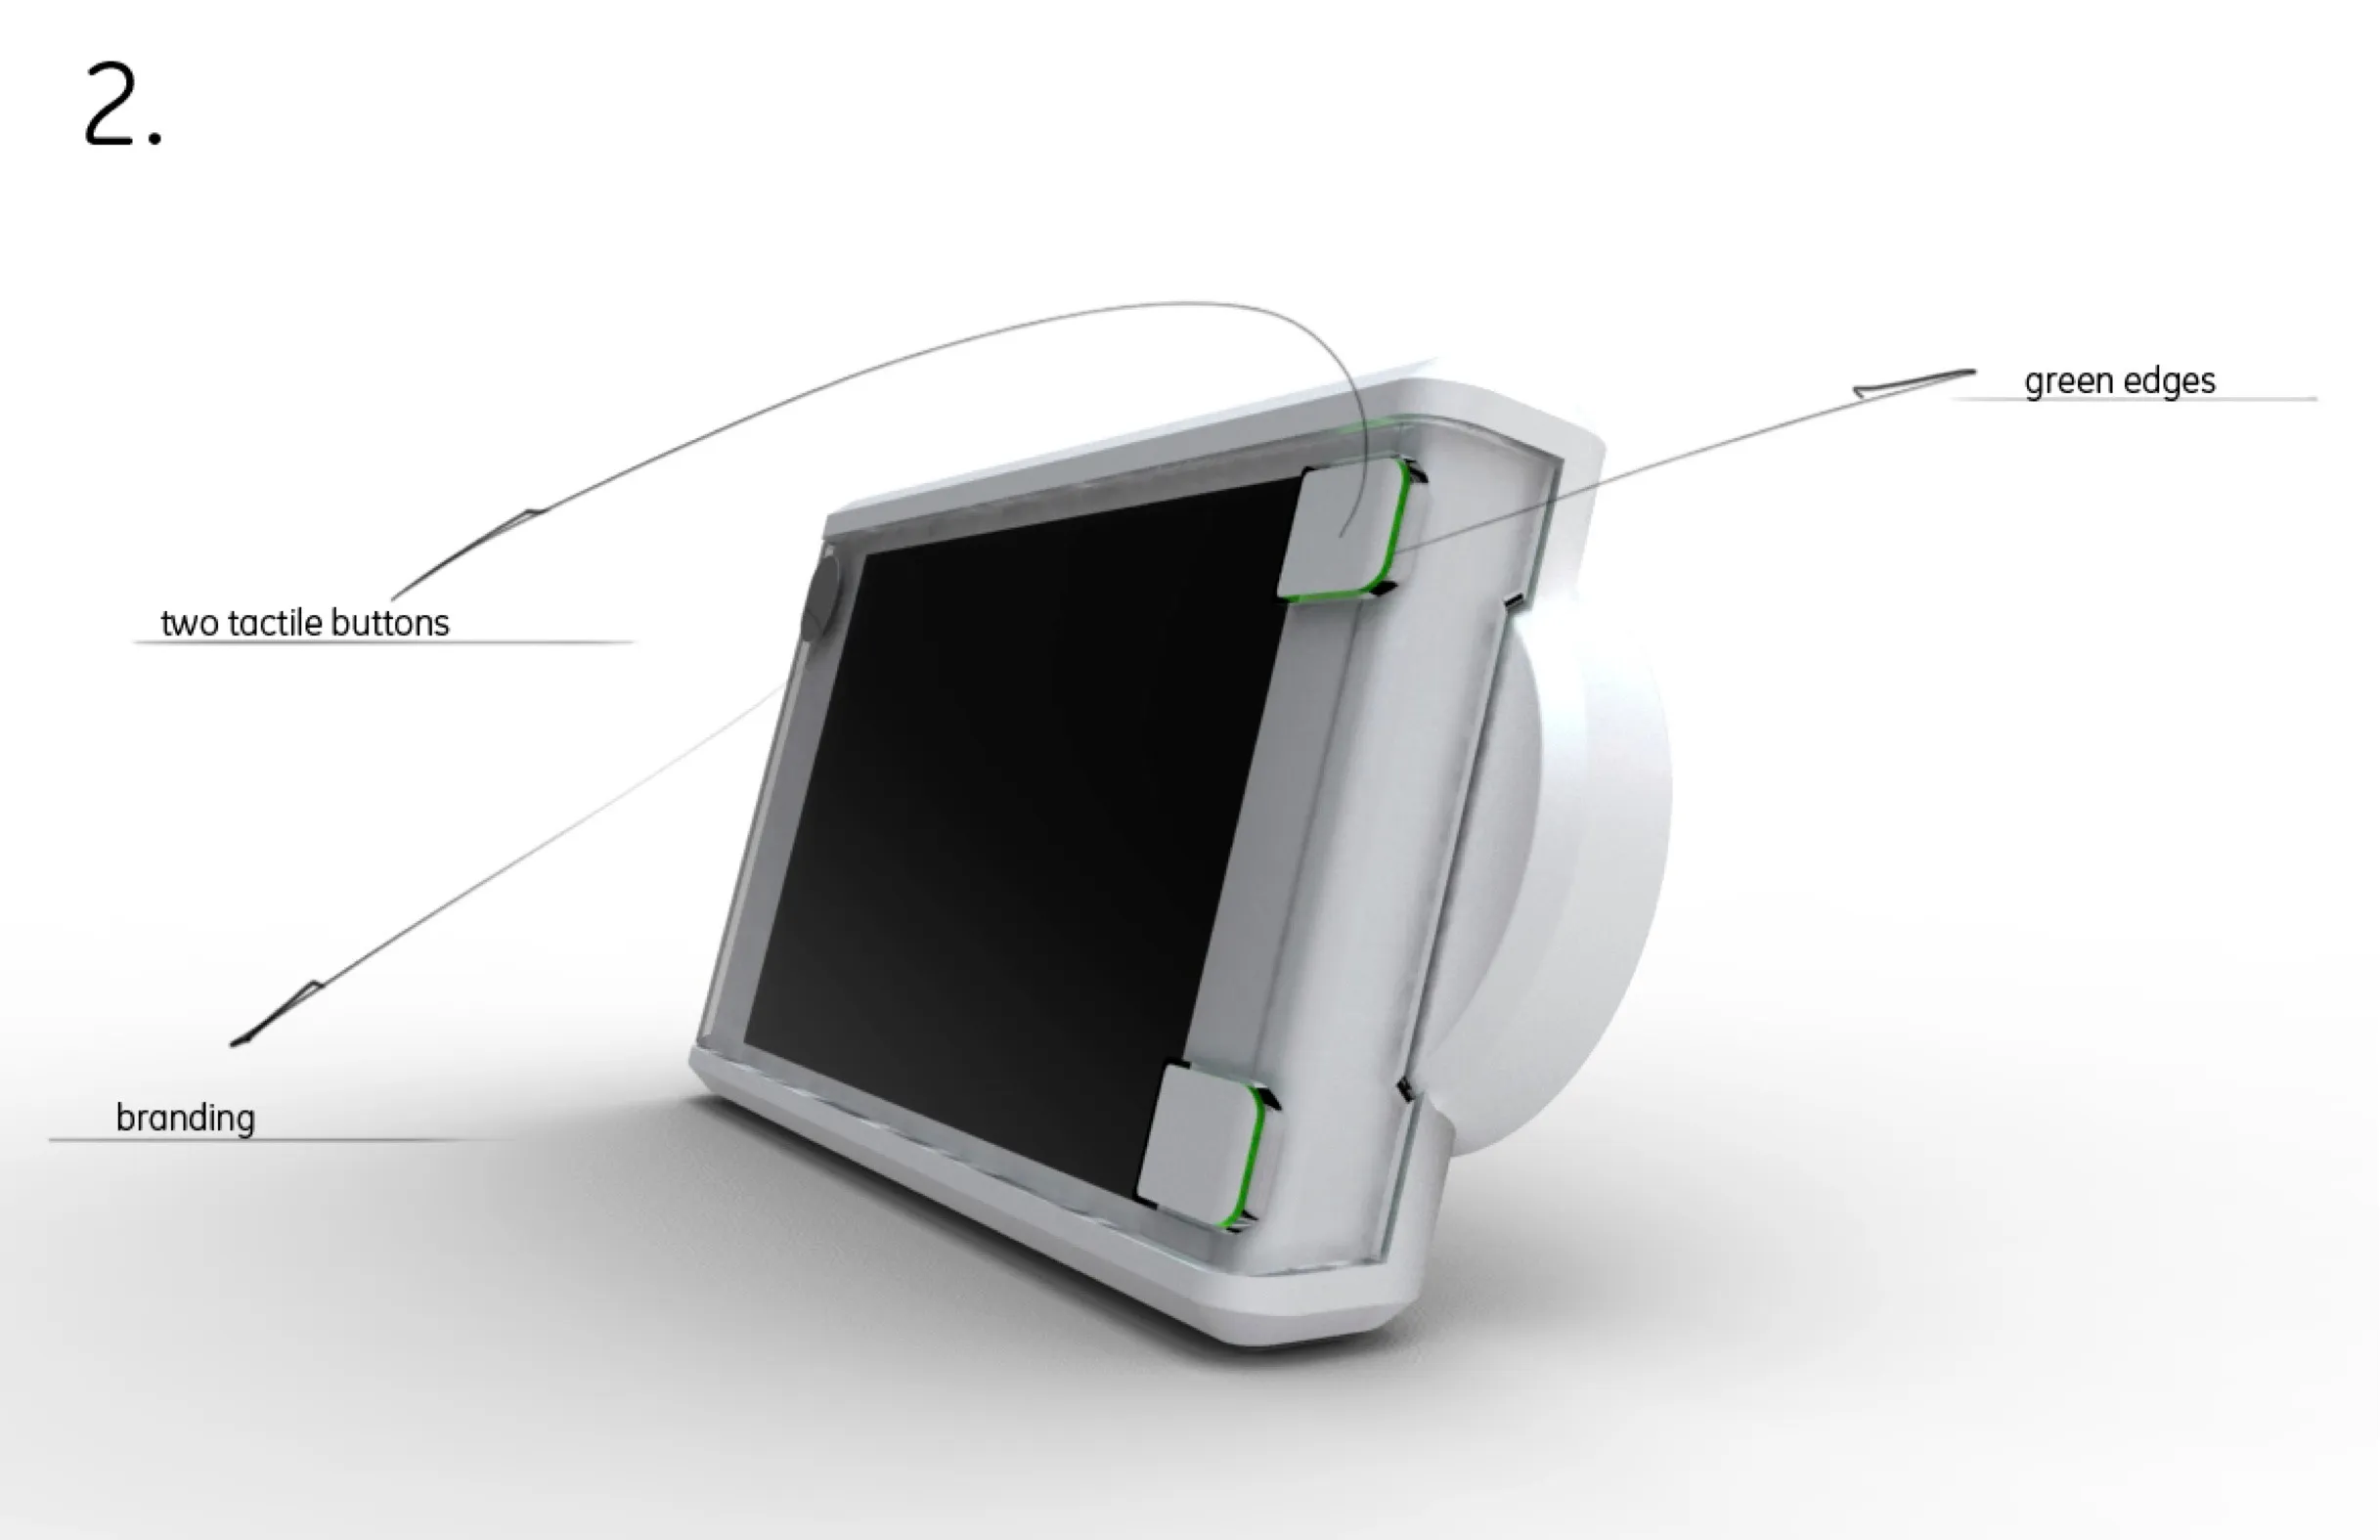
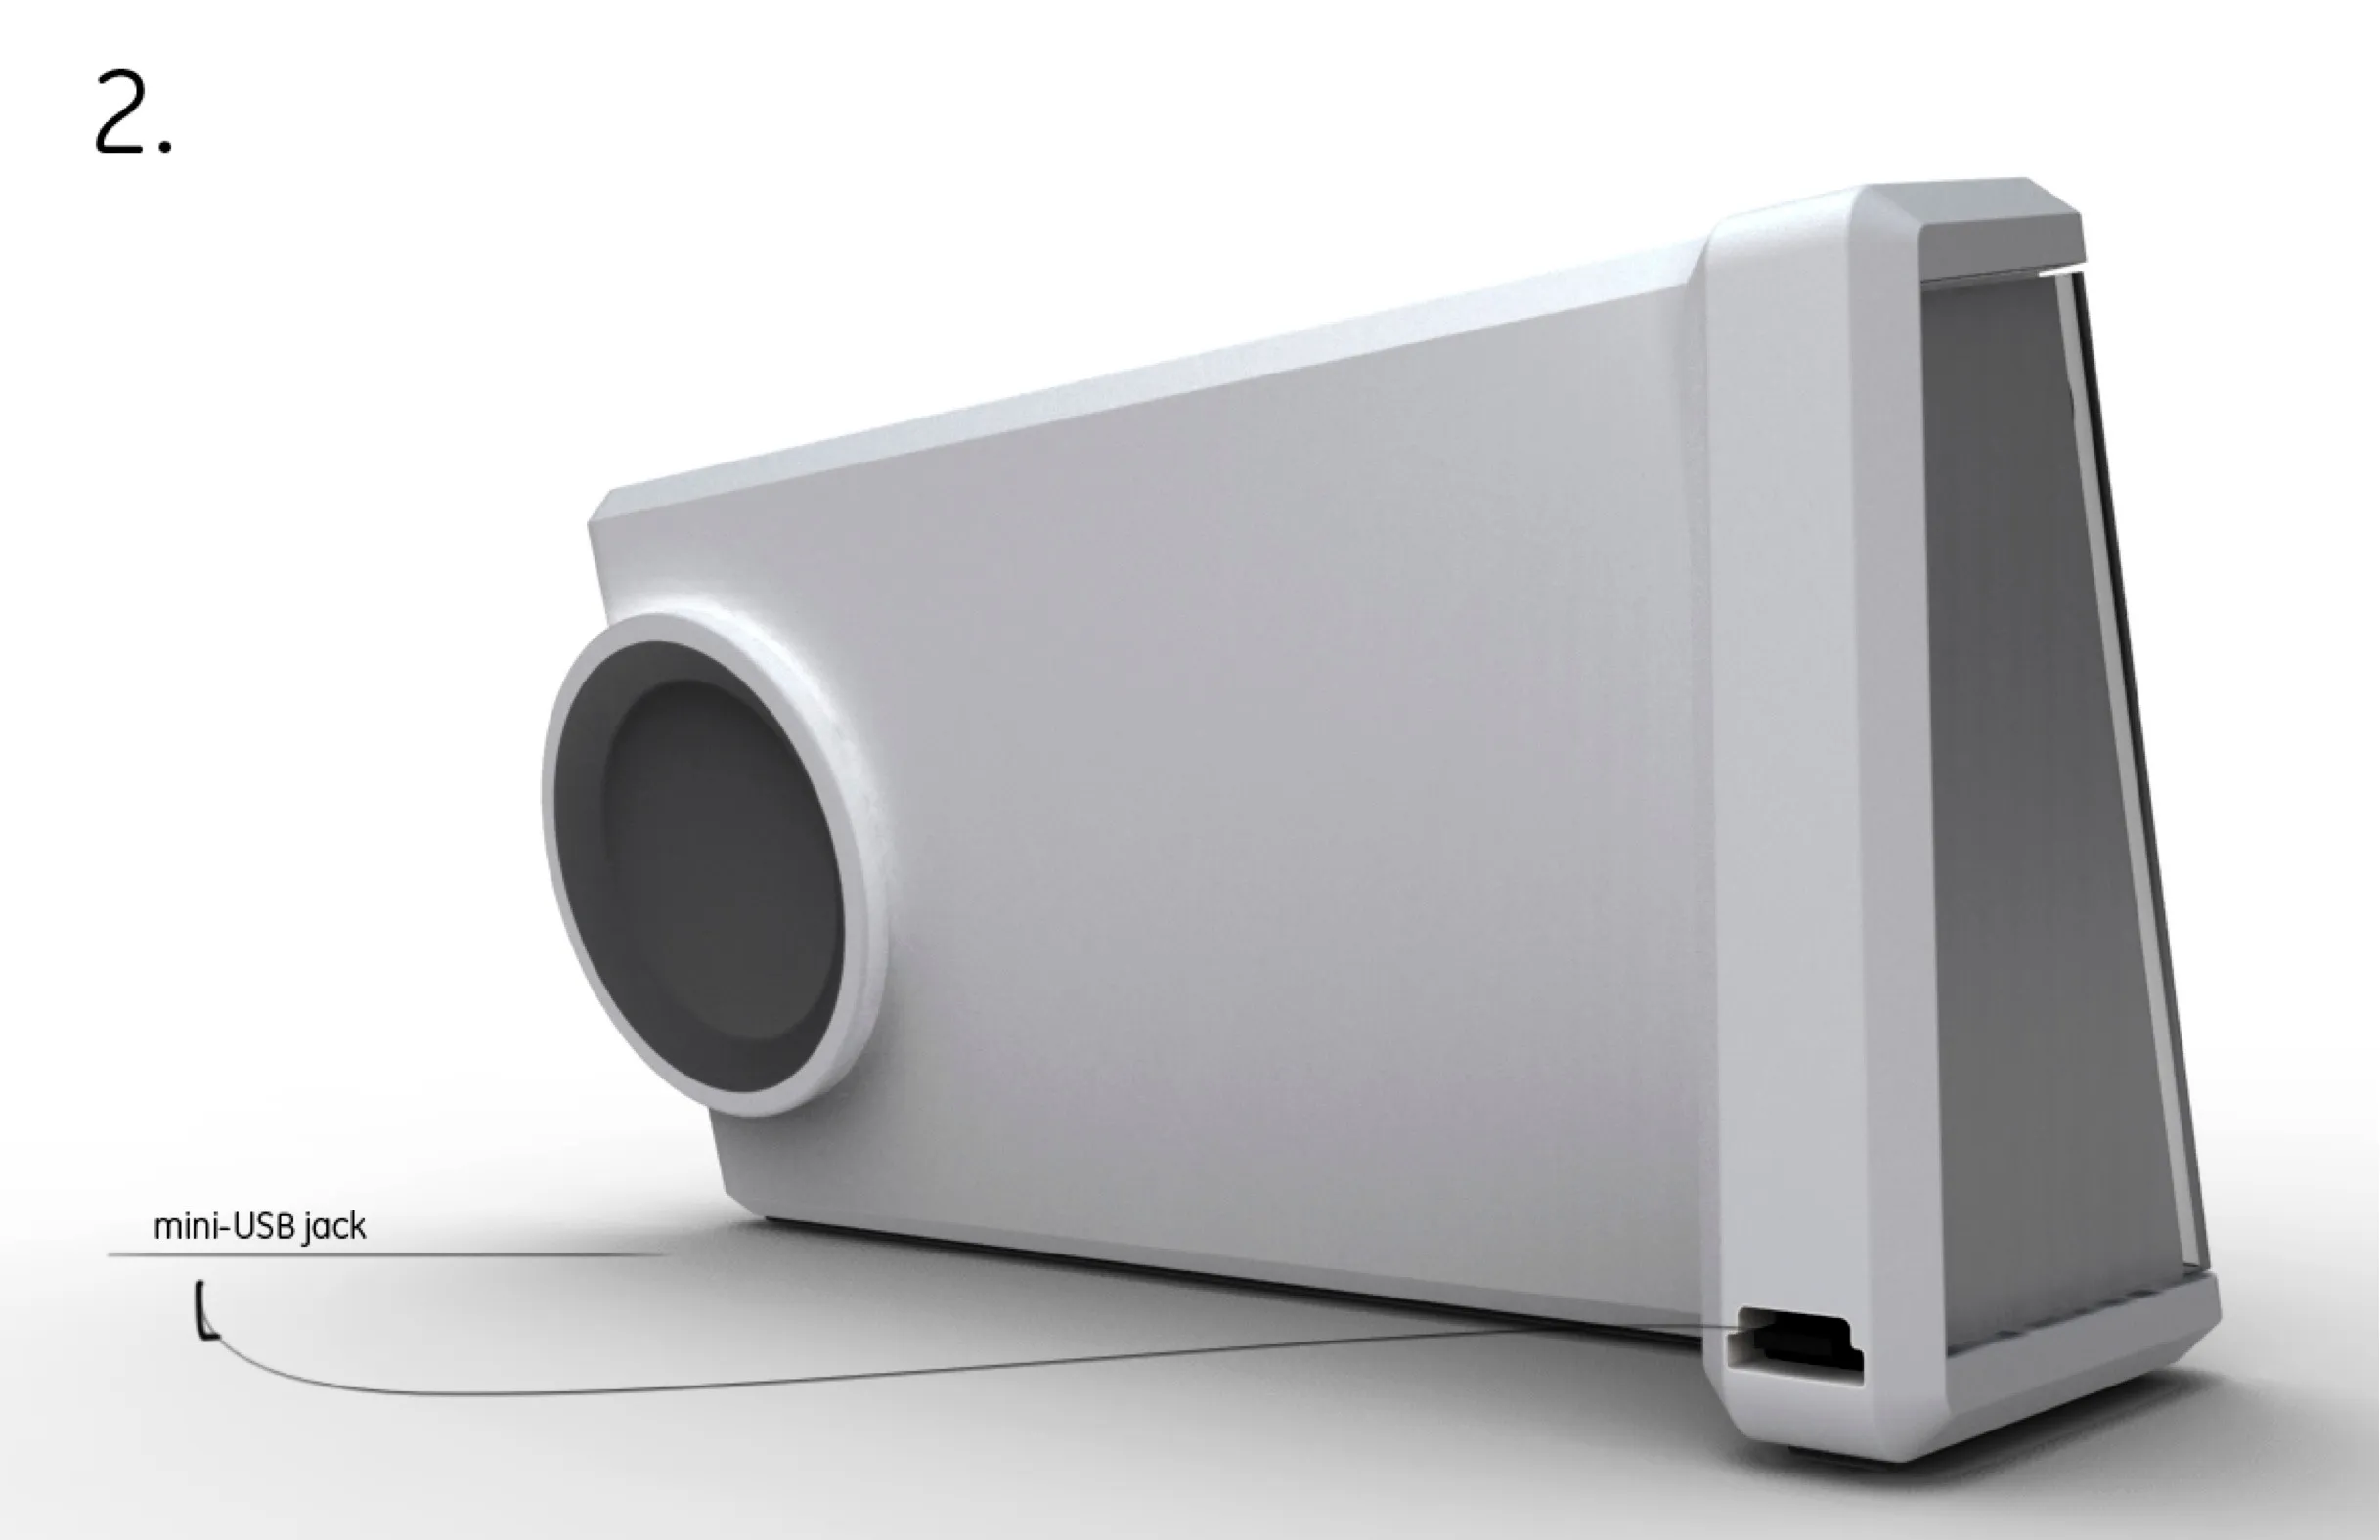
Industrial design concepts synced to the control design. Credit: Elliott Koehler
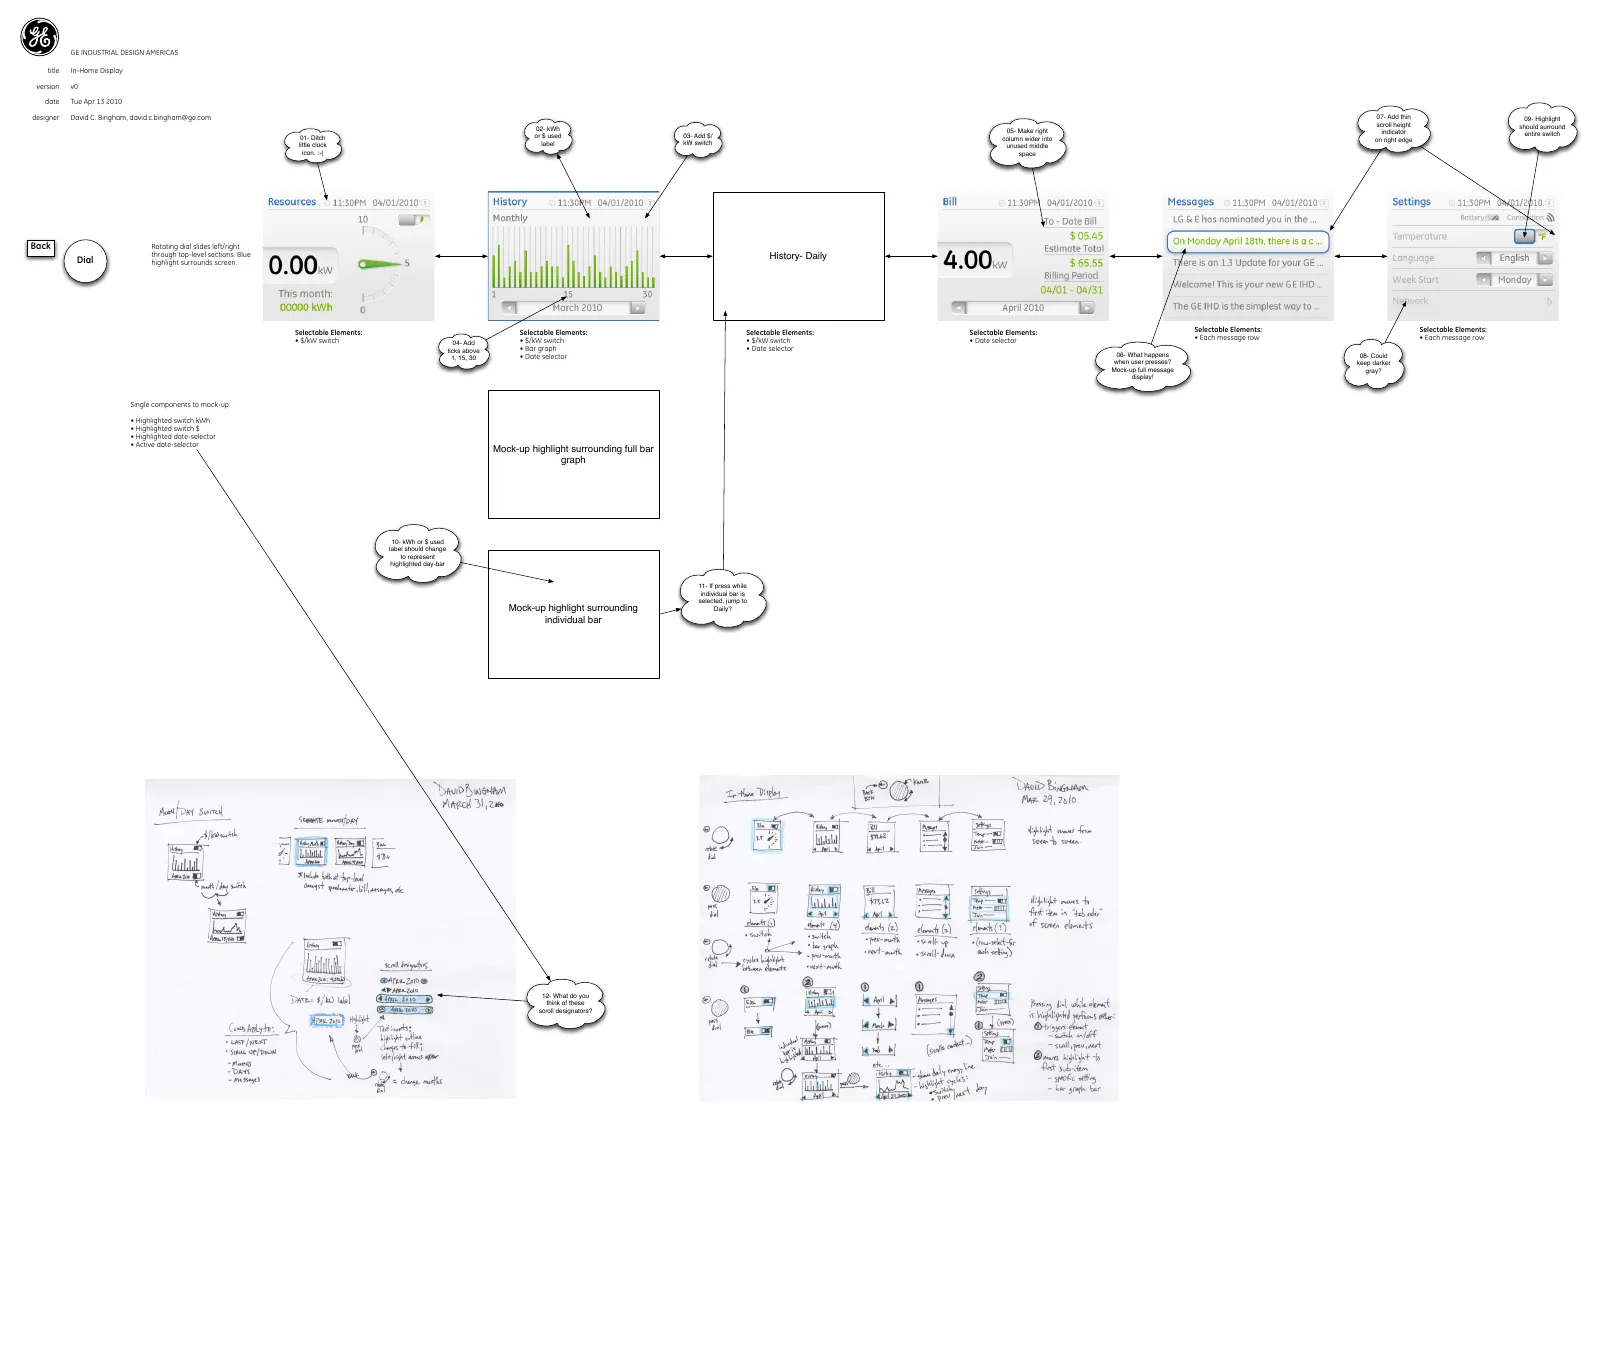
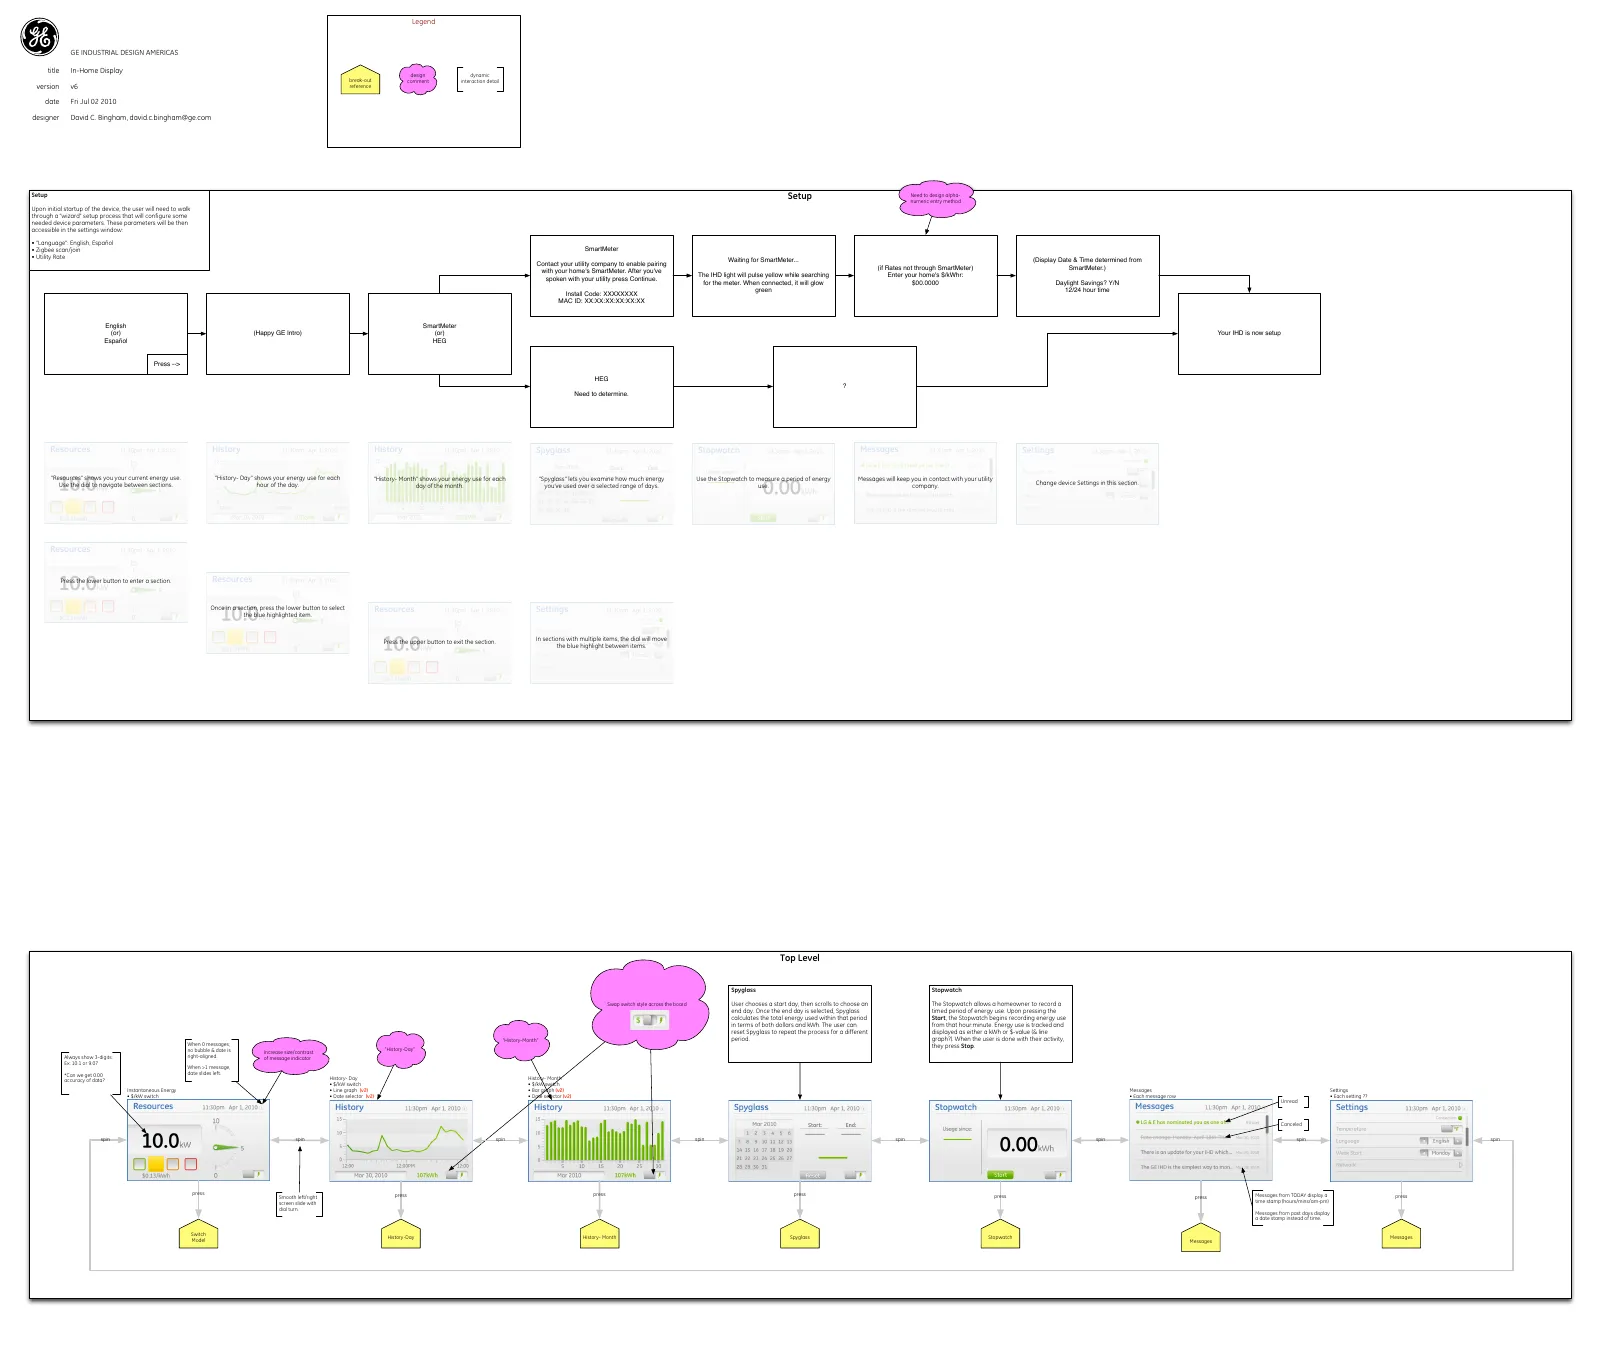
Page one of four versions of my In-Home Display specification, April 2010 to March 2011. Read left to right the page turns from a screen into a system: the notes begin as complaints about my own layout and end as colour values, input models and the copy for the day a utility takes to connect.
The Energy Display UI design evolved through 17 versions of the specification.4 of 17 versions · 13 Apr 2010 – 29 Mar 2011
v0 · 13 Apr 2010
Initial spec building off of interaction sketch. v6 · 2 Jul 2010
Adding LED lighting definition. v12 · 15 Sep 2010
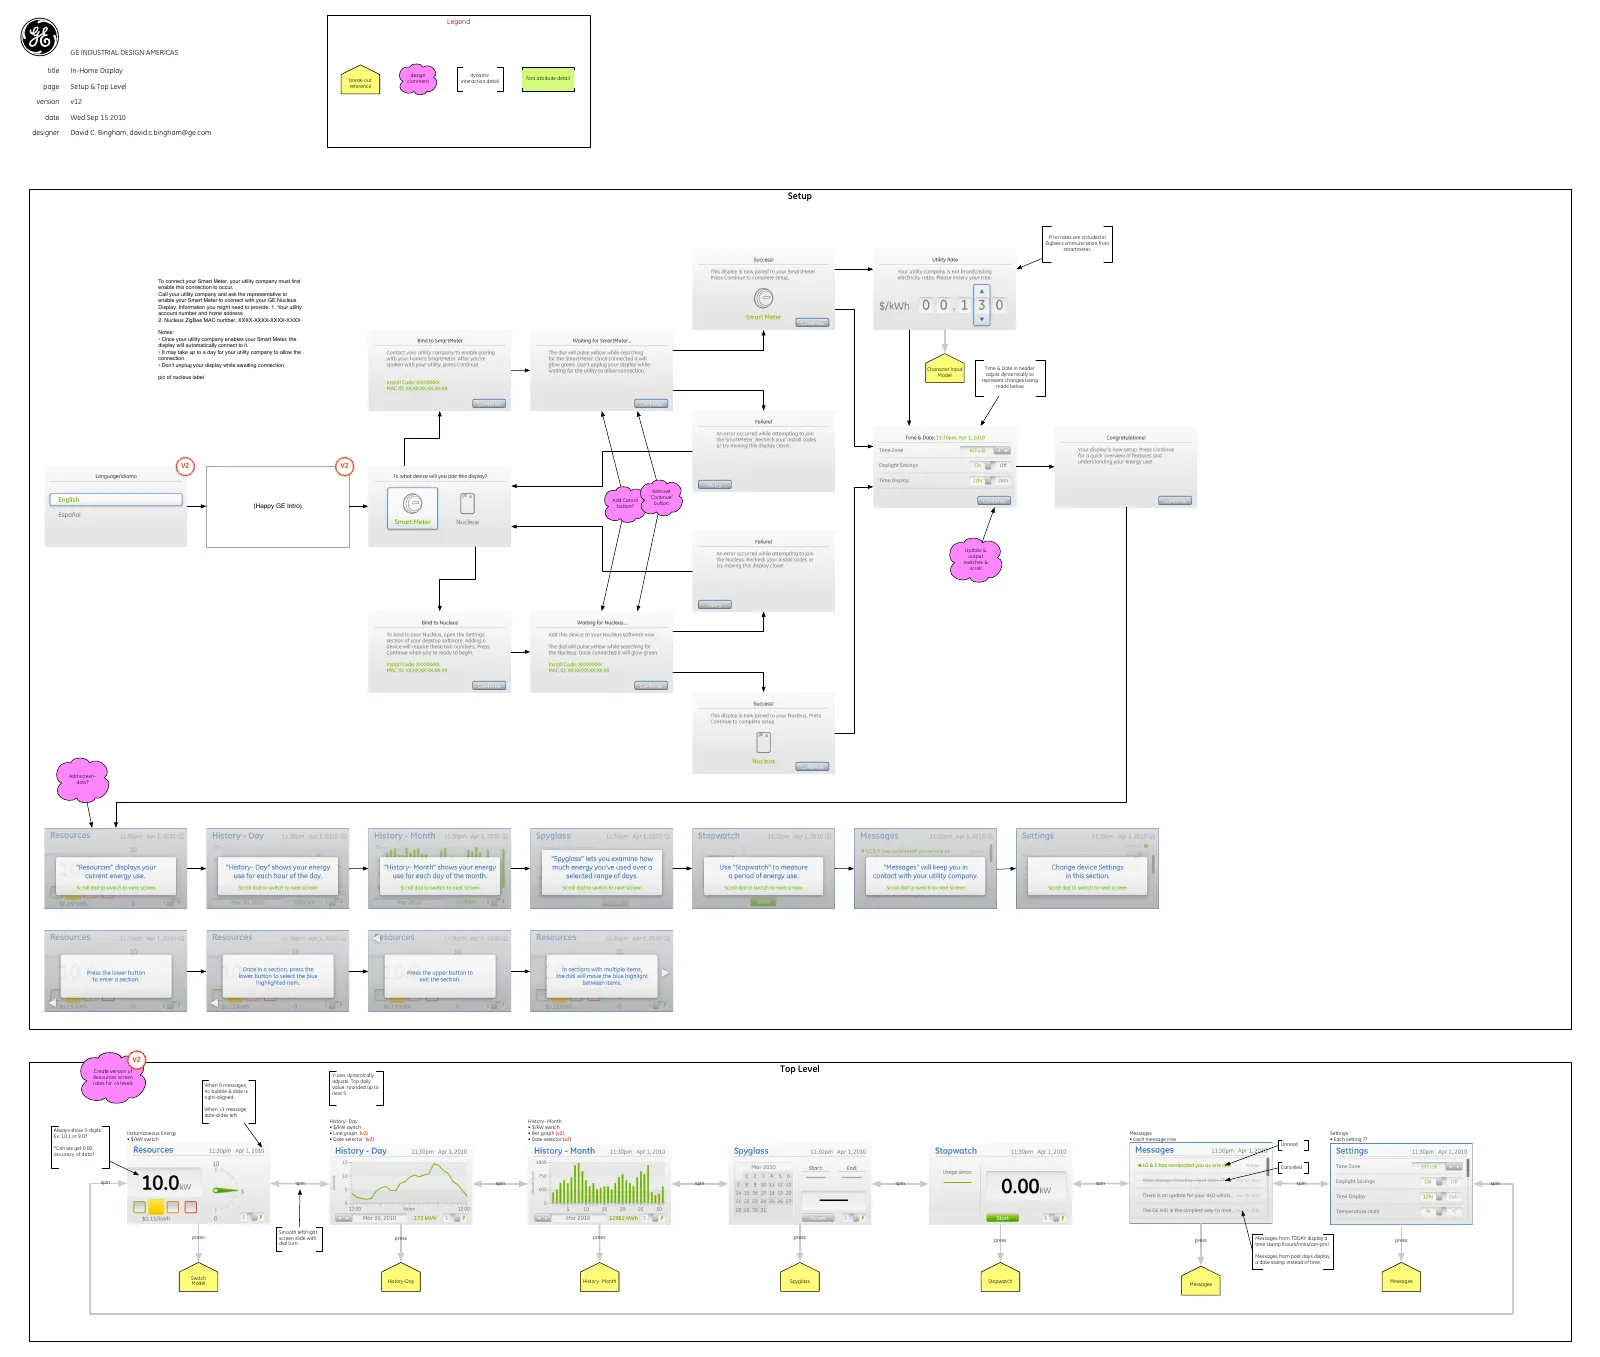
Detailing corner-cases and content. v16 · 29 Mar 2011
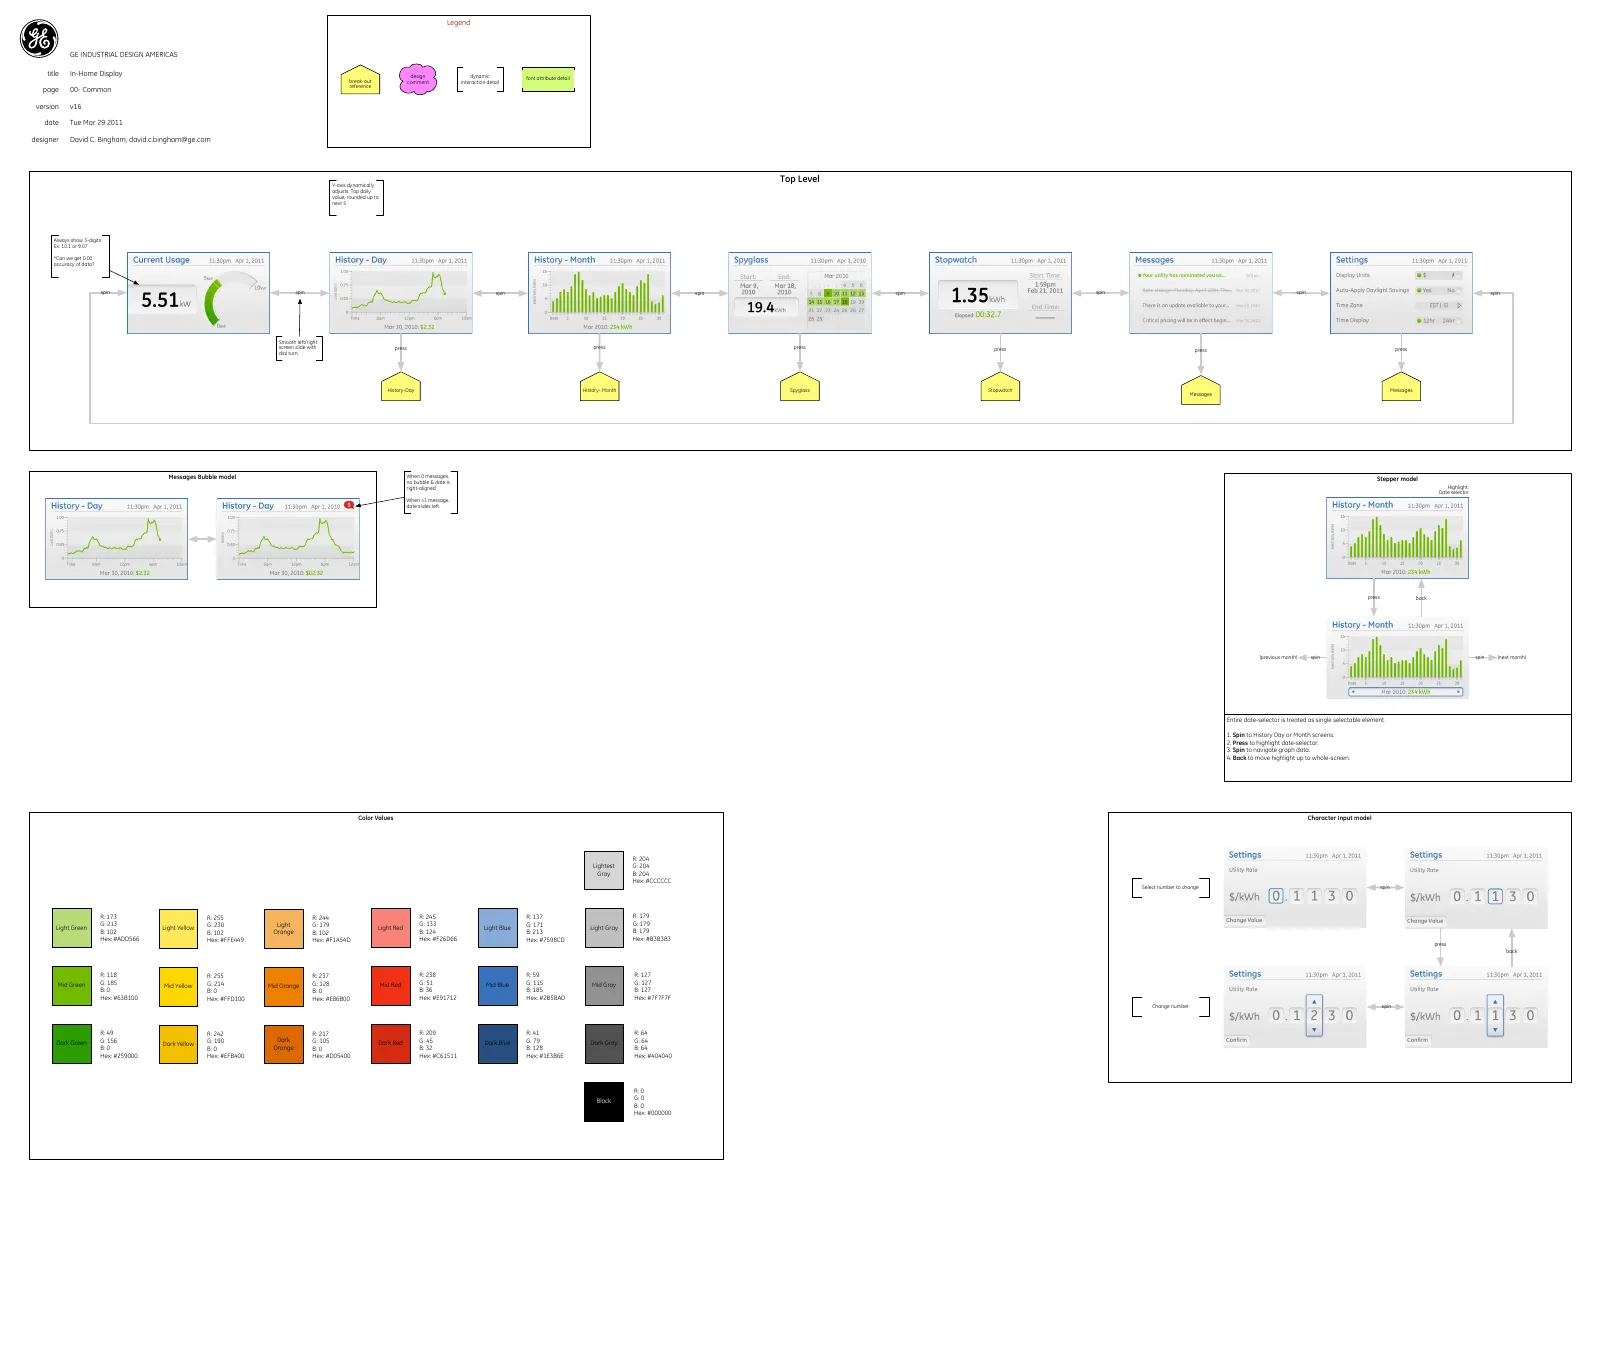
Final spec with full design standards.
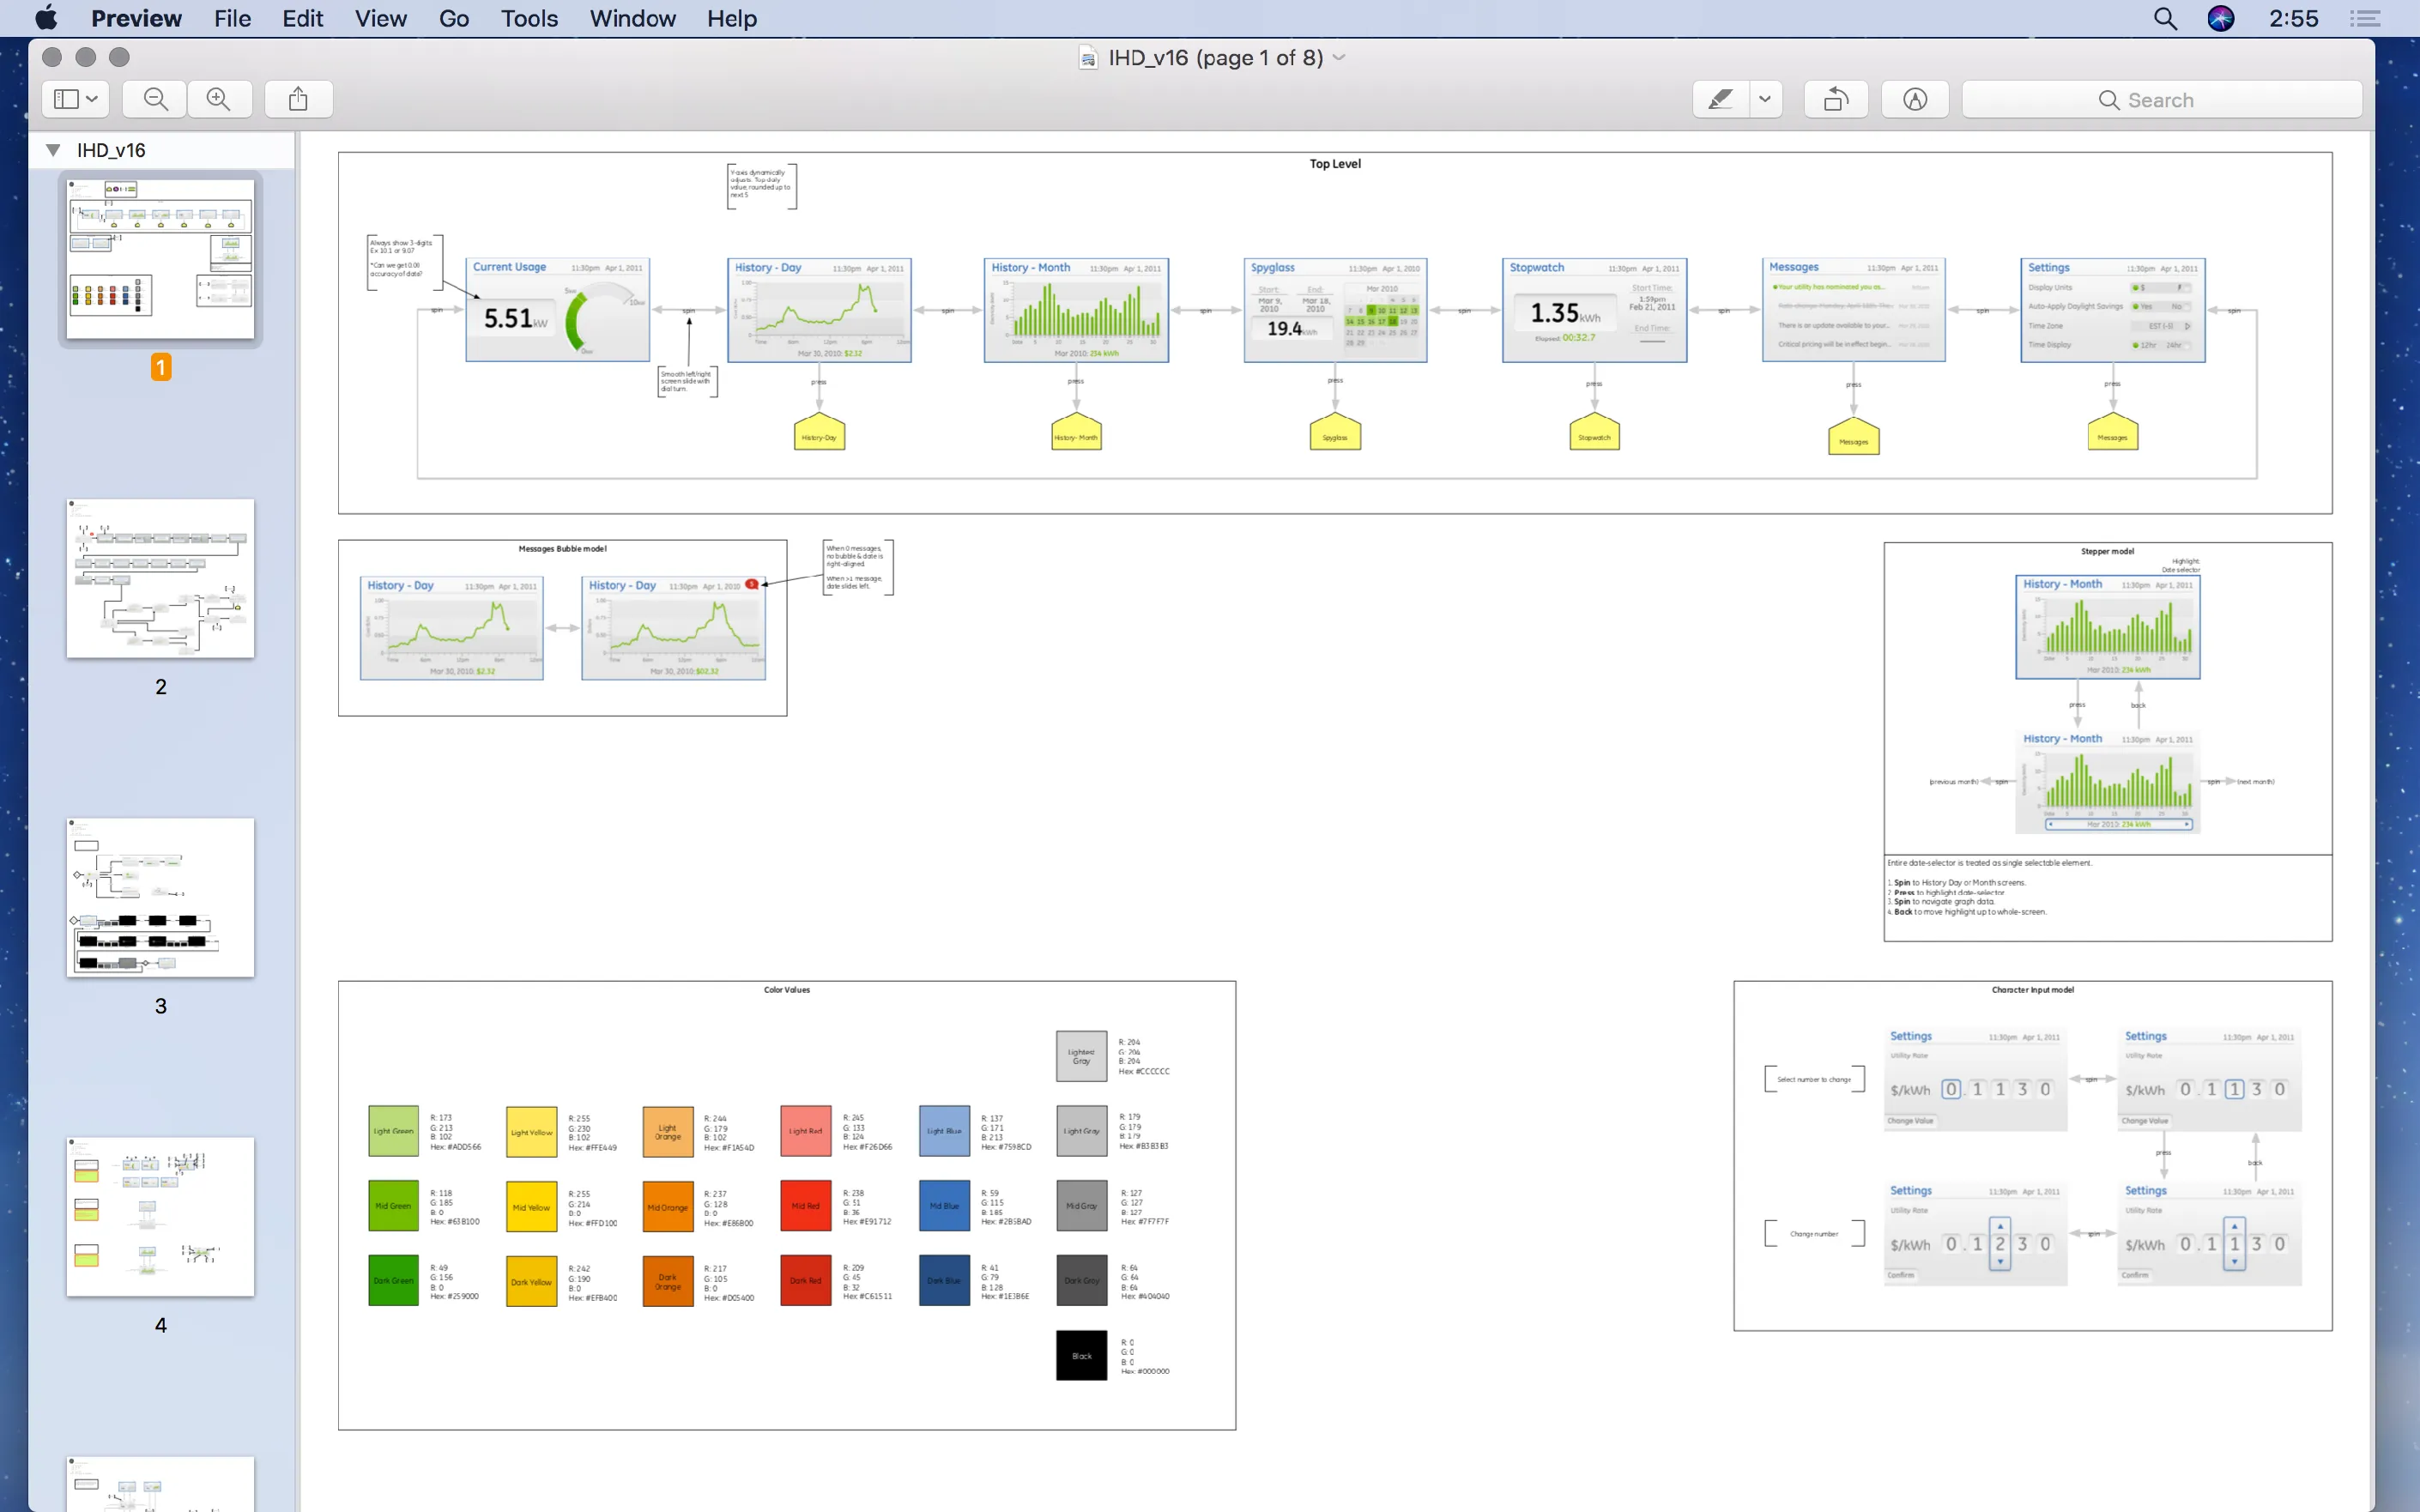
The specification open on my screen: page 1 of the eight that carried the display's color values, input models and every state.
How the Energy Display was tested and what each test changed: a human factors review, usability sessions with ten people, and mock-up rounds with the manufacturer.
Testing and feedback
Heuristic review
Does the working prototype meet GE’s human factors guidelines for legibility, clarity and control?
14 of 23 guidelines passed. The stiff keypad became tactile buttons, and only the current rate tile lights.
Usability sessions
Asked to 10 participants: What should it tell you, where would it live, what does the dial do, and do the screens make sense?
Half touched the screen first. “Current Usage,” labeled axes, and the number and needle both kept, as people asked.
Hardware refinement
Can the case, knob and light be built as drawn, and stand steady on a kitchen counter?
Light bleeding through the case was blocked, the knob thinned, and a wobbling fifth foot came off.
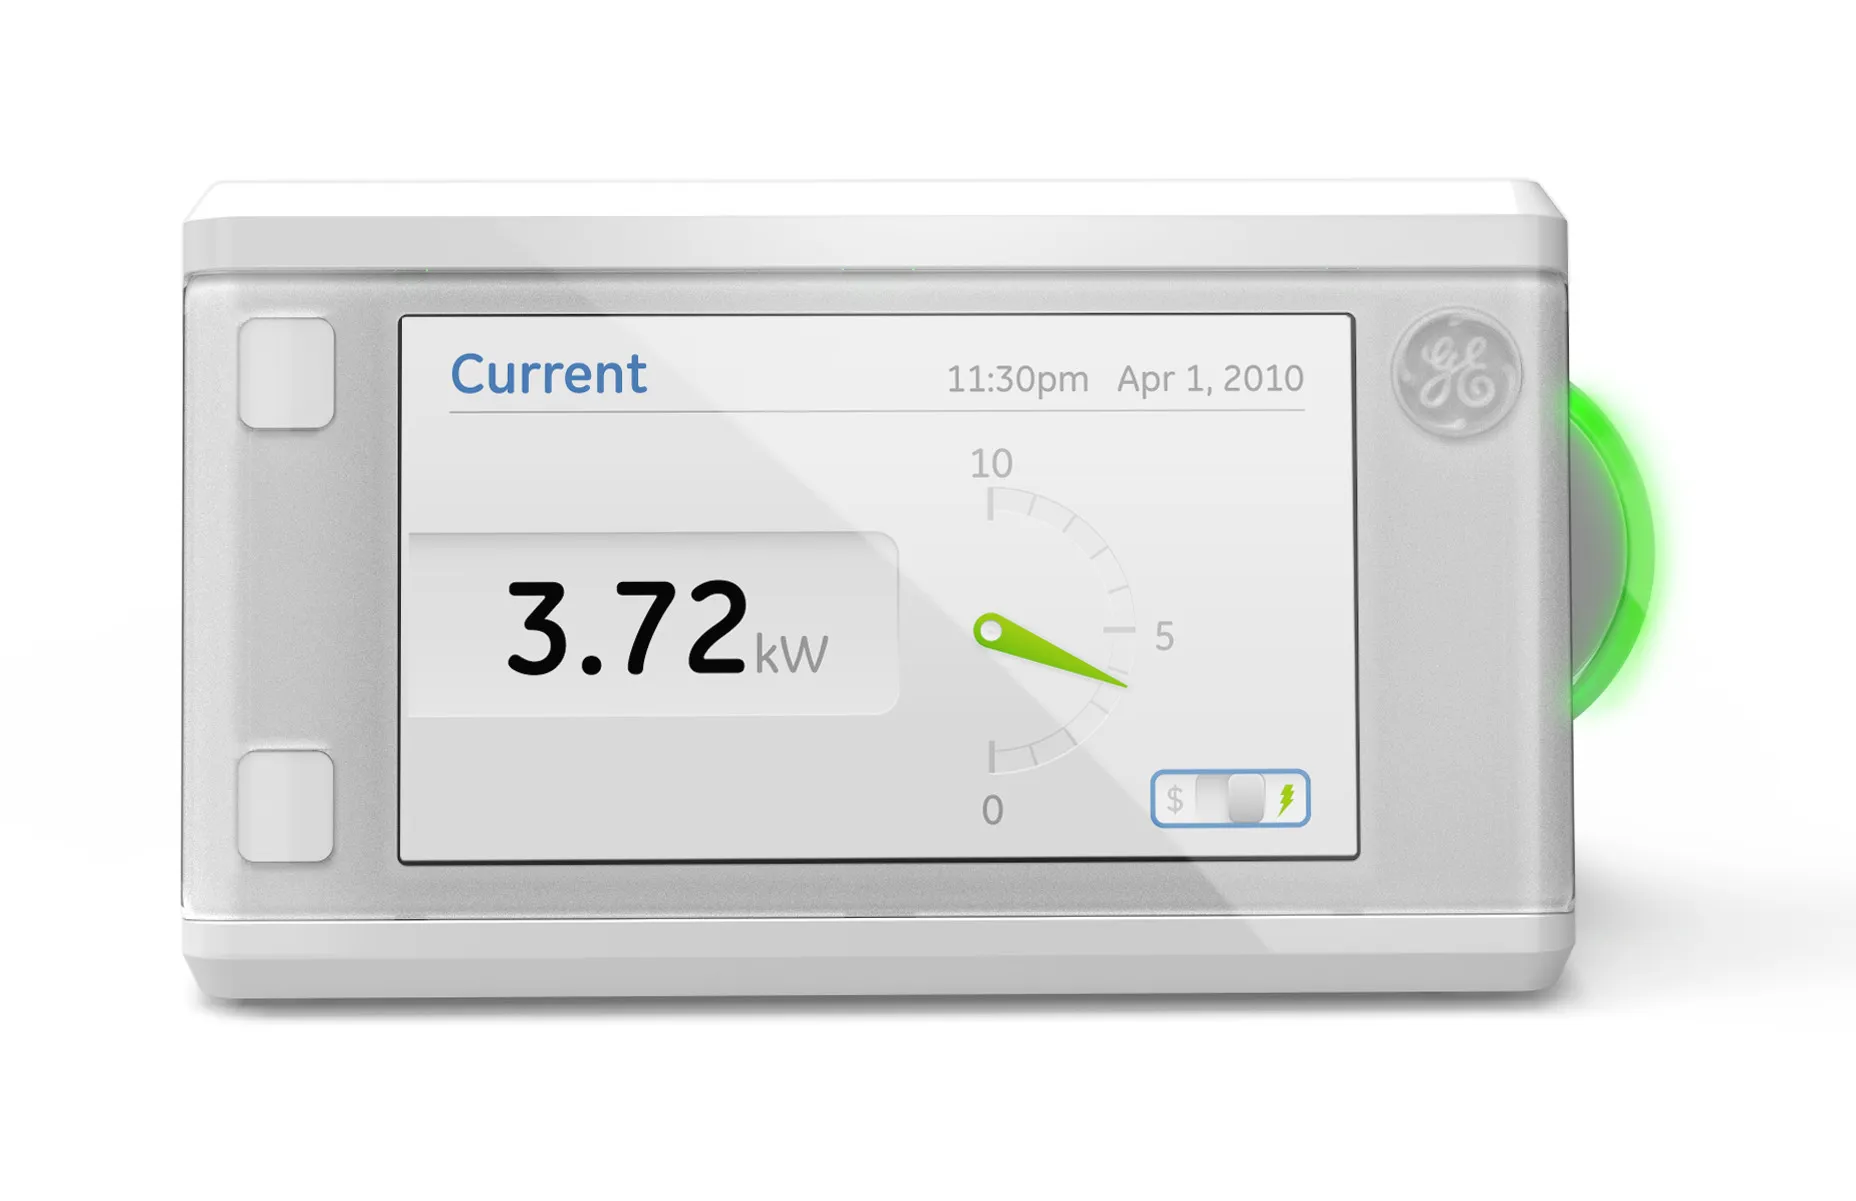
Four screens from version 14 of the display interface at full size. Each gives one number its own screen, with the dollars-or-kilowatts switch in the same corner every time; the callouts are the descriptions I wrote into the spec.
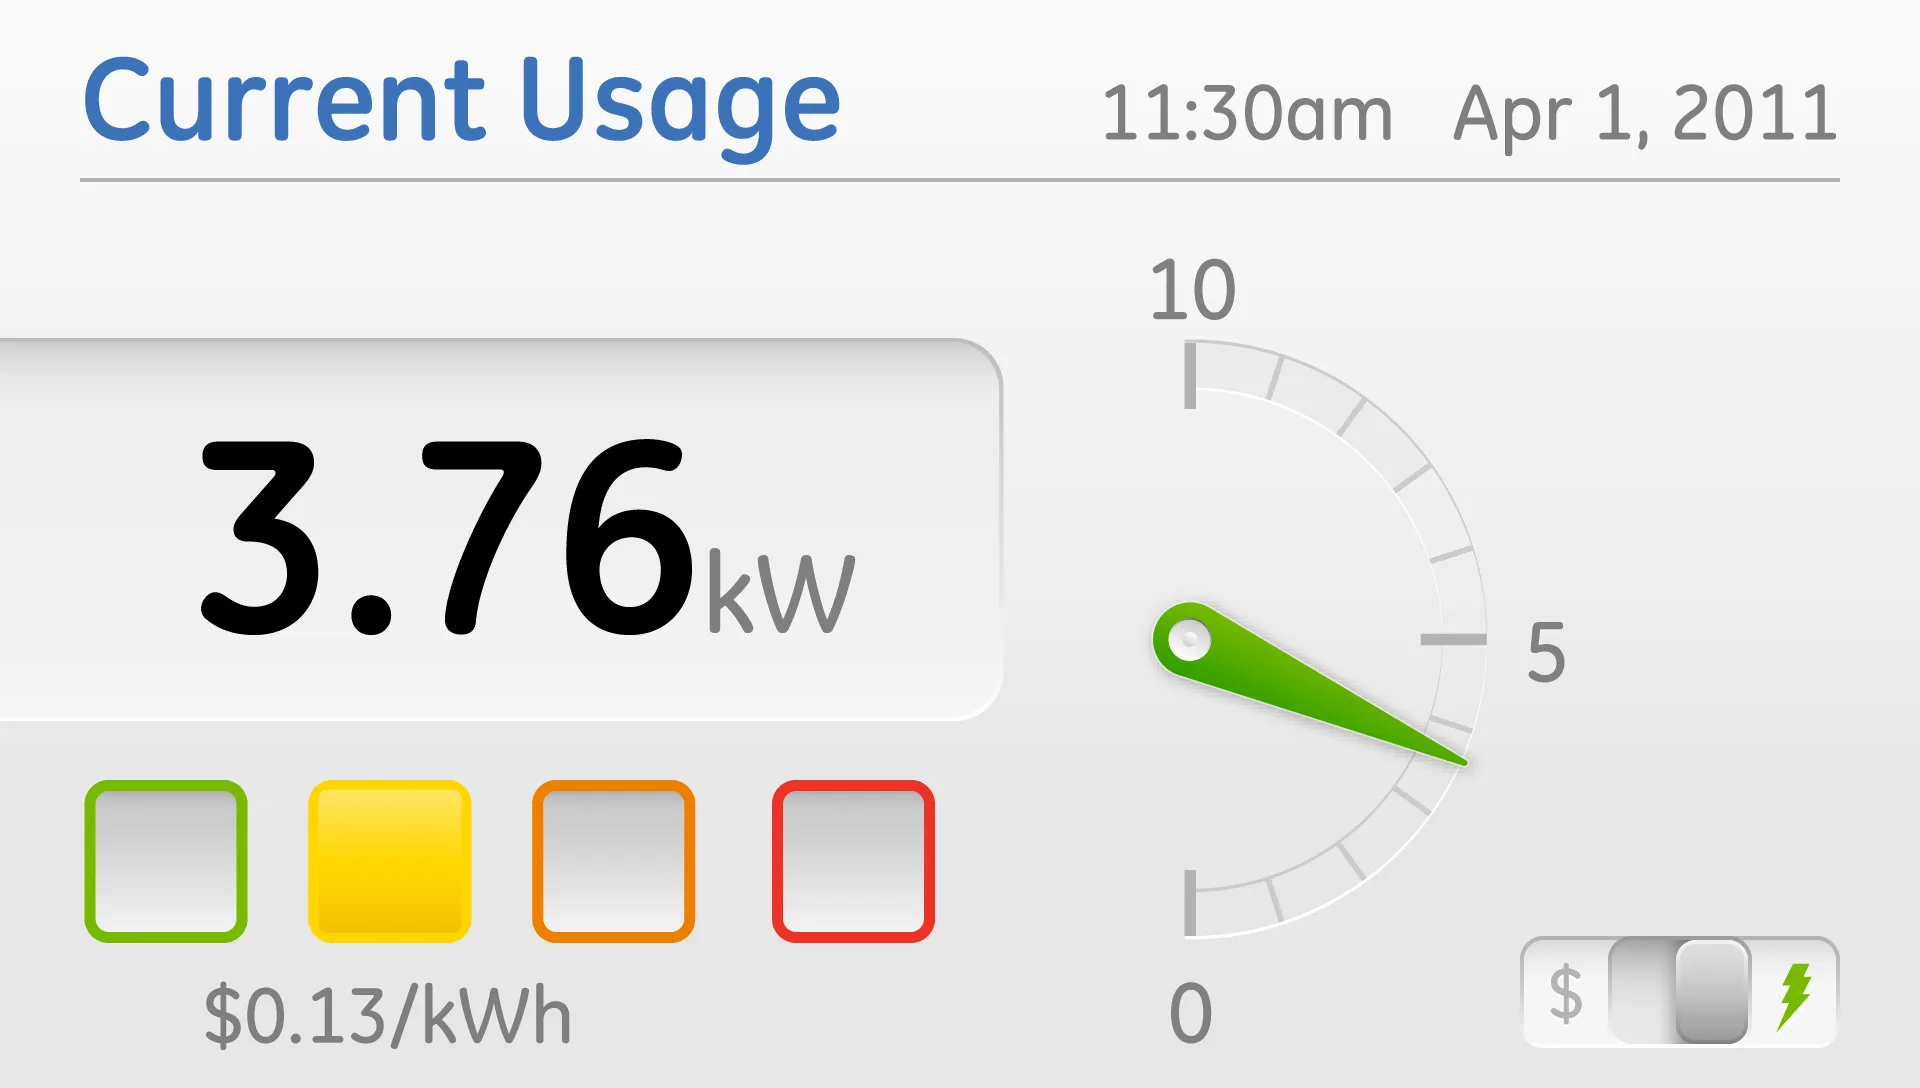
Current Usage
See your immediate energy consumption in terms of dollars or kWh.
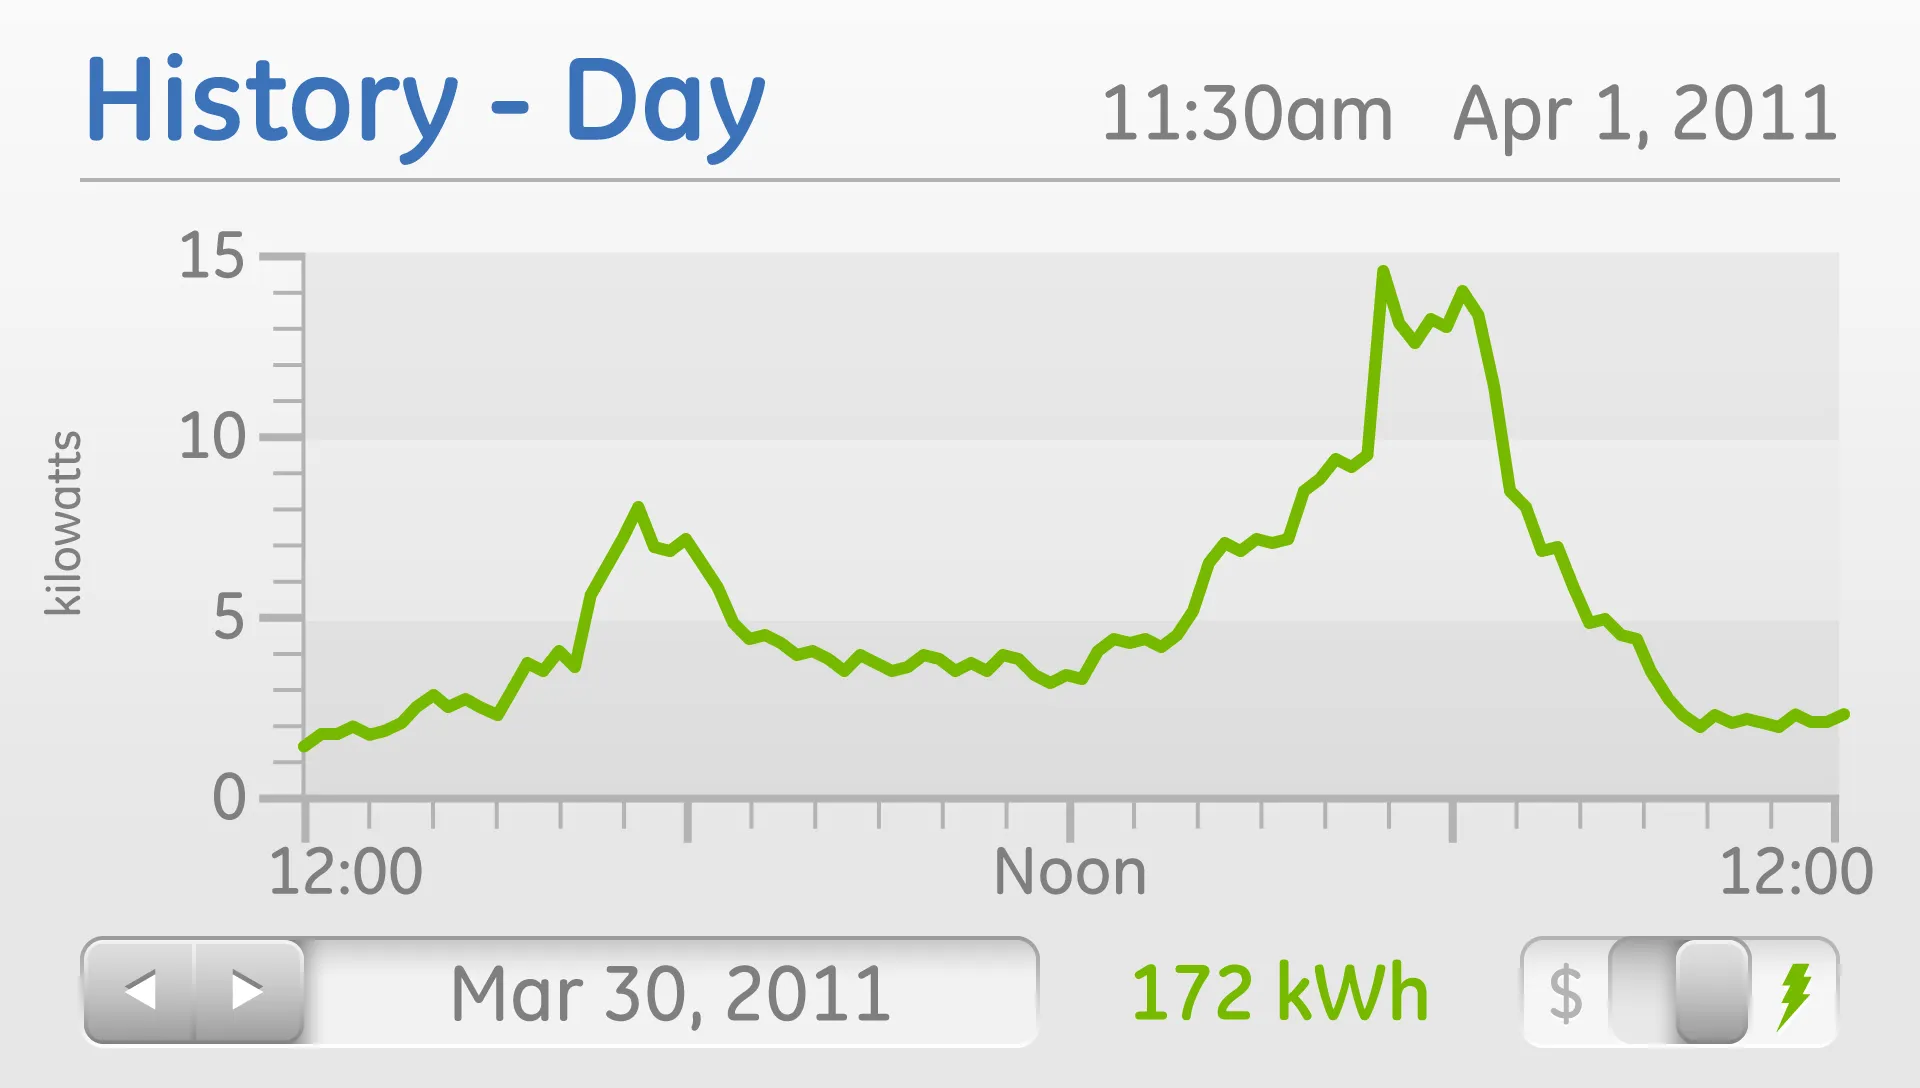
History - Day
A whole day’s worth of energy use hour by hour.
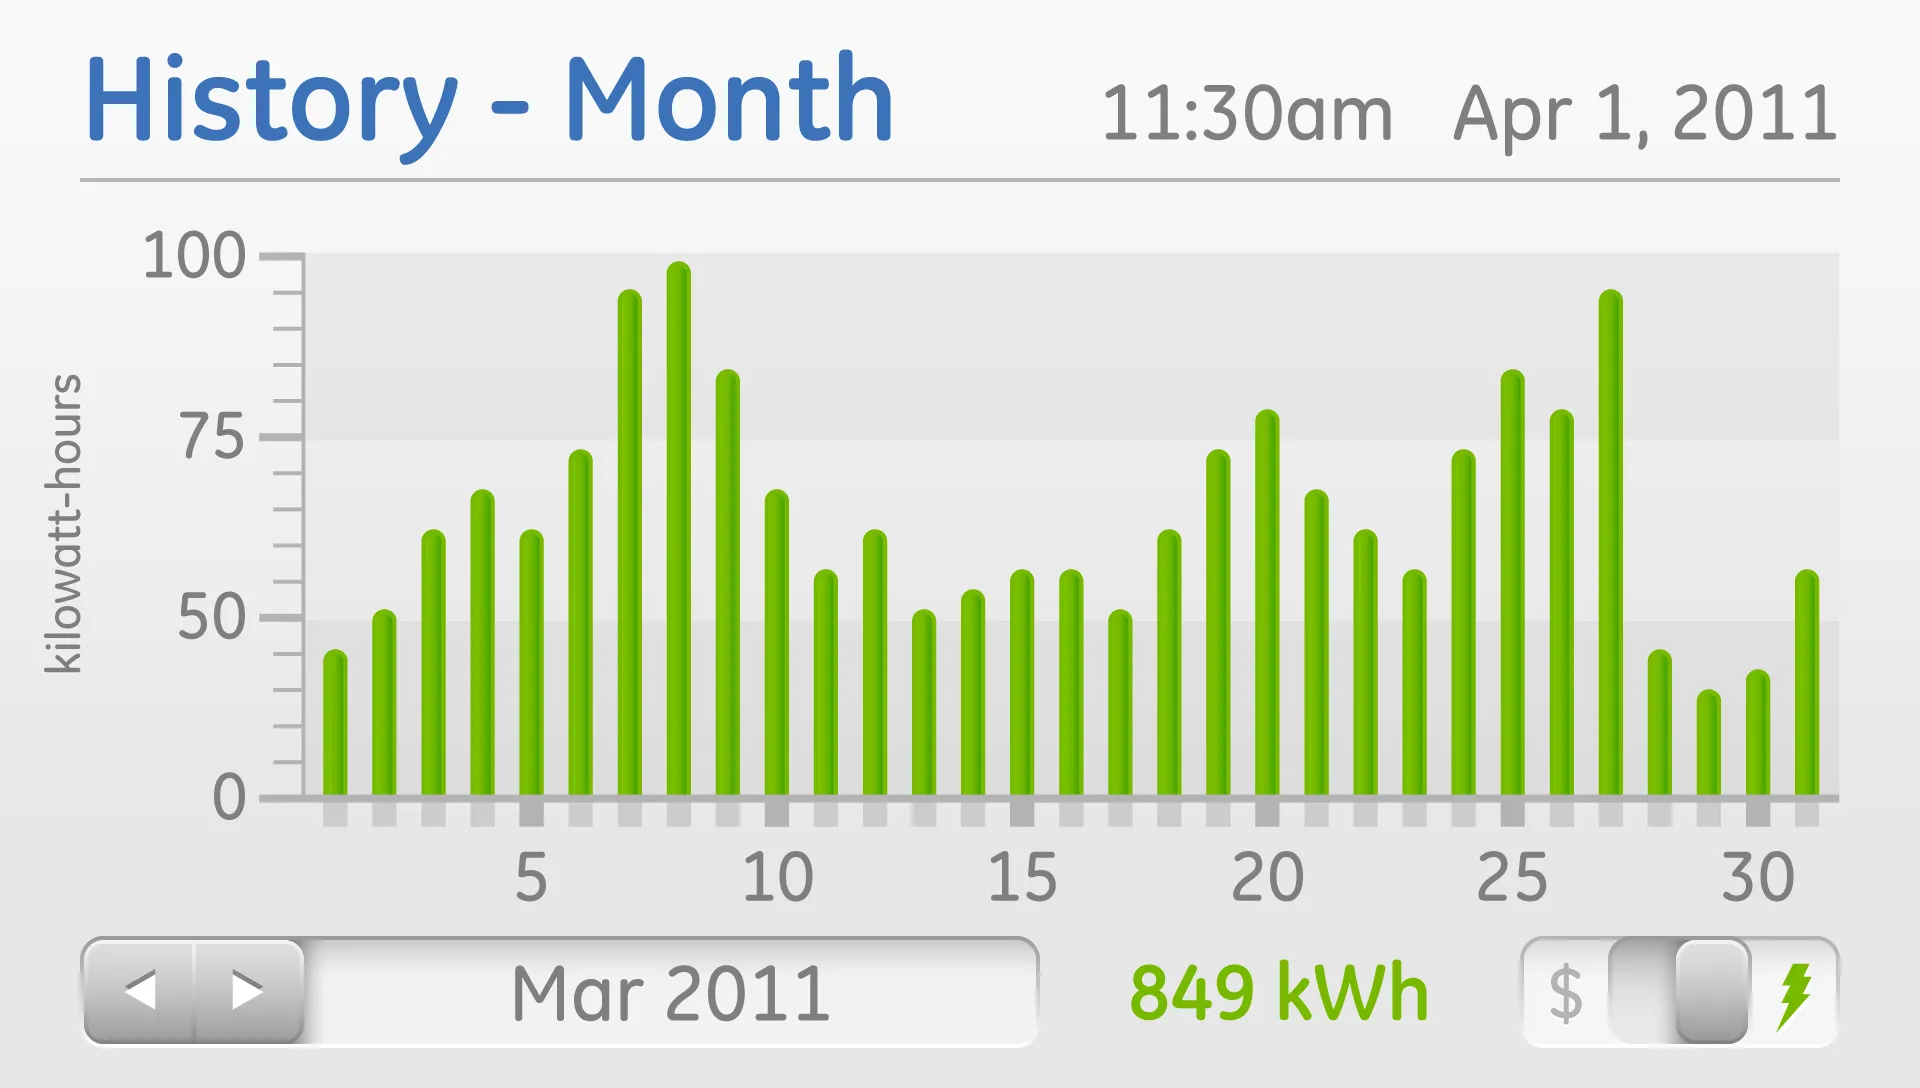
History - Month
Energy use per day over each month.
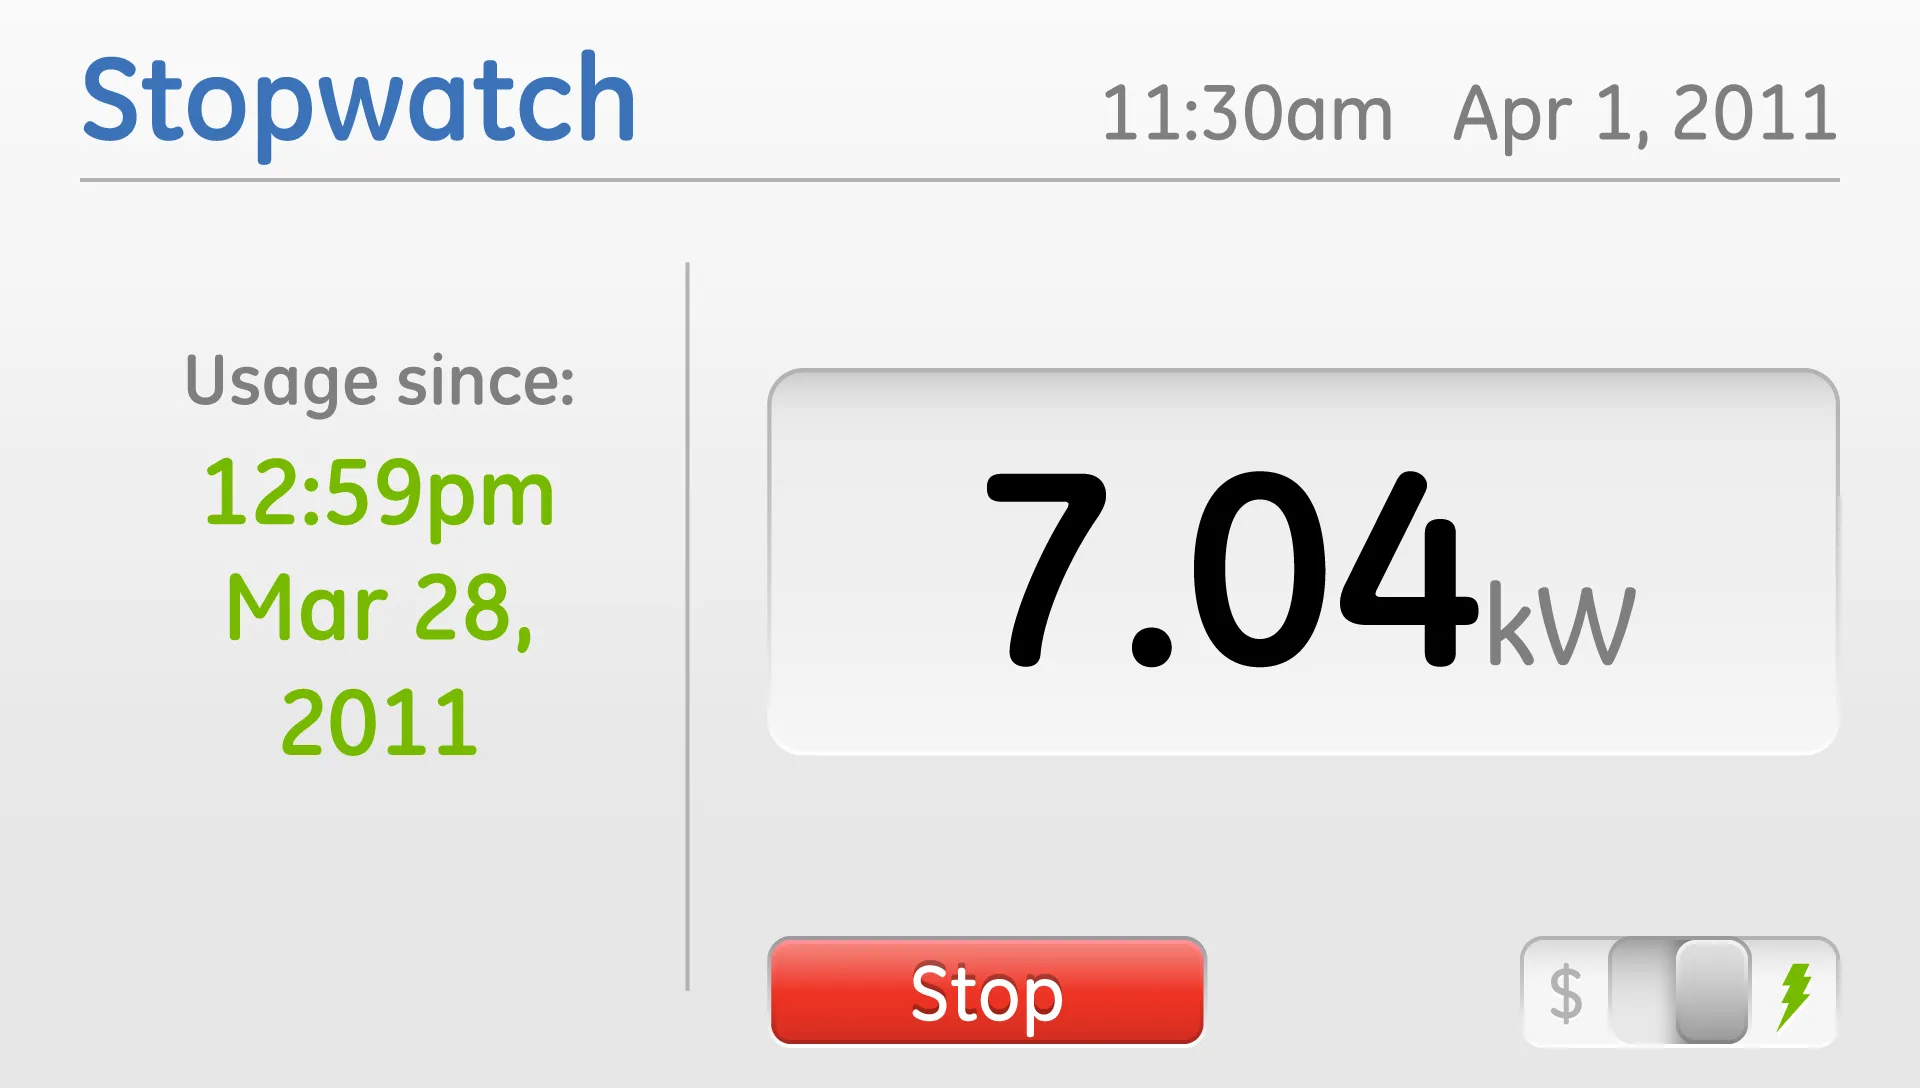
Stopwatch
Use the Stopwatch to measure a period of energy use.
Three renders of the Energy Display: from the front on the Current screen, from the side on History, and from behind, its green-lit knob ring at one end.
What became of the Energy Display, as a record: its launch at CES in January 2011, its place in GE's utility pilot kit, two patent filings on its interface, and its showing in Europe.
January 2011 · CES, Las Vegas
Launch at CES
GE introduced the display as new at CES: it “communicates with the utility smart meter” and gives “a continuous audit of household energy consumption in kilowatt-hours and in estimated dollars spent.” The launch listed live use and cost, the current time-of-use price, history by month, day and hour, analysis over any period, and messages from the utility.
2011 – 2012 · GE Brillion pilots
In the utility pilot kit
GE put the display in its utility pilot kit as the “In home Color display”, plugged into the wall beside the energy manager, a thermostat and smart appliances, and certified by UL, CSA, FCC and ZigBee. The pilots ran with investor-owned utilities, cooperatives and municipals, “from a few homes to over a 1,000.”
Filed September 2011 · US patents
Two patent filings
The Stopwatch screen became a granted patent: start, stop, and the energy and cost of one task, on “an energy display … coupled to the smart meter” (US8769426B2, 2014). Its sibling, filed the same day, totals use between any two dates (US20130073059A1).
October 2011 · Smart Homes Europe, Amsterdam
Shown in Europe
GE took the display to Smart Homes Europe in Amsterdam, and it was still part of the line in March 2012.
v4 Nucleus
The Nucleus press image: a small white box plugged into a wall socket with three green lights. This is the second generation in one photograph, the computer taken off the wall screen and put on the outlet, with the interfaces moved to devices people already owned.
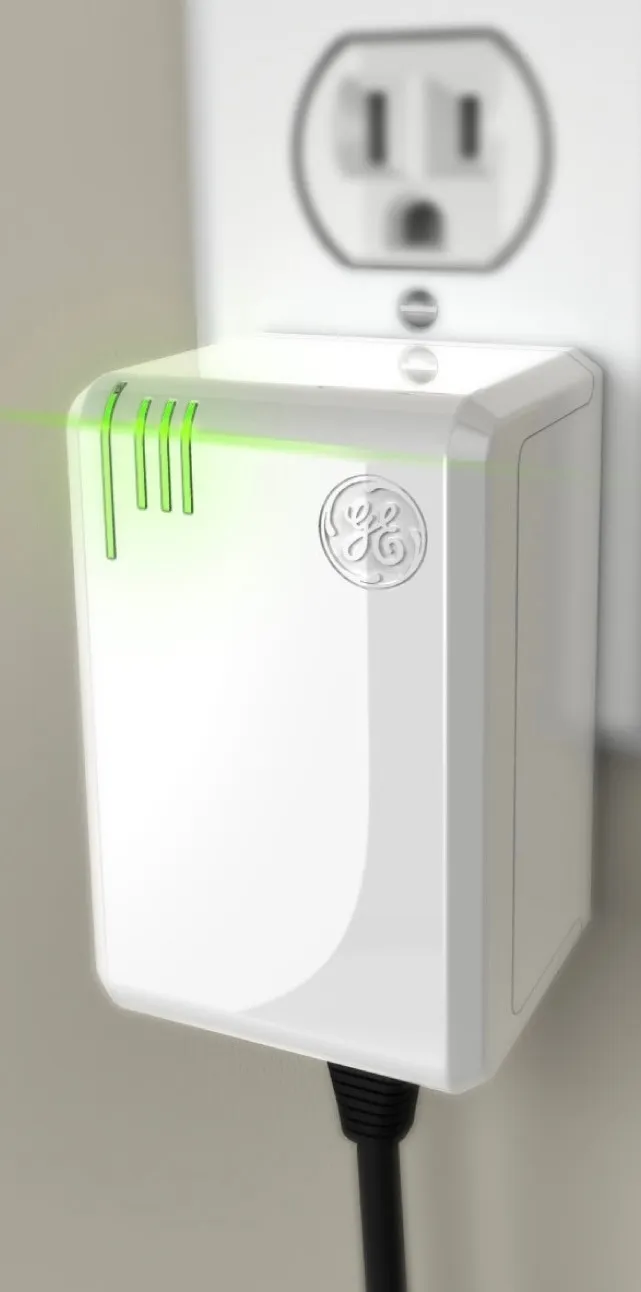
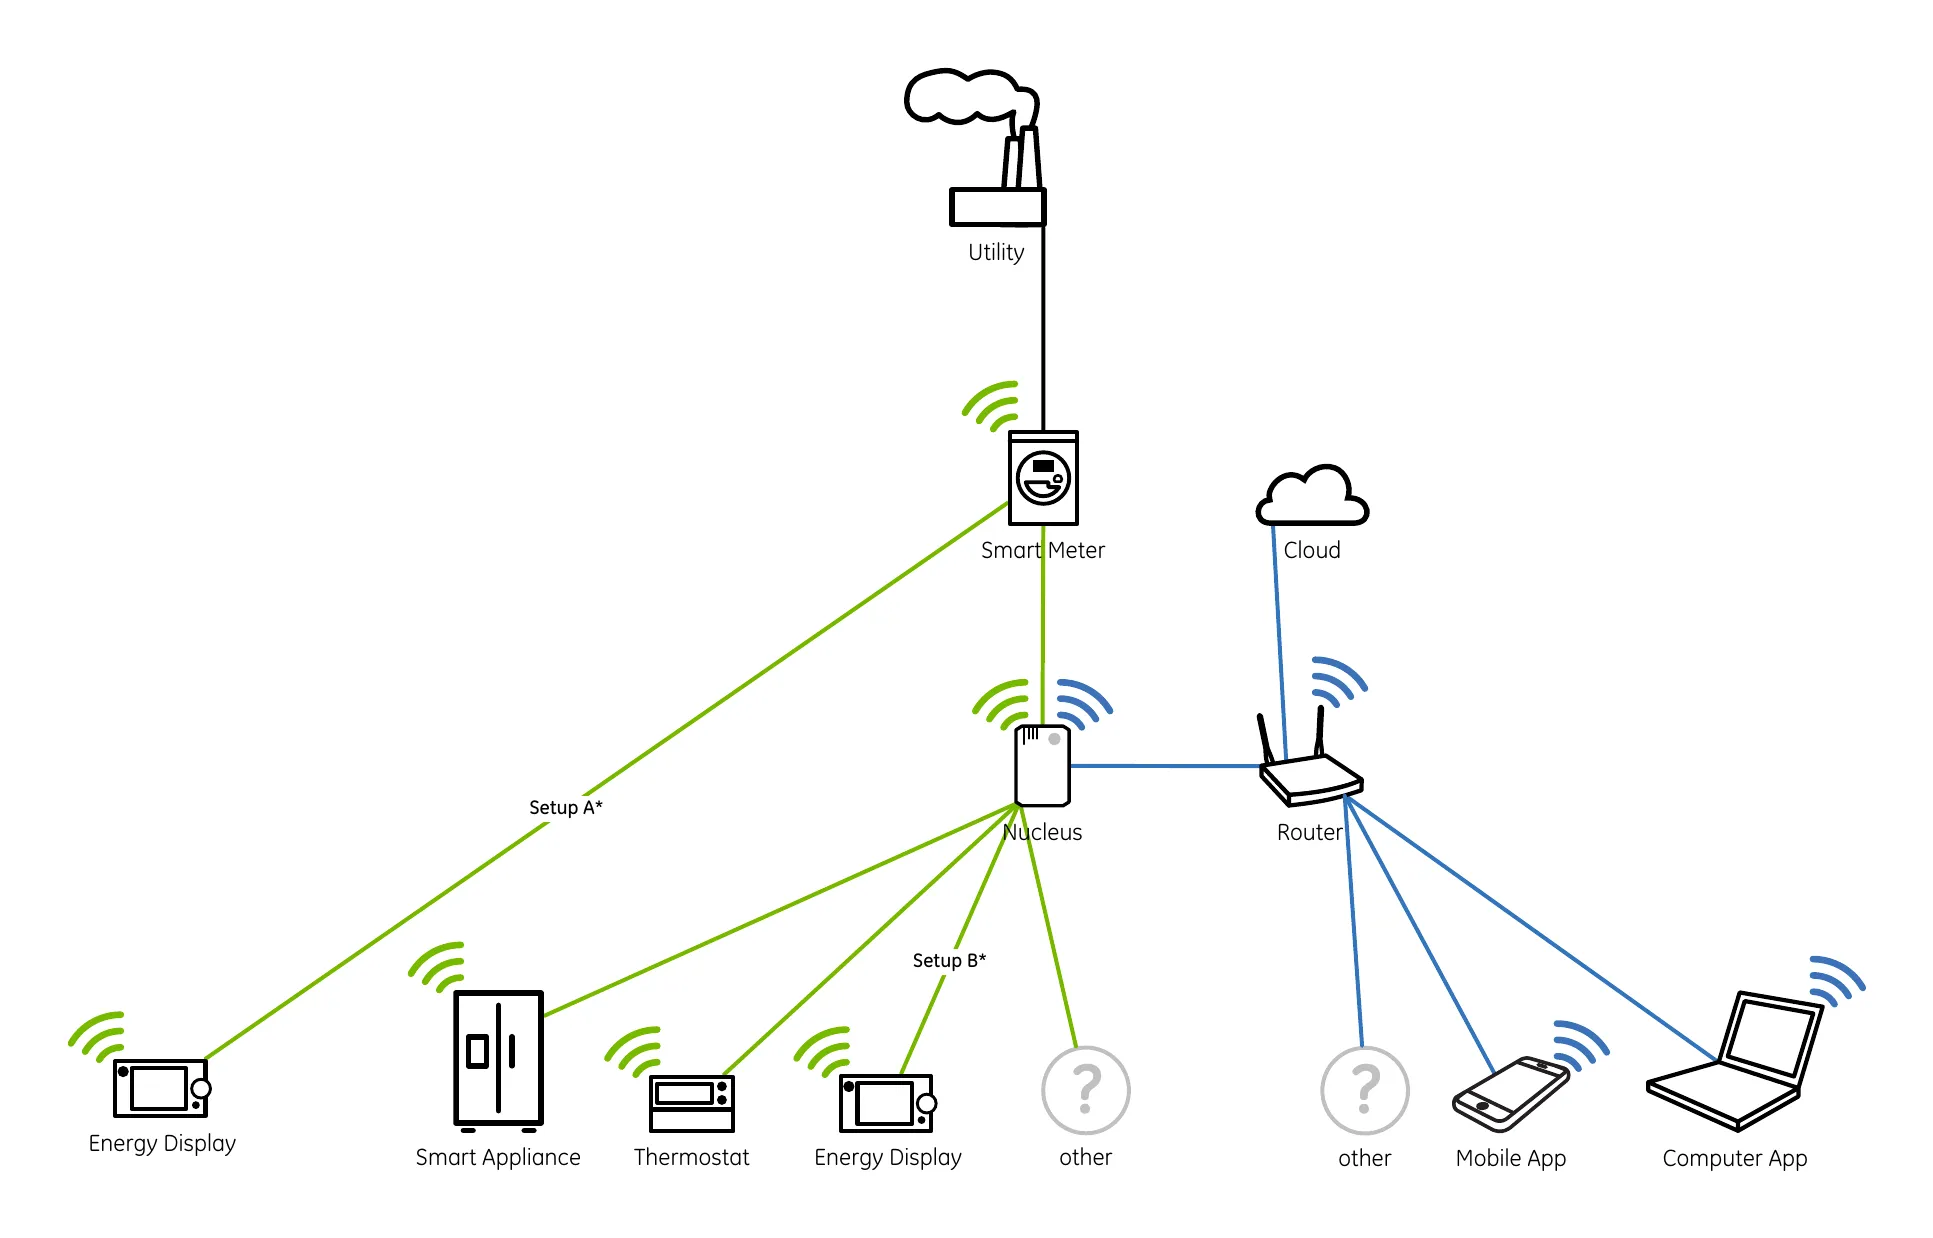
The Nucleus is a tiny computer that aggregates home energy information from attached devices, then provides insights to that data through network connected applications. This form allowed the team to optimize the hardware necessary to collect usage data and focus interface design efforts on web and mobile platforms. The software evolved through both qualitative and quantitative research with users at home, online, and in our lab.
A concept film for connected services, made in just over a week: storyboard, script, voiceover, shoot and wireframes. I used it inside GE to show what a water heater that could talk to the Nucleus would mean; the poster frame is a GeoSpring heater being fitted in the studio.
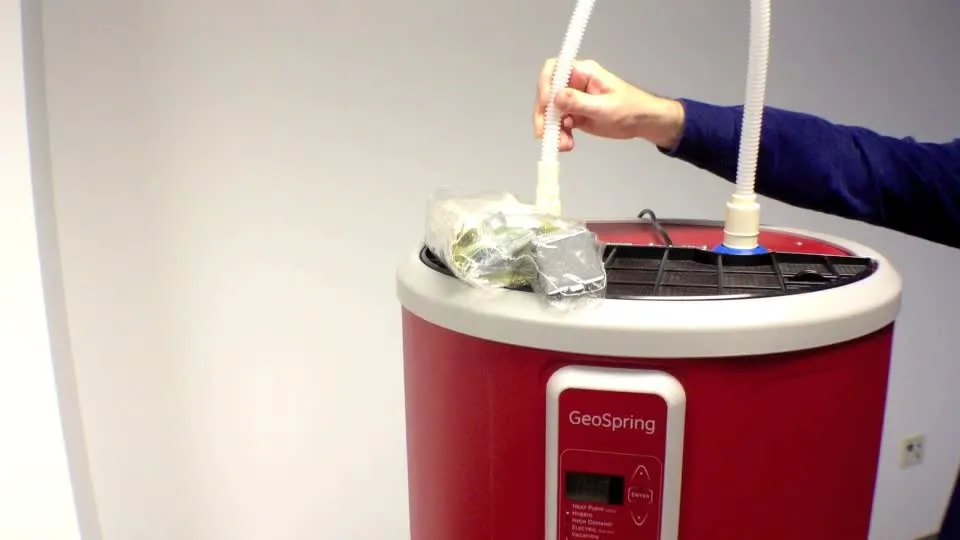 Video, 5:12
Text equivalent: Mark's water heater is reaching the end of its life. He wants to get a new one that will save him money on his energy bill while meeting his household demands. Mark thinks GE's GeoSpring Hybrid Electric Water Heater is a perfect fit. With a bit of online browsing, he finds connectivity possibilities through the GE Nucleus, particularly the ability to set an energy saving vacation mode and receive service notifications to keep it operating smoothly. On the day of installation, the service technician connects the GeoSpring to plumbing and electrical wiring. Mark is provided with the new Nucleus and instructions on registering and connecting both products. Mark unpacks the Nucleus, plugs it into a power source, and connects it to his home router. The lights turn on and flash to let him know the device is operating, but not connected to his appliances. He pulls out his iPad and visits geid.com. The initial screen greets him with the option of logging in or creating a new account. This is Mark's first time to the service, so he creates an account using his email address and password. The site welcomes him to GEiD, and prompts him to start by adding his GE products. Pressing the Add button, Mark enters the Nucleus model and serial number off the registration card, including his address and install date before pressing “Send Registration”. After a moment, the interface confirms that his Nucleus is now ready to be used with his account. The lights on his Nucleus change from flashing to a steady glow. Mark's GEiD has its first product registered. While he's reviewing the Nucleus product page, he's able to adjust configuration, access the user manual, and post questions to the community. At the bottom of the screen, new messages arrive in the product Timeline. The first is a notification confirming a successful setup with the date and time marking the start of his product warranty. The second Timeline event is his auto-subscription to the Nucleus community. Mark taps on this event, and it tells him that when new Nucleus discussions occur, he will see them show up in his Timeline. If the topic interests him, he can choose to follow the discussion and receive all the community responses. To set up the GeoSpring, Mark once again presses the Add button. On the registration screen, Mark notices he can scan the product's QR code, saving him time from manually typing in the model and serial numbers. Finding the GeoSpring rating plate, he holds up his iPad and scans the QR code. The code is translated and displayed with his previously entered address. Mark confirms the install date and presses “Send Registration”. After a moment, registration is confirmed. The interface asks if he would like to connect the GeoSpring to the Nucleus associated with his GEiD. The unit requires an appliance radio module, which is included with the Nucleus and GeoSpring bundle. He presses the “Bind to Nucleus” button and views the instructions particular to his appliance. He starts by connecting the GeoSpring and radio module with the included cable. The light on the radio module flashes to let him know it's powered, but not yet communicating with the Nucleus. Mark scans the QR code on the back of the radio module and presses the bind button. The light now pulses while searching for the Nucleus. The interface confirms that the GeoSpring has connected with the Nucleus. The lights on his radio module change from pulsing to a steady glow. Completing the GeoSpring setup, Mark reviews the notification options and adds his mobile number to receive SMS alerts. He's pleased by the simple configuration and thoroughness of the appliance alerts. The GeoSpring appliance interface is similar to the Nucleus interface Mark saw earlier, but has controls and information particular to the appliance. Mark can set the water temperature, change to vacation mode, and see appliance energy use. Similar to the other appliance page, he can view the user manual, check warranty info, schedule service, and post questions to the community. The GeoSpring’s Timeline has three new items including the install date, a test appliance alert, and a reminder that he is now subscribed to the GeoSpring community. Navigating back to the GEiD homepage, Mark sees a master vacation mode control and information on his overall home energy use for the products he has connected to his Nucleus. He notices he can easily contact GE for service and navigate to specific appliances. The Timeline on his homepage collects all the events from his appliances in chronological order, and Mark can scroll through them, filter by categories, and search for specific terms. Mark feels in control without being overwhelmed. He doesn't have to hunt the web for information on his particular water heater, and adding additional products in the future is a snap.
The seven principles from the guidelines, each with the first line of its definition. They are the rules the widgets were built to, from customisable layouts to vector graphics that scale, and they are what let one system serve three screen sizes.
- Customizable
- The interface allows user preference in widget layout and facilitates new devices on the network.
- Flexibility
- The small, medium, and large application widgets allow designs appropriate to the amount of information and interactivity.
- Perceptual Grouping
- Using the gestalt concepts of proximity, similarity, continuation, closure, and symmetry, a particular interface should aim for less than 6 visual groups.
- Scalability
- Interface graphics are vector-based and/or code-generated.
- Direct Manipulation
- The interactivity relies on use of direct manipulation over other control styles.
- Consistency
- Similar display methods are kept common across devices while respecting the platform’s technical affordances and user context.
- Progressive Disclosure
- The commissioning process gently steps the user through adding products to their Nucleus system.
A short capture of adding a device to the Nucleus desktop. A new widget appears in the tray, and the small, medium and large sizes let it take the space its information needs; the transcript is my deck text for the sequence.
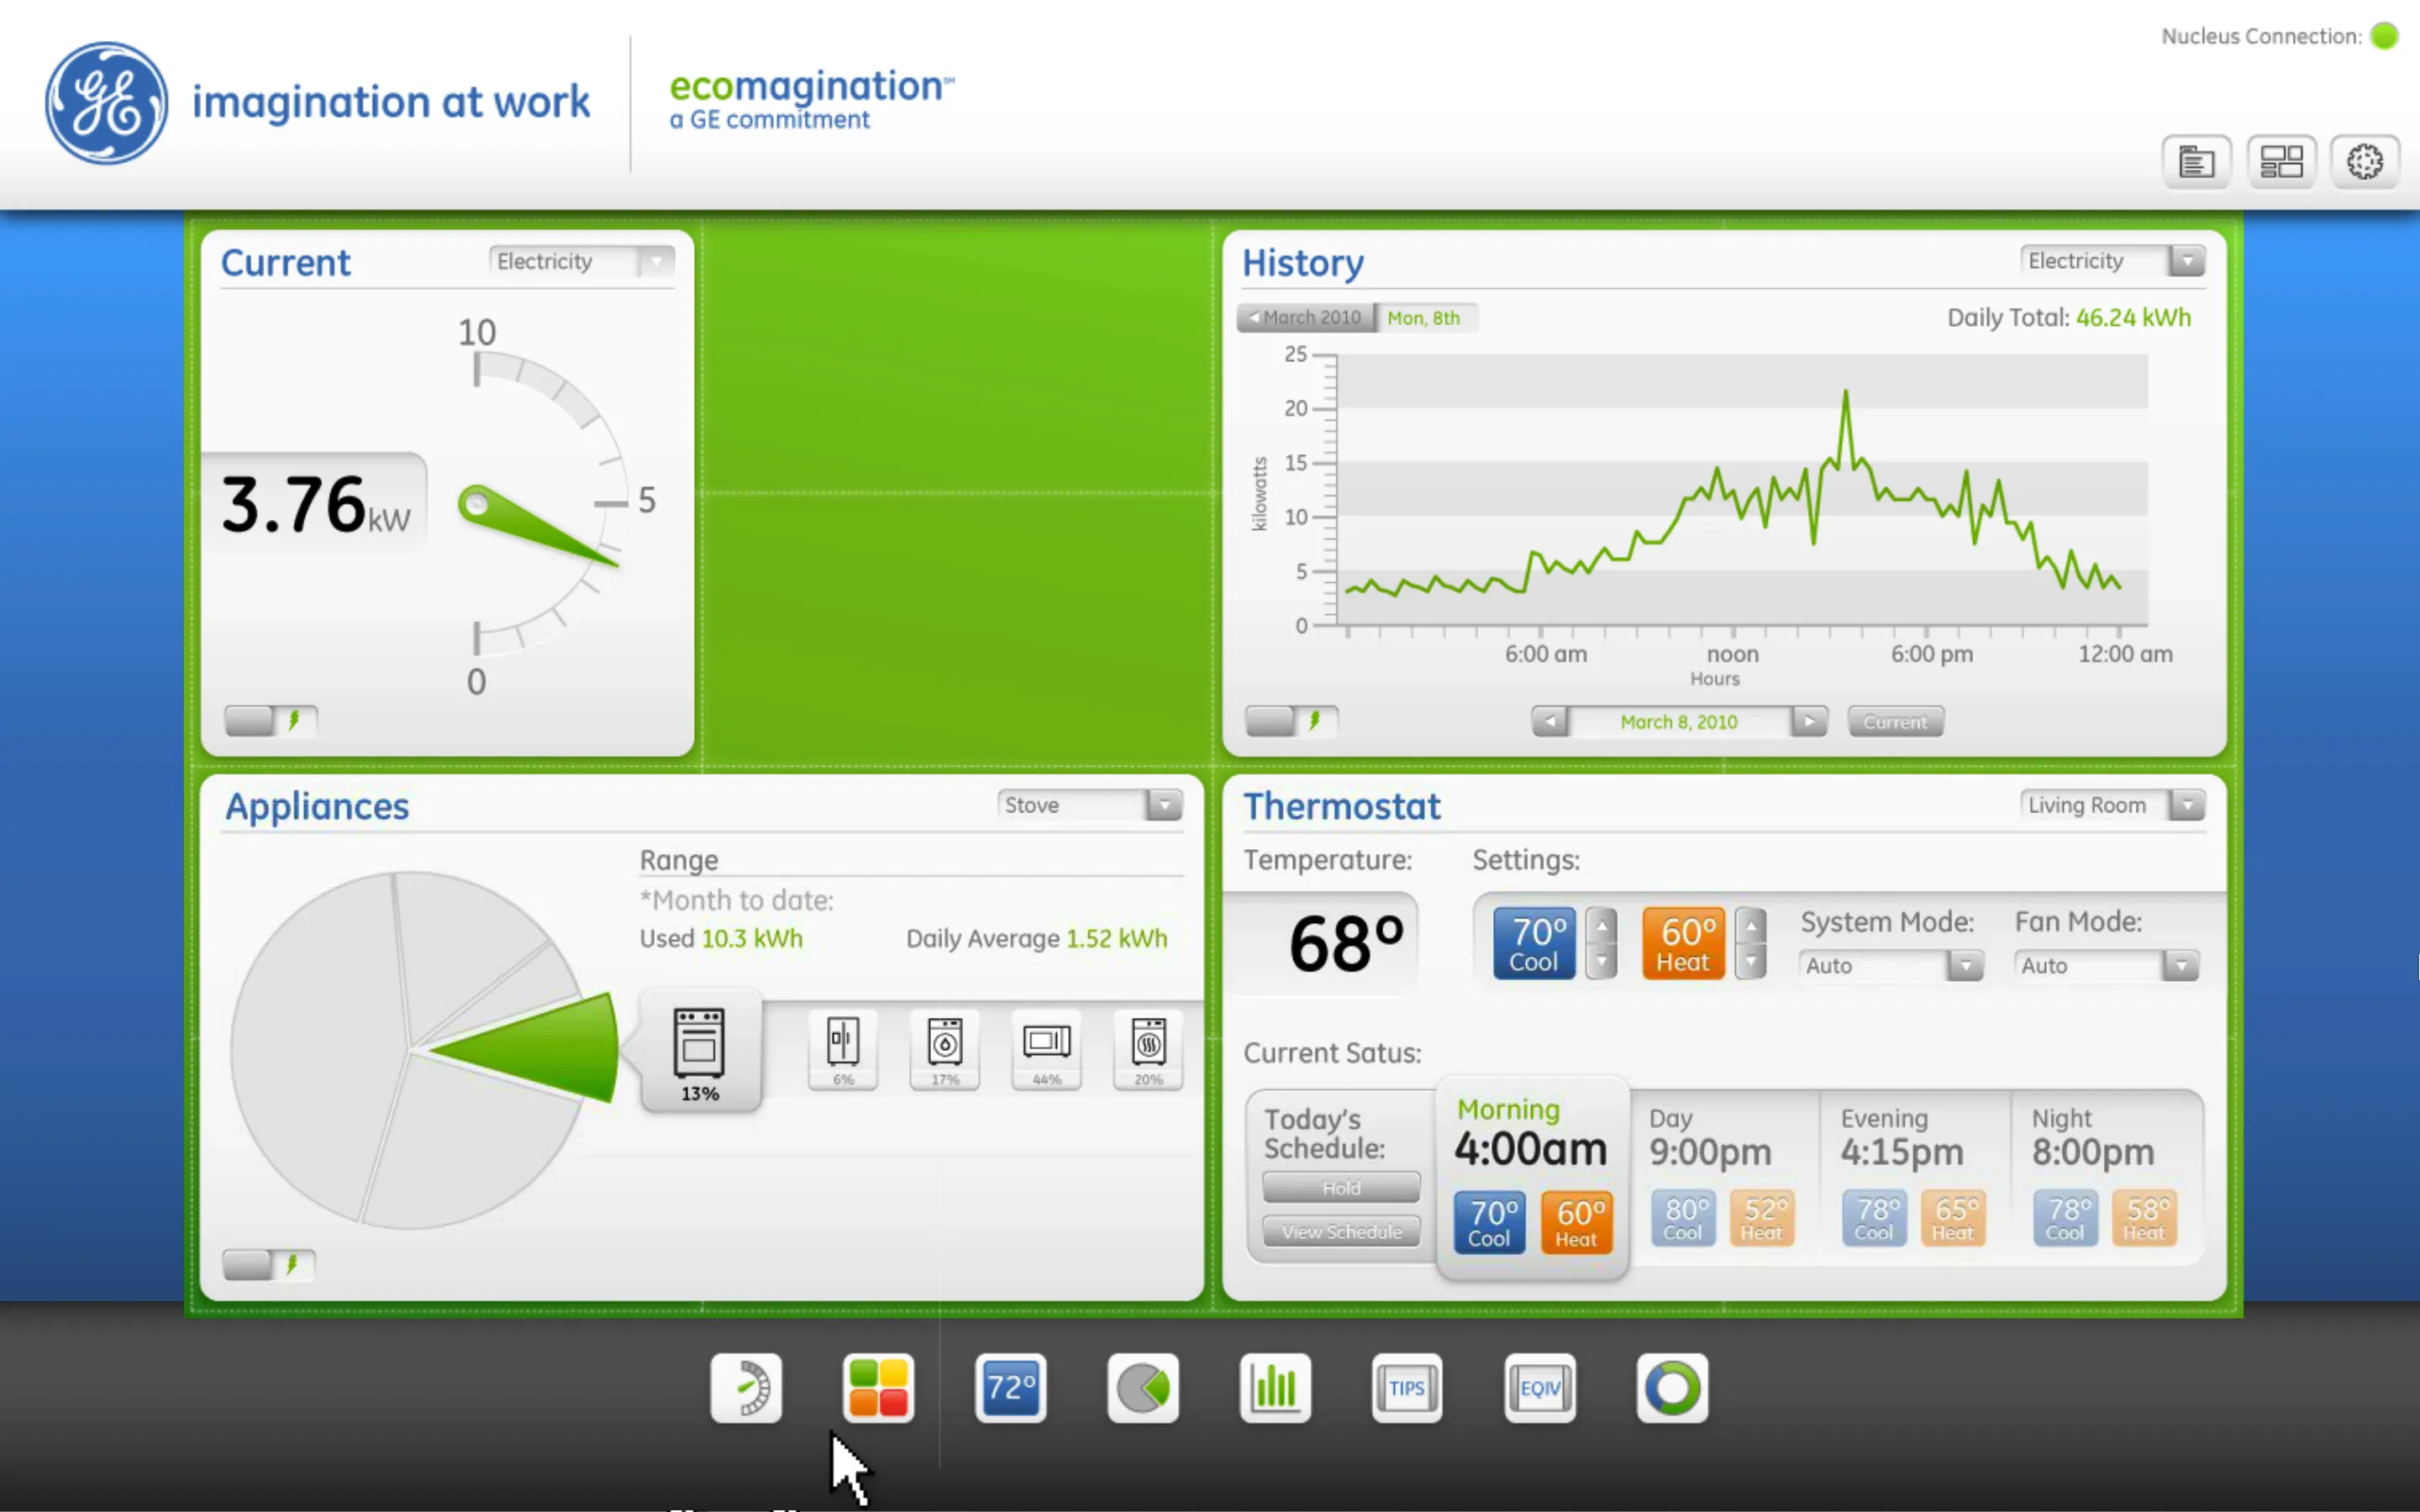 Video, 0:16
Text equivalent: When a new device is connected, its software widget is made available on both mobile and desktop interfaces. To match appropriate information with user-context, the team explored device sizes and layout options until arriving on a small/medium/large modular structure. Some widgets are expandable through multiple sizes and all can be rearranged as the user desires.
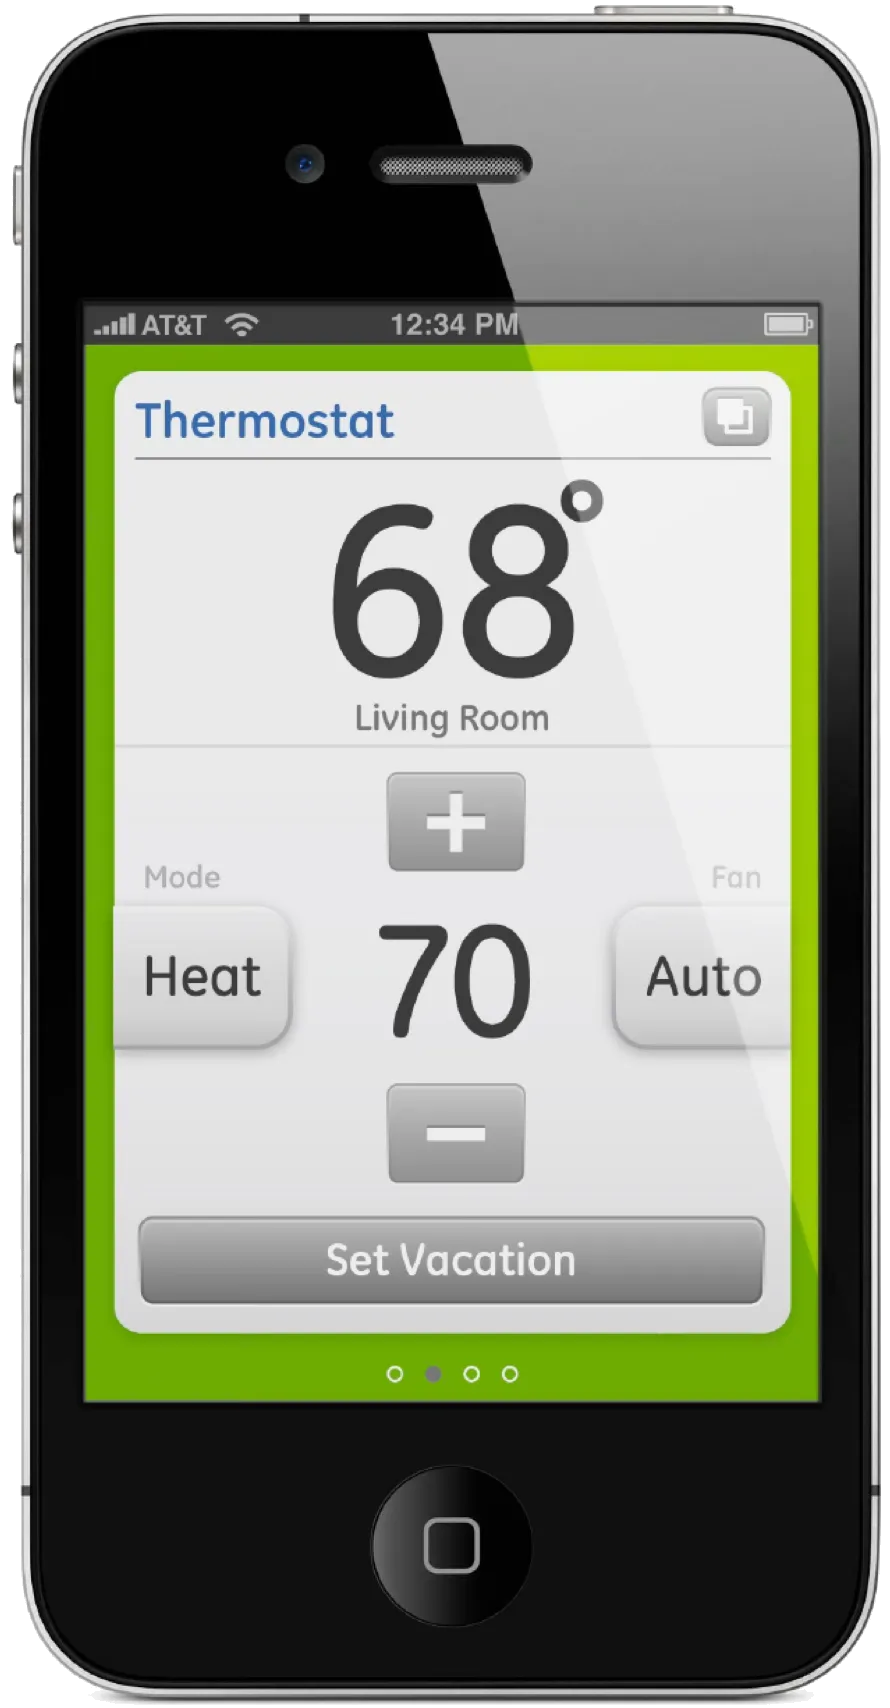
Six Nucleus desktop layouts in order, with the thermostat on the iPhone app beside them: the screen starts with one widget for the one product a home has, and fills out as products are added, up to resources, rate, appliances, thermostat and history together.
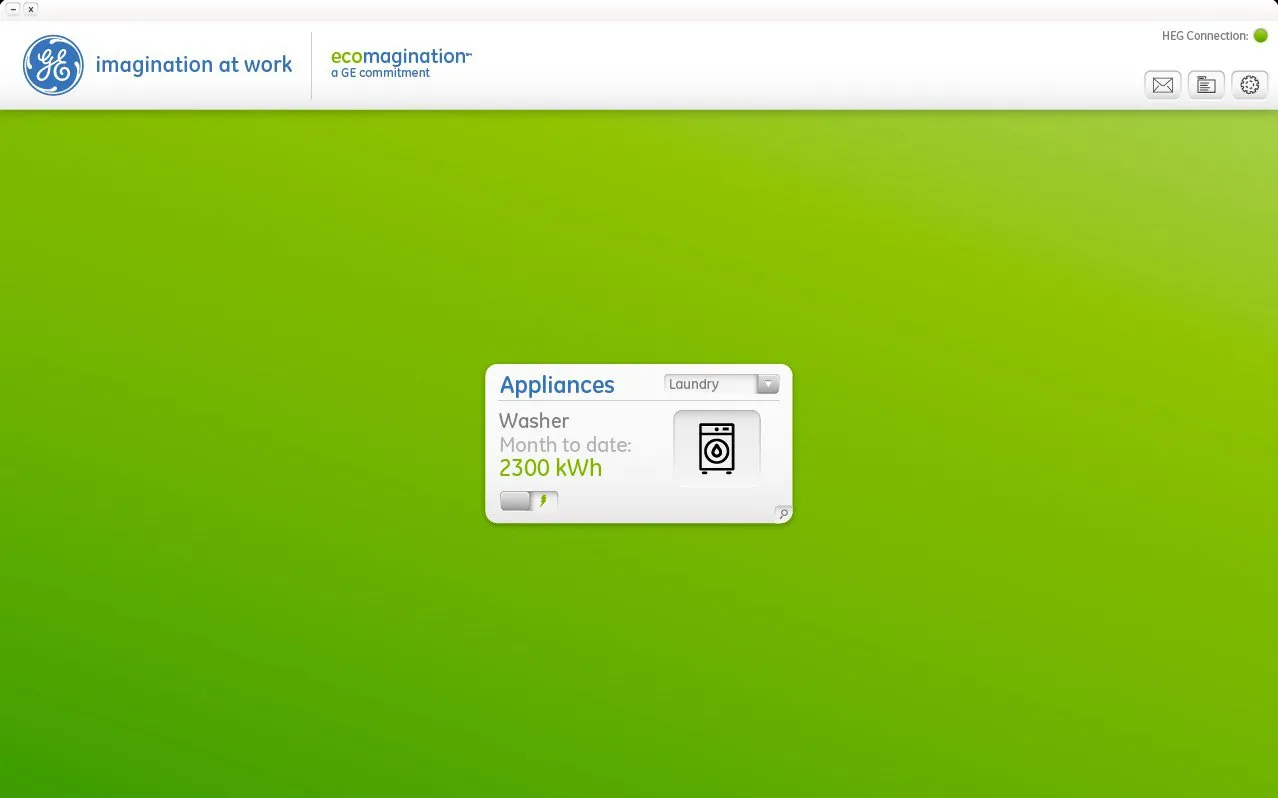
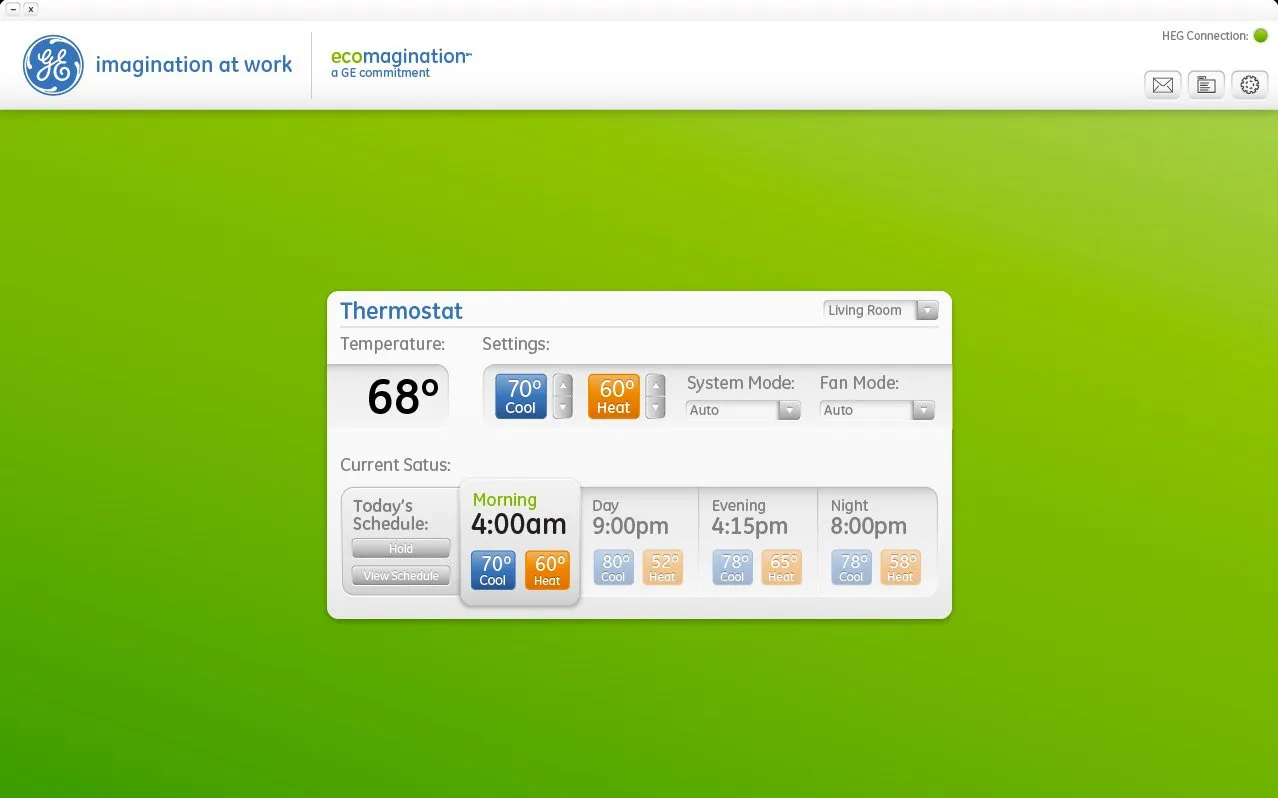
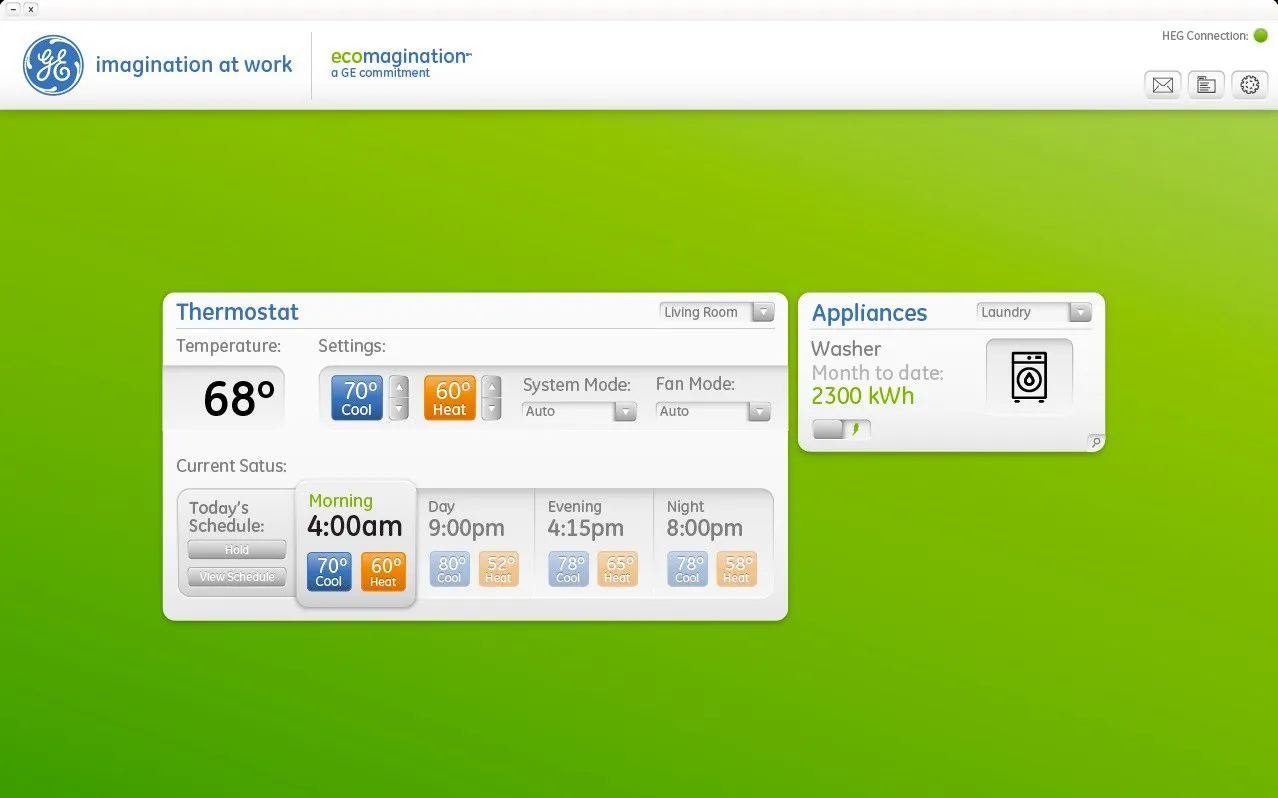
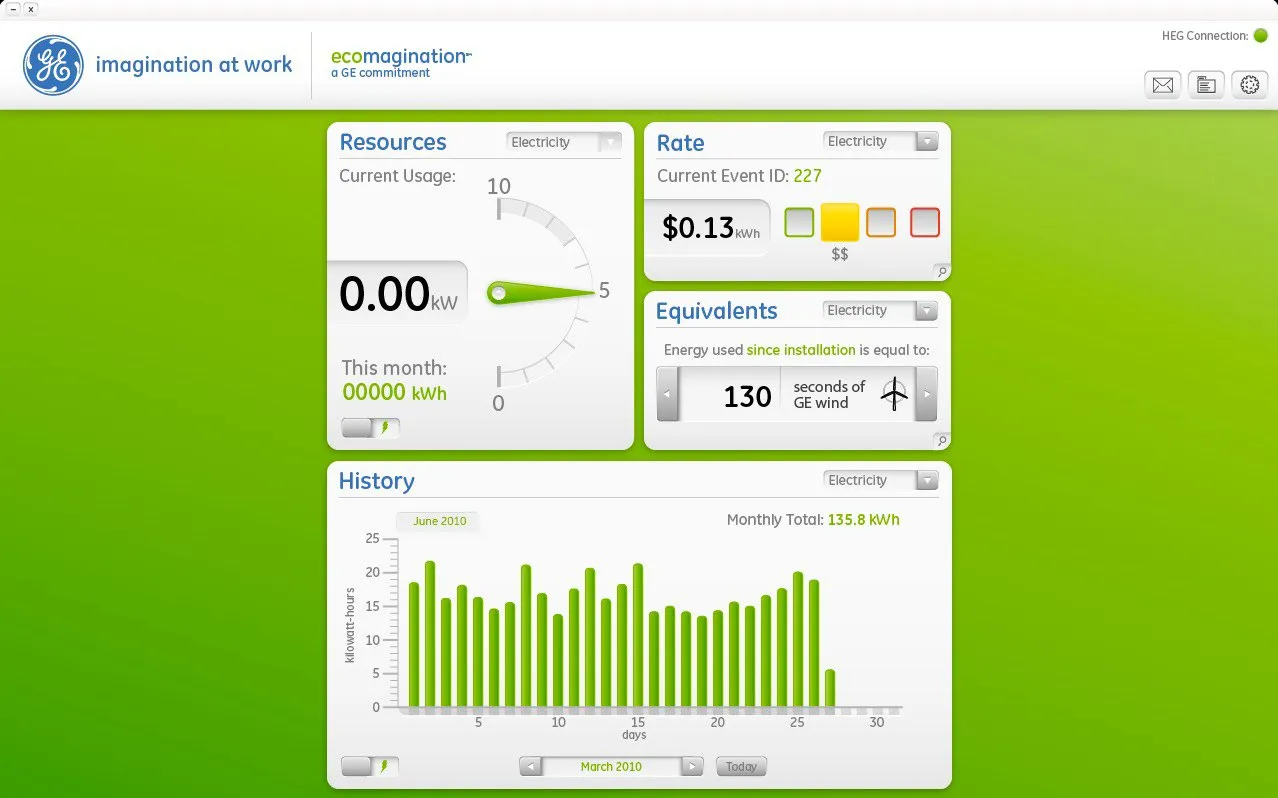
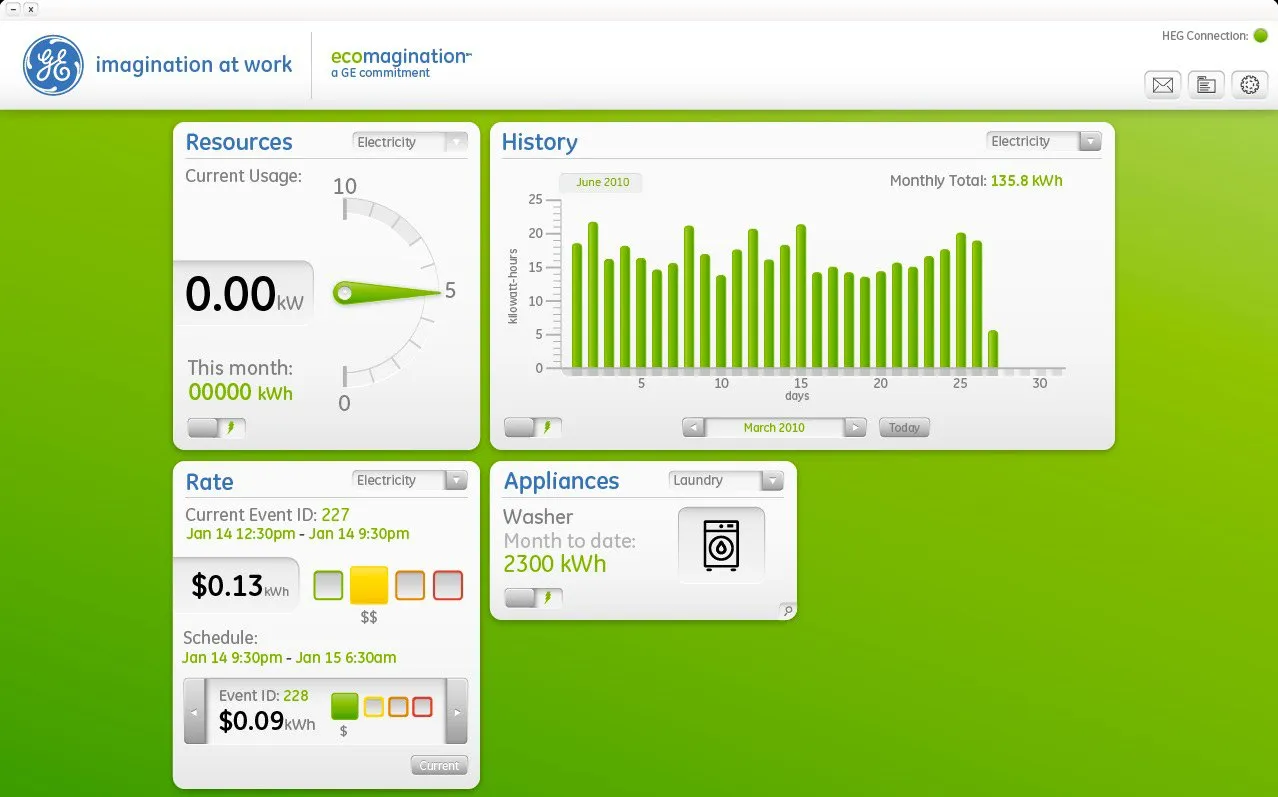
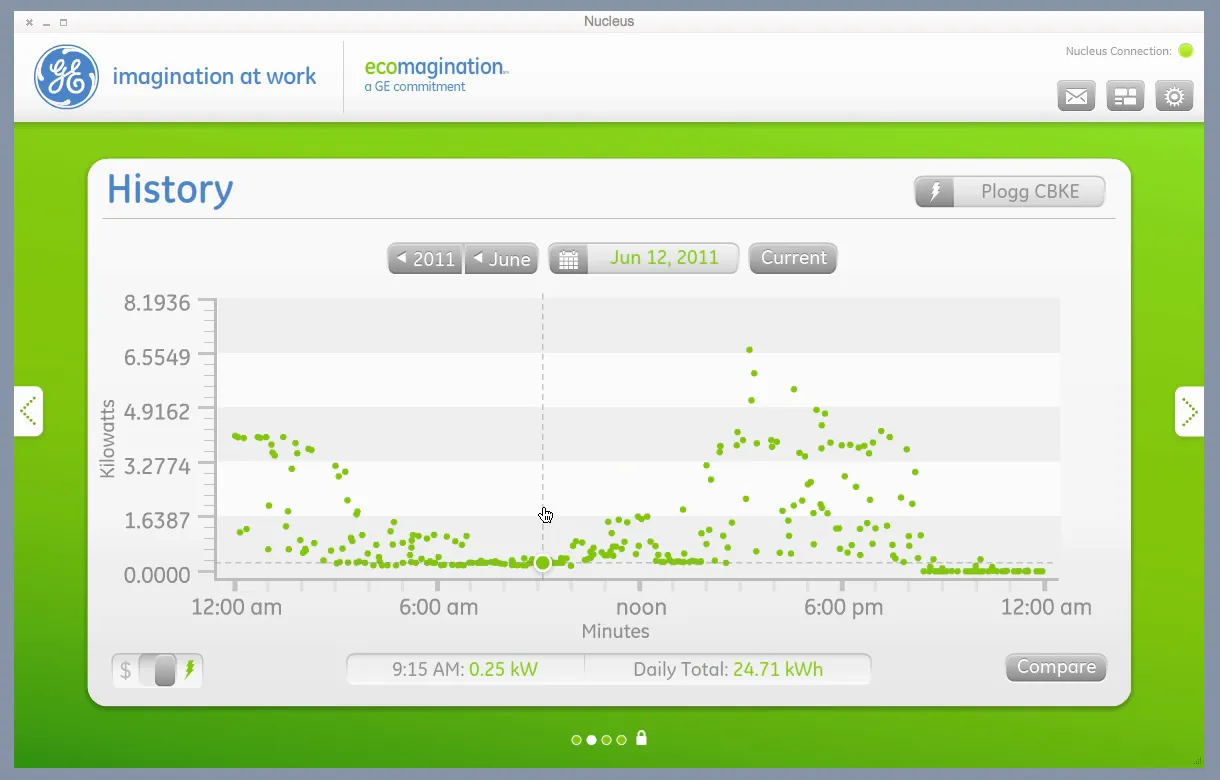
A capture of the History widget on the Nucleus desktop, scrubbing through a day of readings. The vector graphics, the transitions and the feedback during data calls were worked out here before they went into the design system.
 Video, 0:46
Text equivalent: The interface is developed in all vector graphics allowing crisp rendering at multiple screen sizes. Great attention was paid to transitions between screens and providing rich user feedback during API calls to the Nucleus device and the cloud. These details were tested in certain areas before being rolled into the greater design system definition and used broadly across the application.
The research behind the Nucleus: usability testing of the software and iPhone app, in-home and online research on its concepts, interviews with local families, pilot participants' feedback, and thermostat concepts tested with consumers.
Testing and feedback initiatives over 12 months
Usability Sciences
Tested iPhone app and Nucleus software.
IA Collaborative
Configuration concept tested with users. Concepts presented to users during in-home research.
User Insight
Tested functioning Nucleus software.
Stevenson
Tested Nucleus and Nucleus 3 interface concepts with consumers in an online survey.
GE focus groups
One-on-one interviews with local families on Nucleus 3 interface concepts.
Lextant
Feedback from pilot participants on software interface and appliance.
Ziba
Tested thermostat concepts and identified interface requirements.
Gamified energy
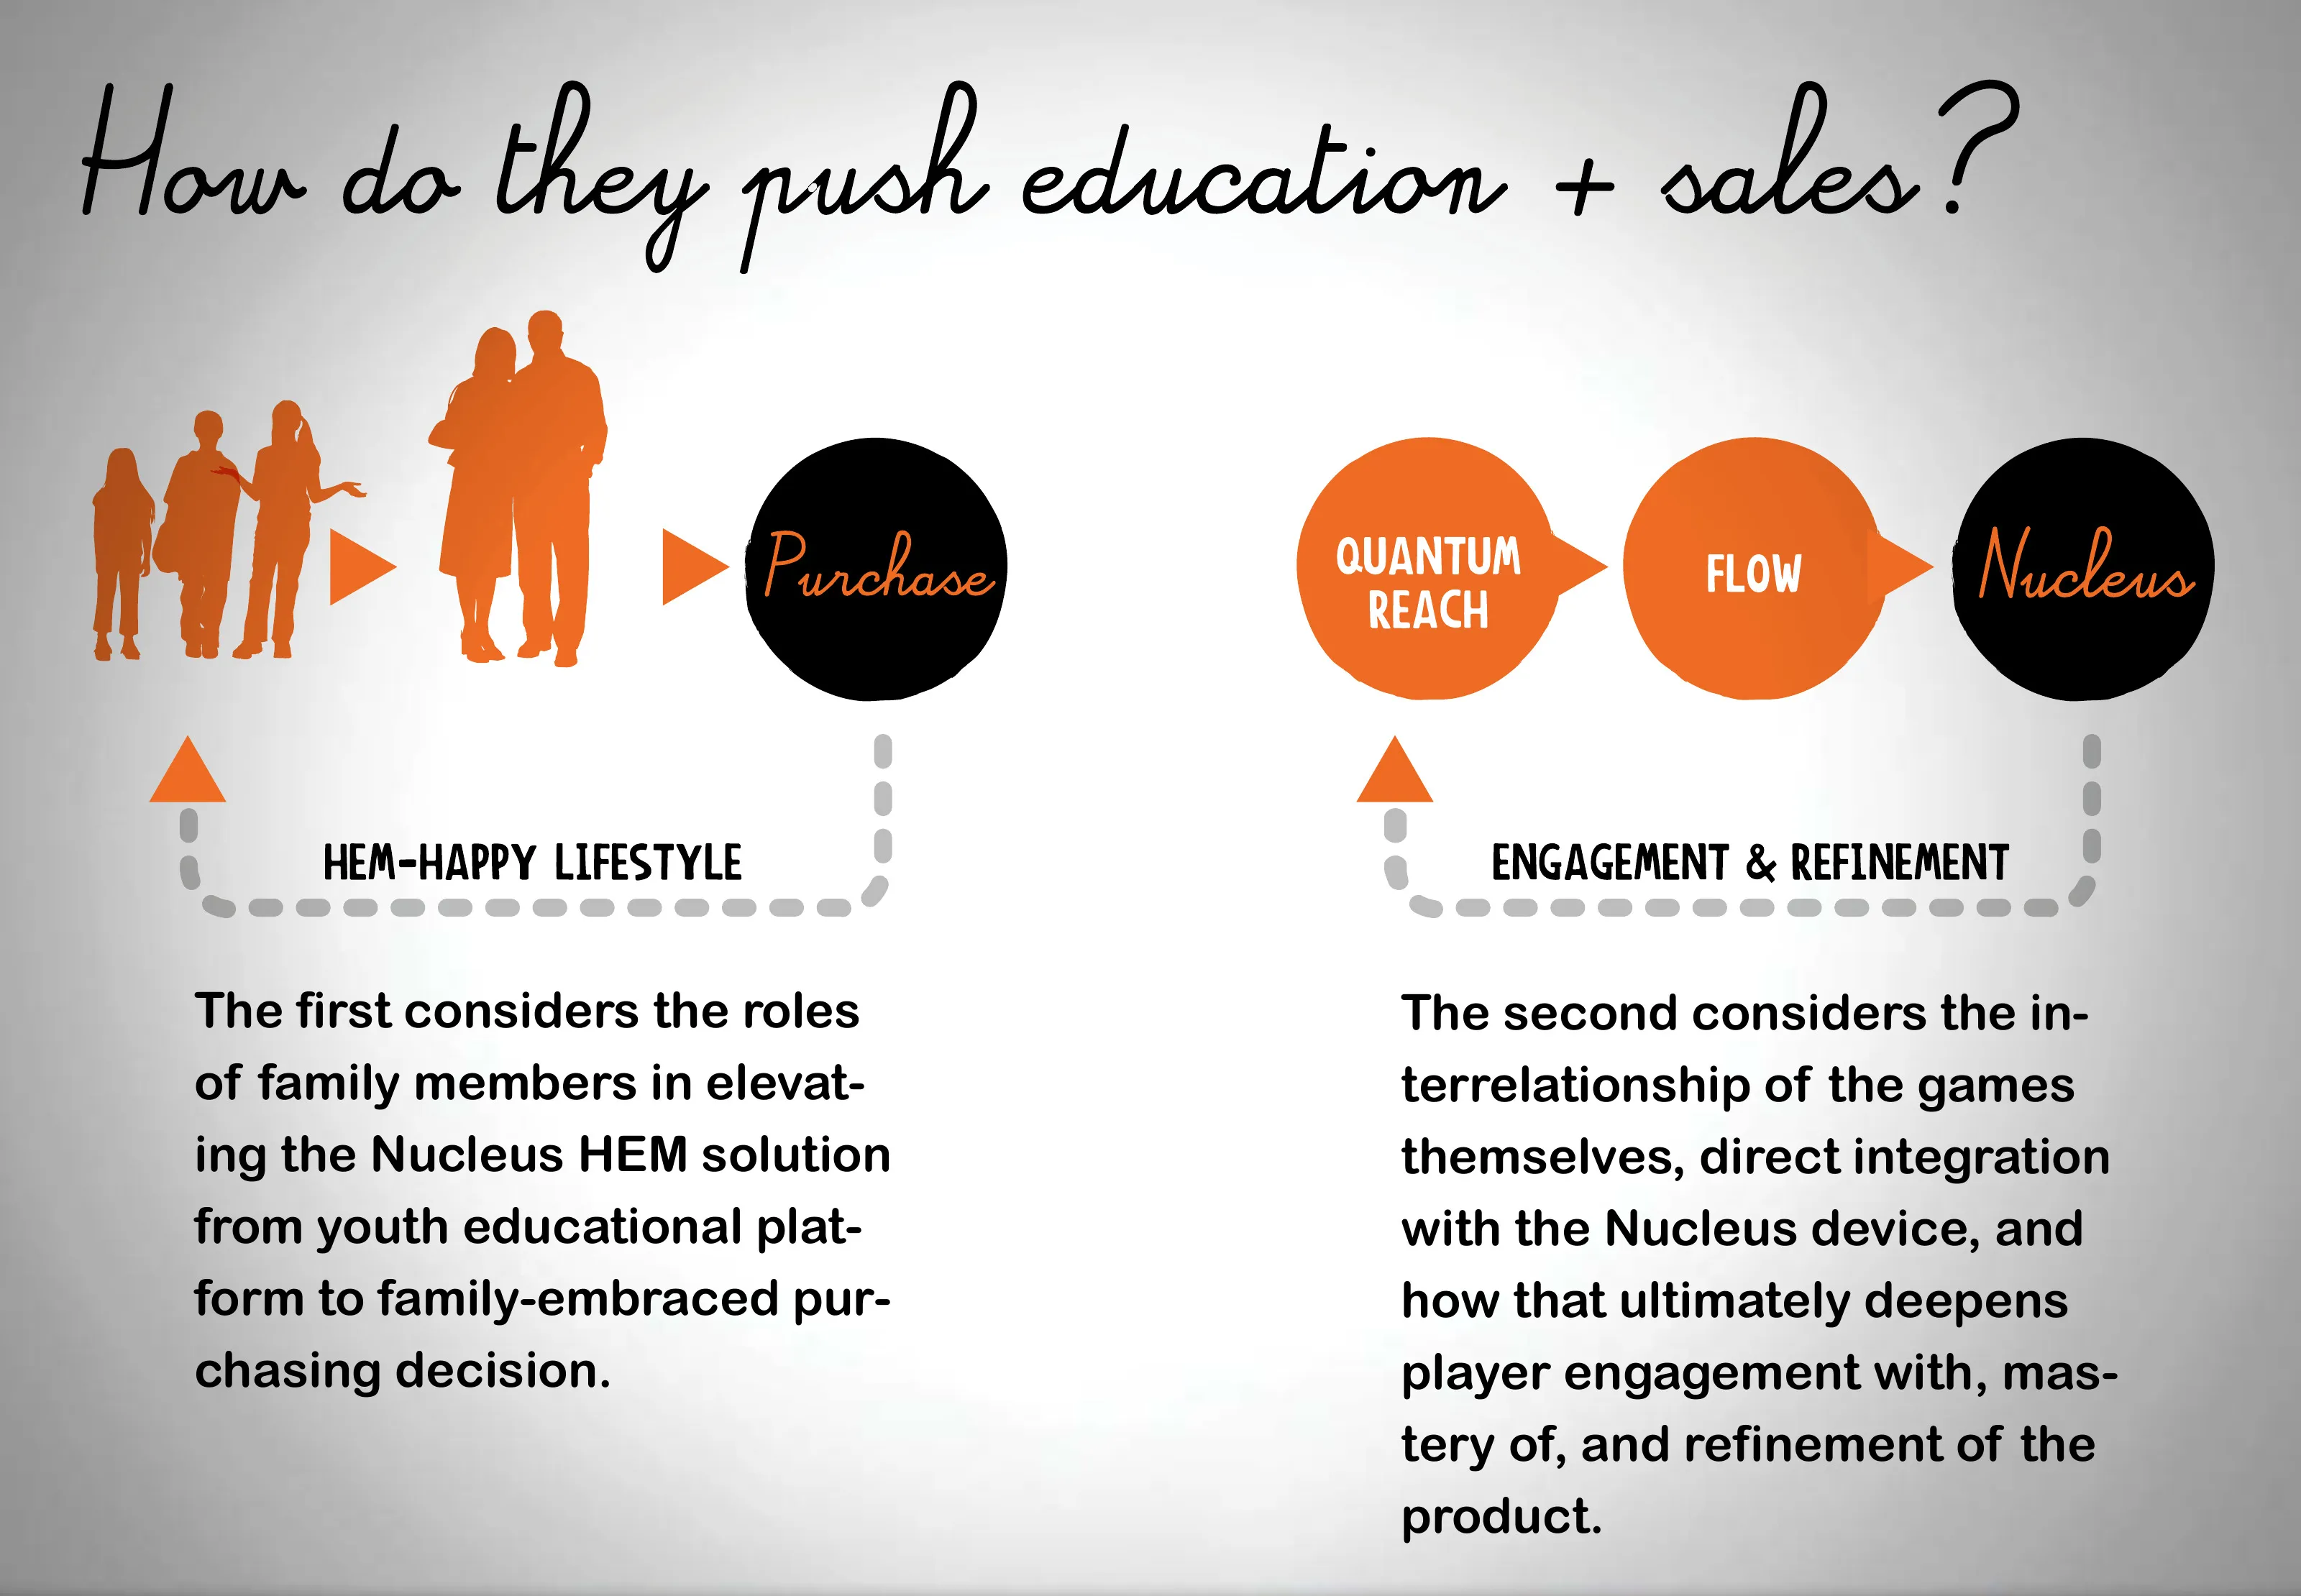
Natron Baxter's Openwork platform: two games, a mobile app and challenges around the Nucleus. I wrote the brief that started it, to make energy something a family would play with before and after they bought the product.
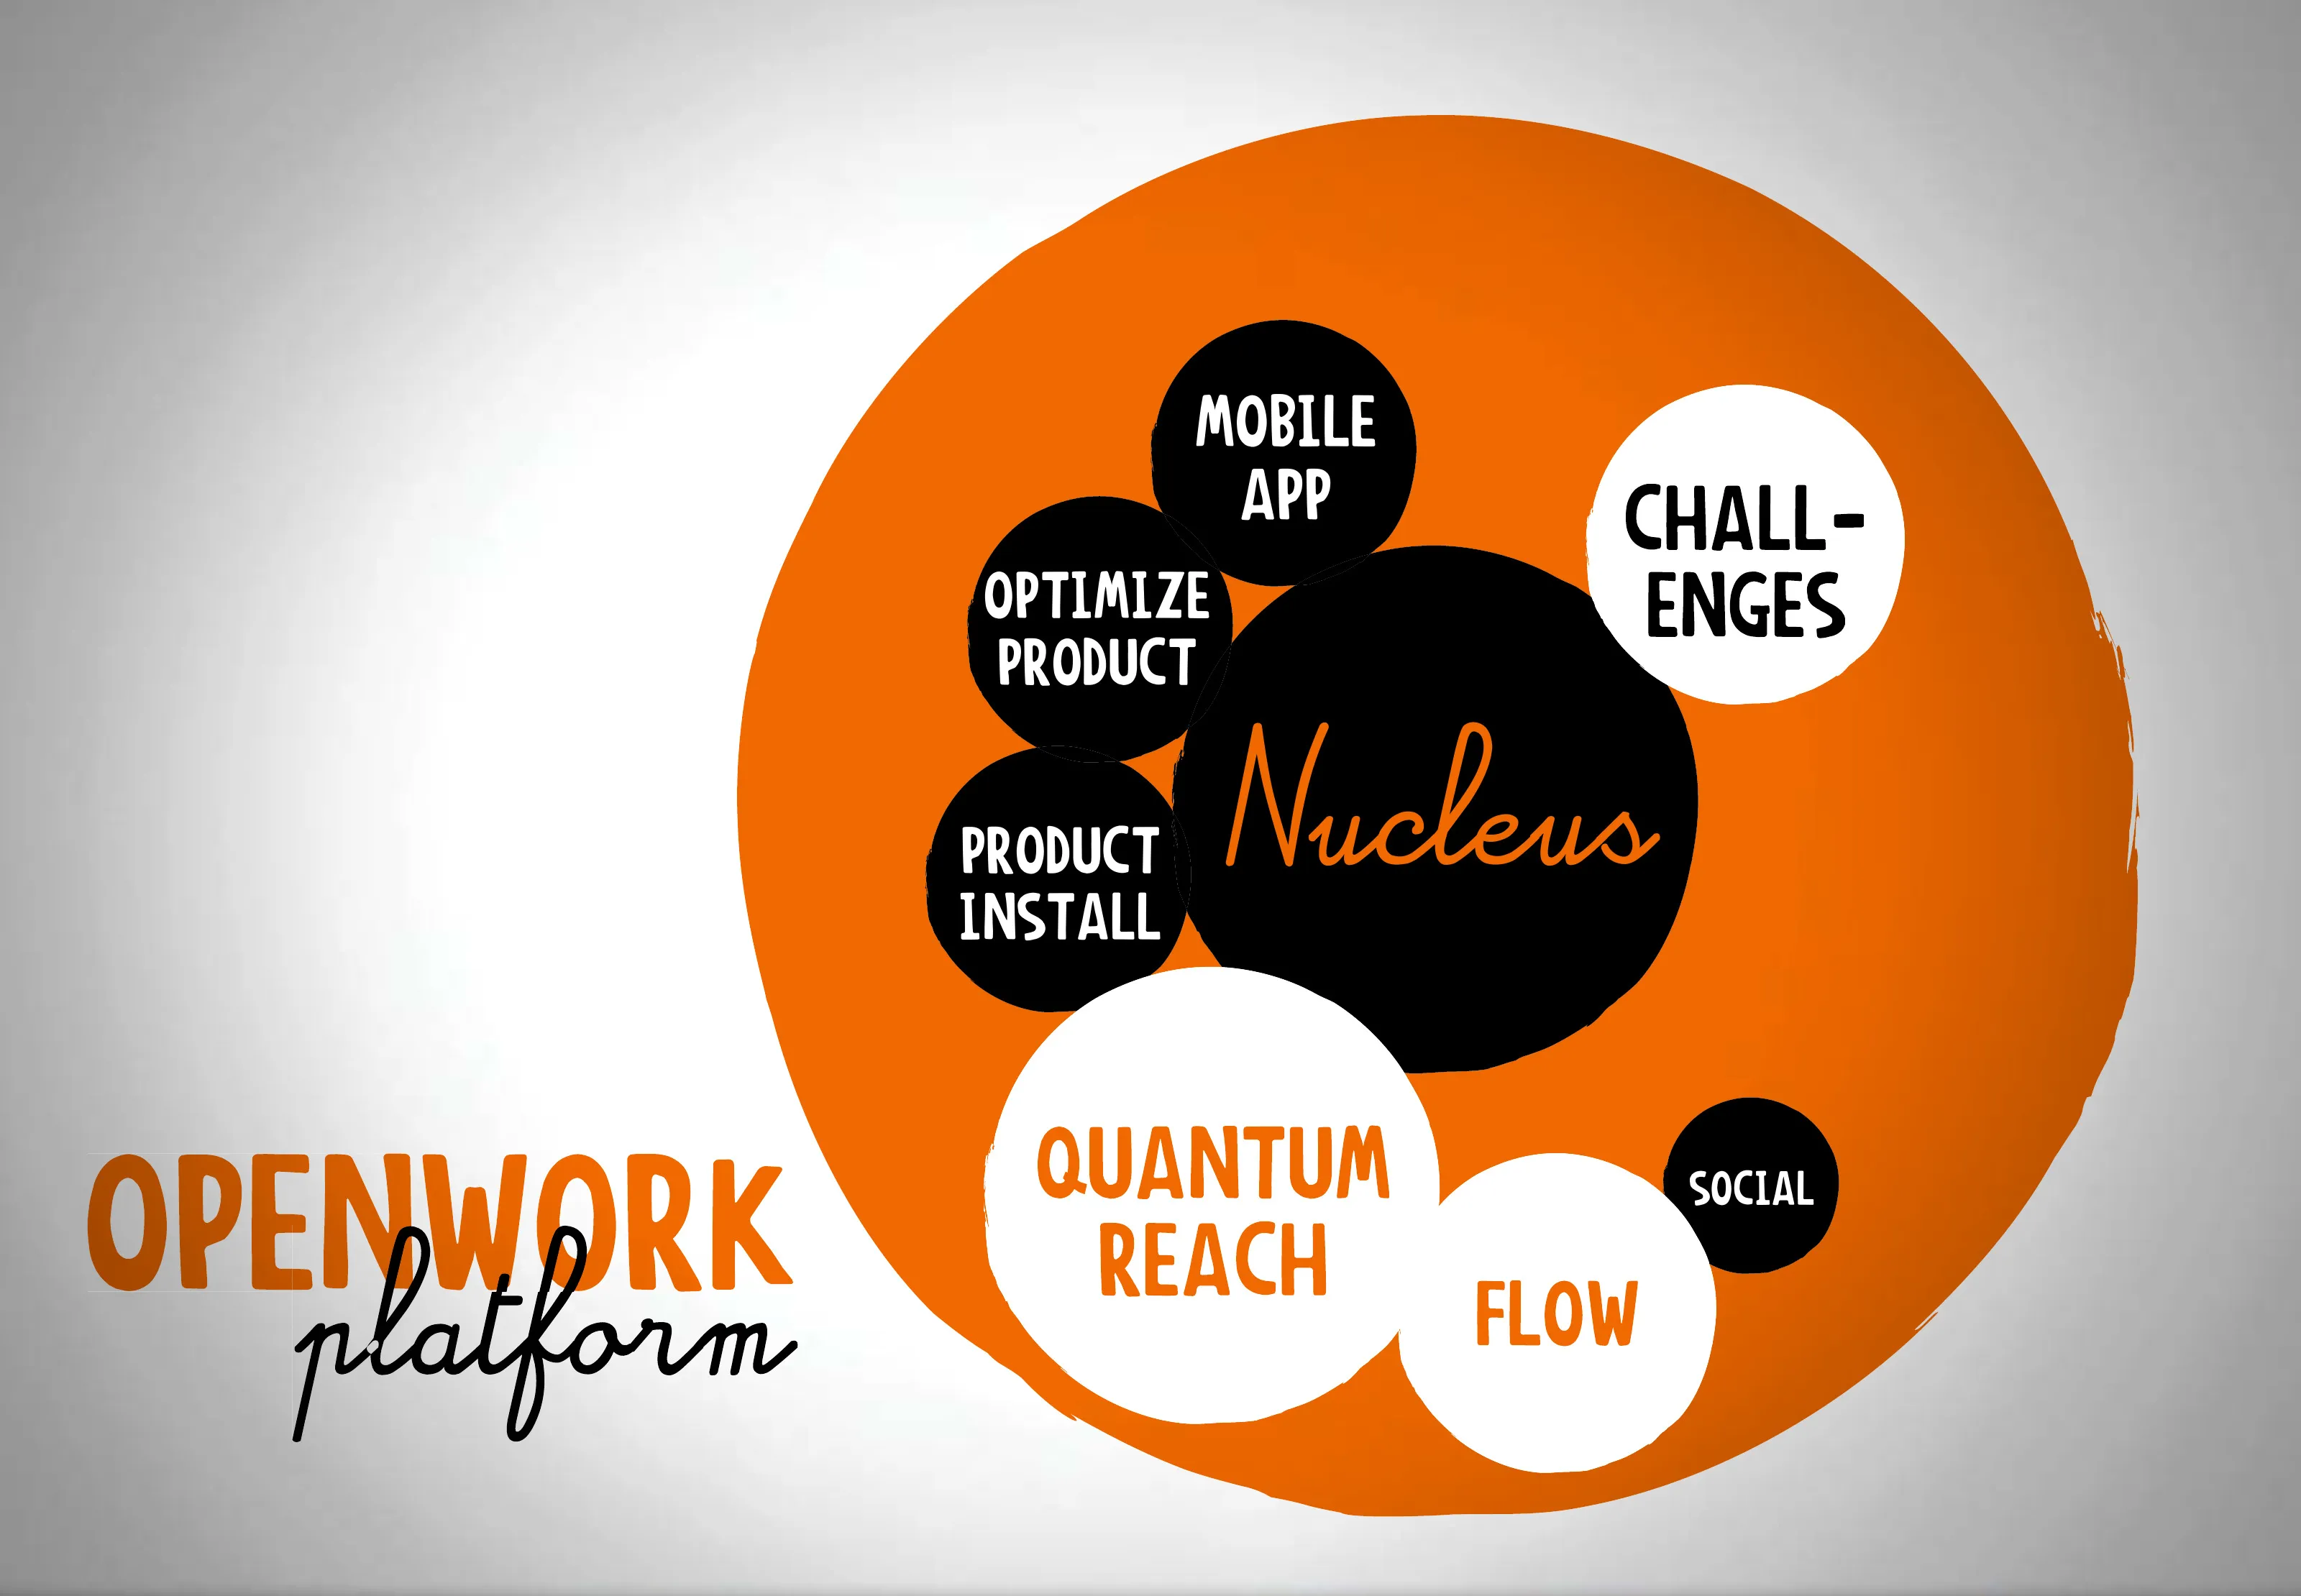
Most people never think about their electricity until the bill arrives. I wrote a brief for a social game that would start a family on an educational journey toward the Nucleus, then reward the habits that keep savings going once it was installed. Natron Baxter Applied Gaming designed two games and a platform, Openwork, around the device.
Two games Natron Baxter built for GE in 2011: Quantum Reach, an exploration game for nine to thirteen year olds, and Flow, a puzzle game for casual players on Facebook. Both ran on the idea that a household's real energy use could drive the game.
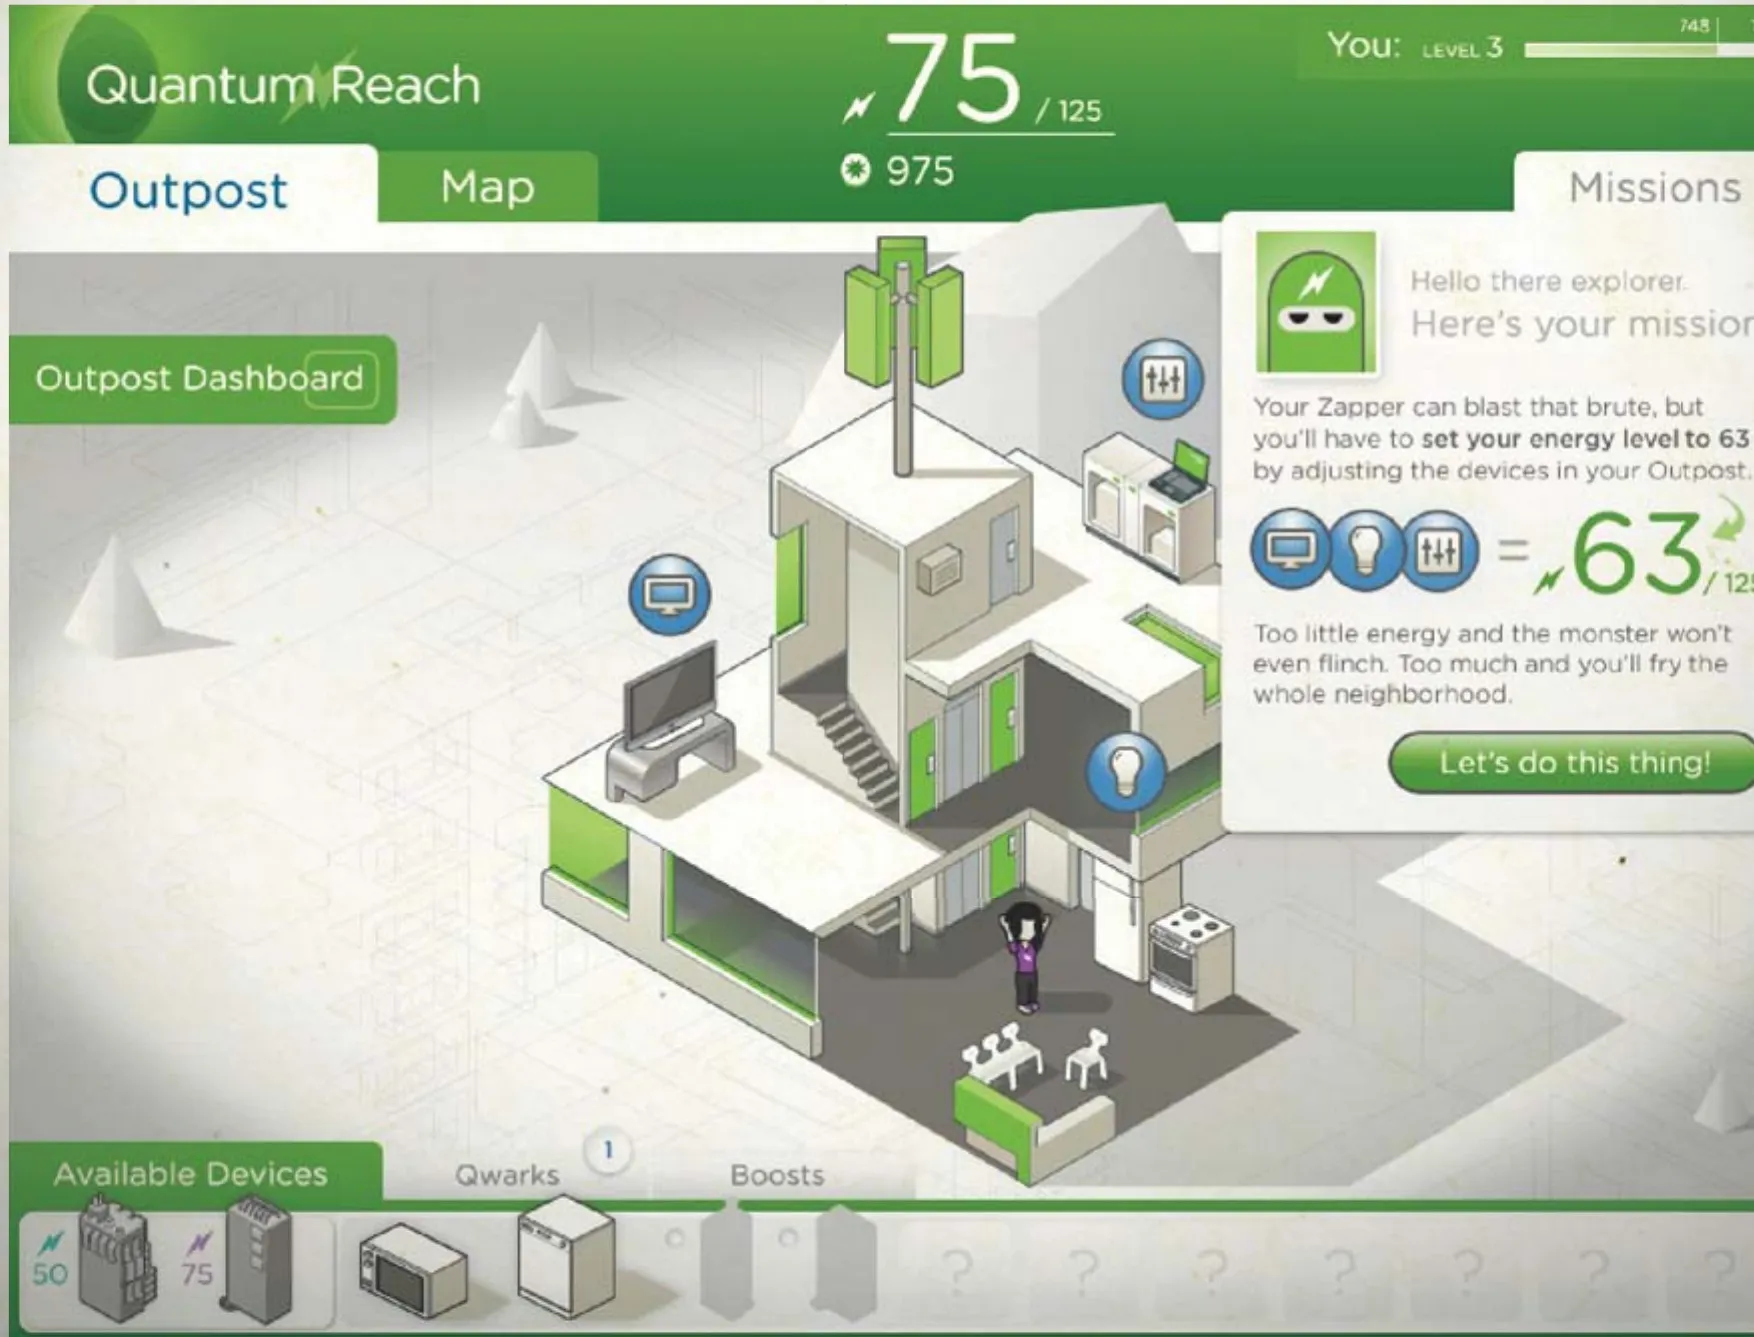
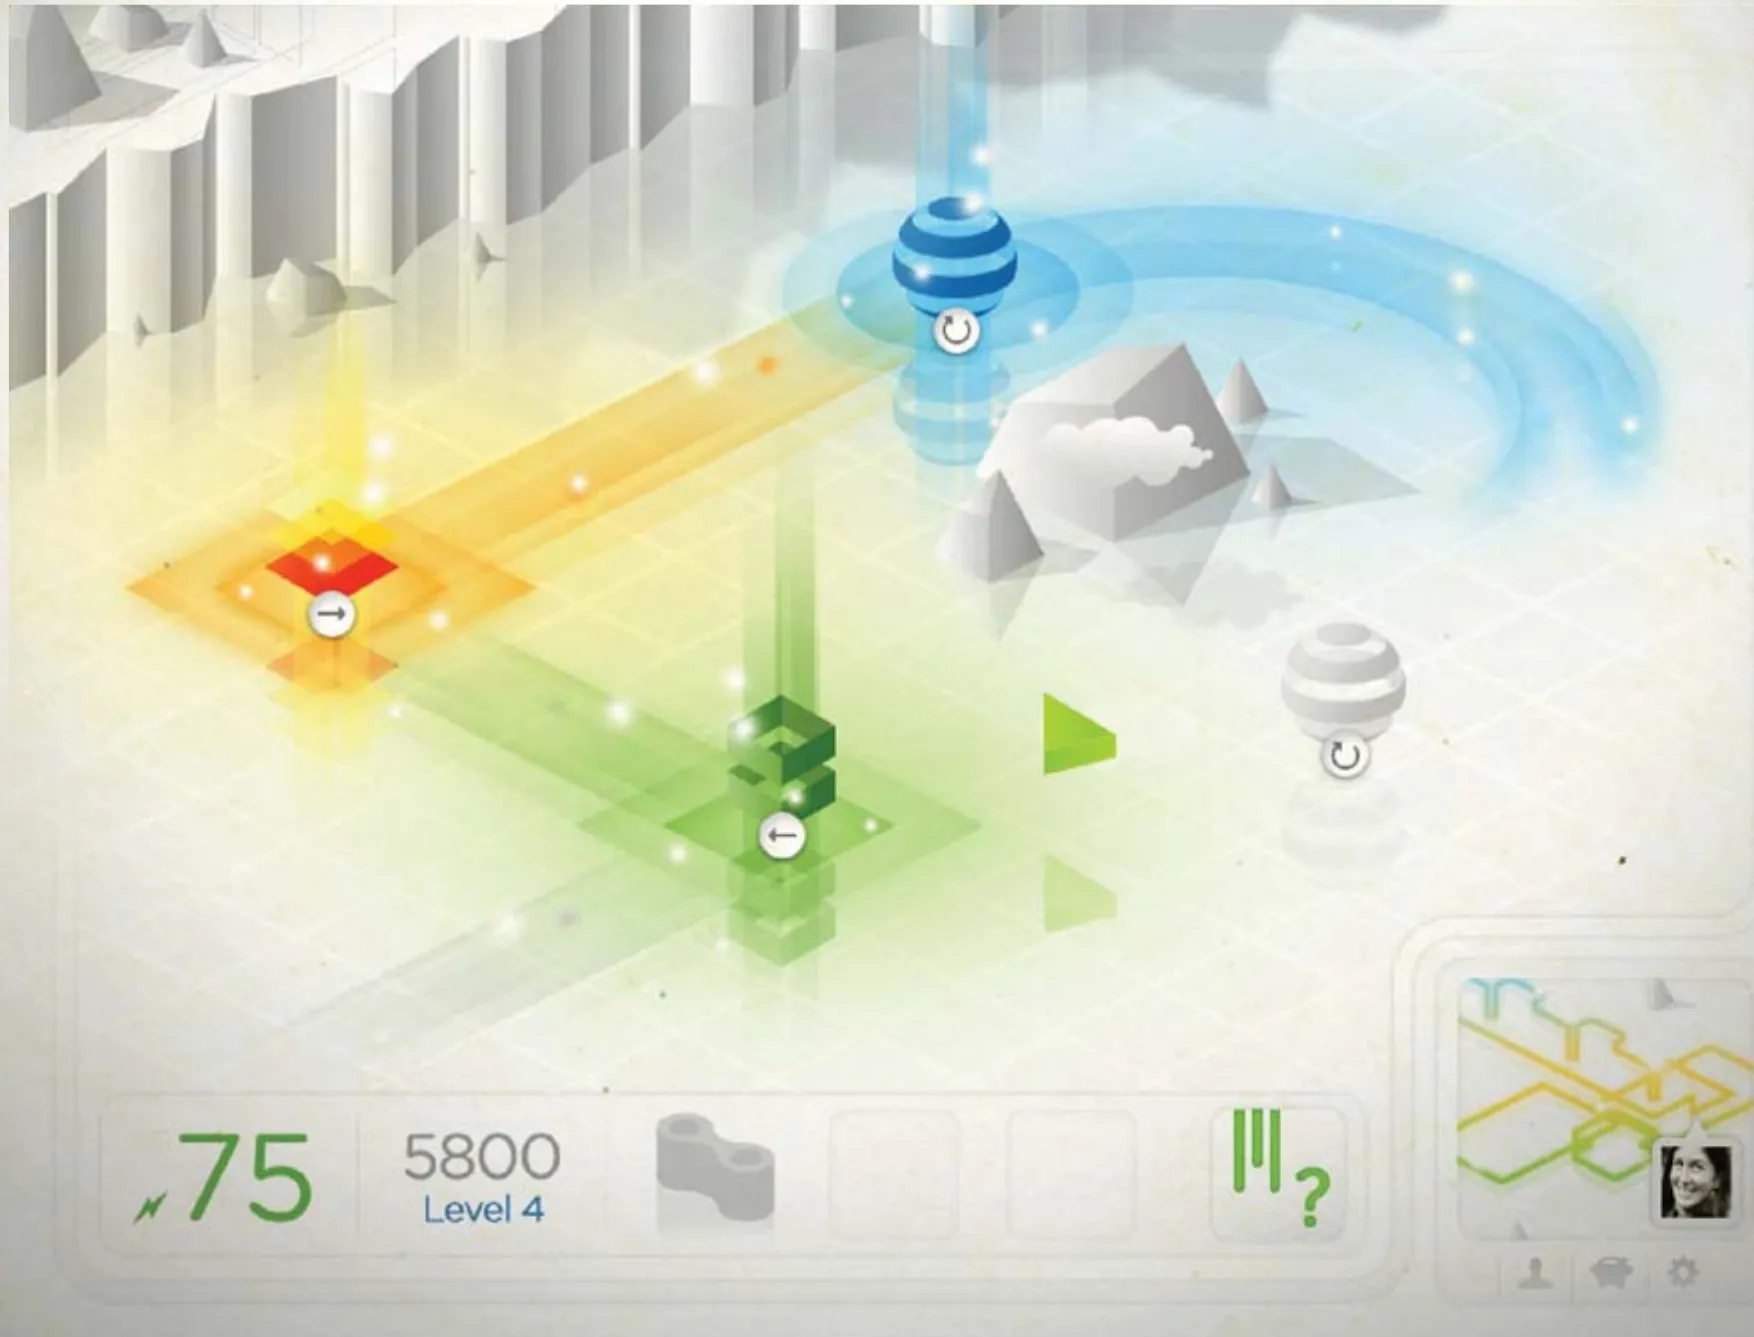
Quantum Reach, an exploration game for 9 to 13 year olds, and Flow, a puzzle game for Facebook.
Two pages of the Flow prototype specification: the household appliances disguised as game pieces, each with its real wattage, and the puzzle board where players route a limited supply of energy past them.
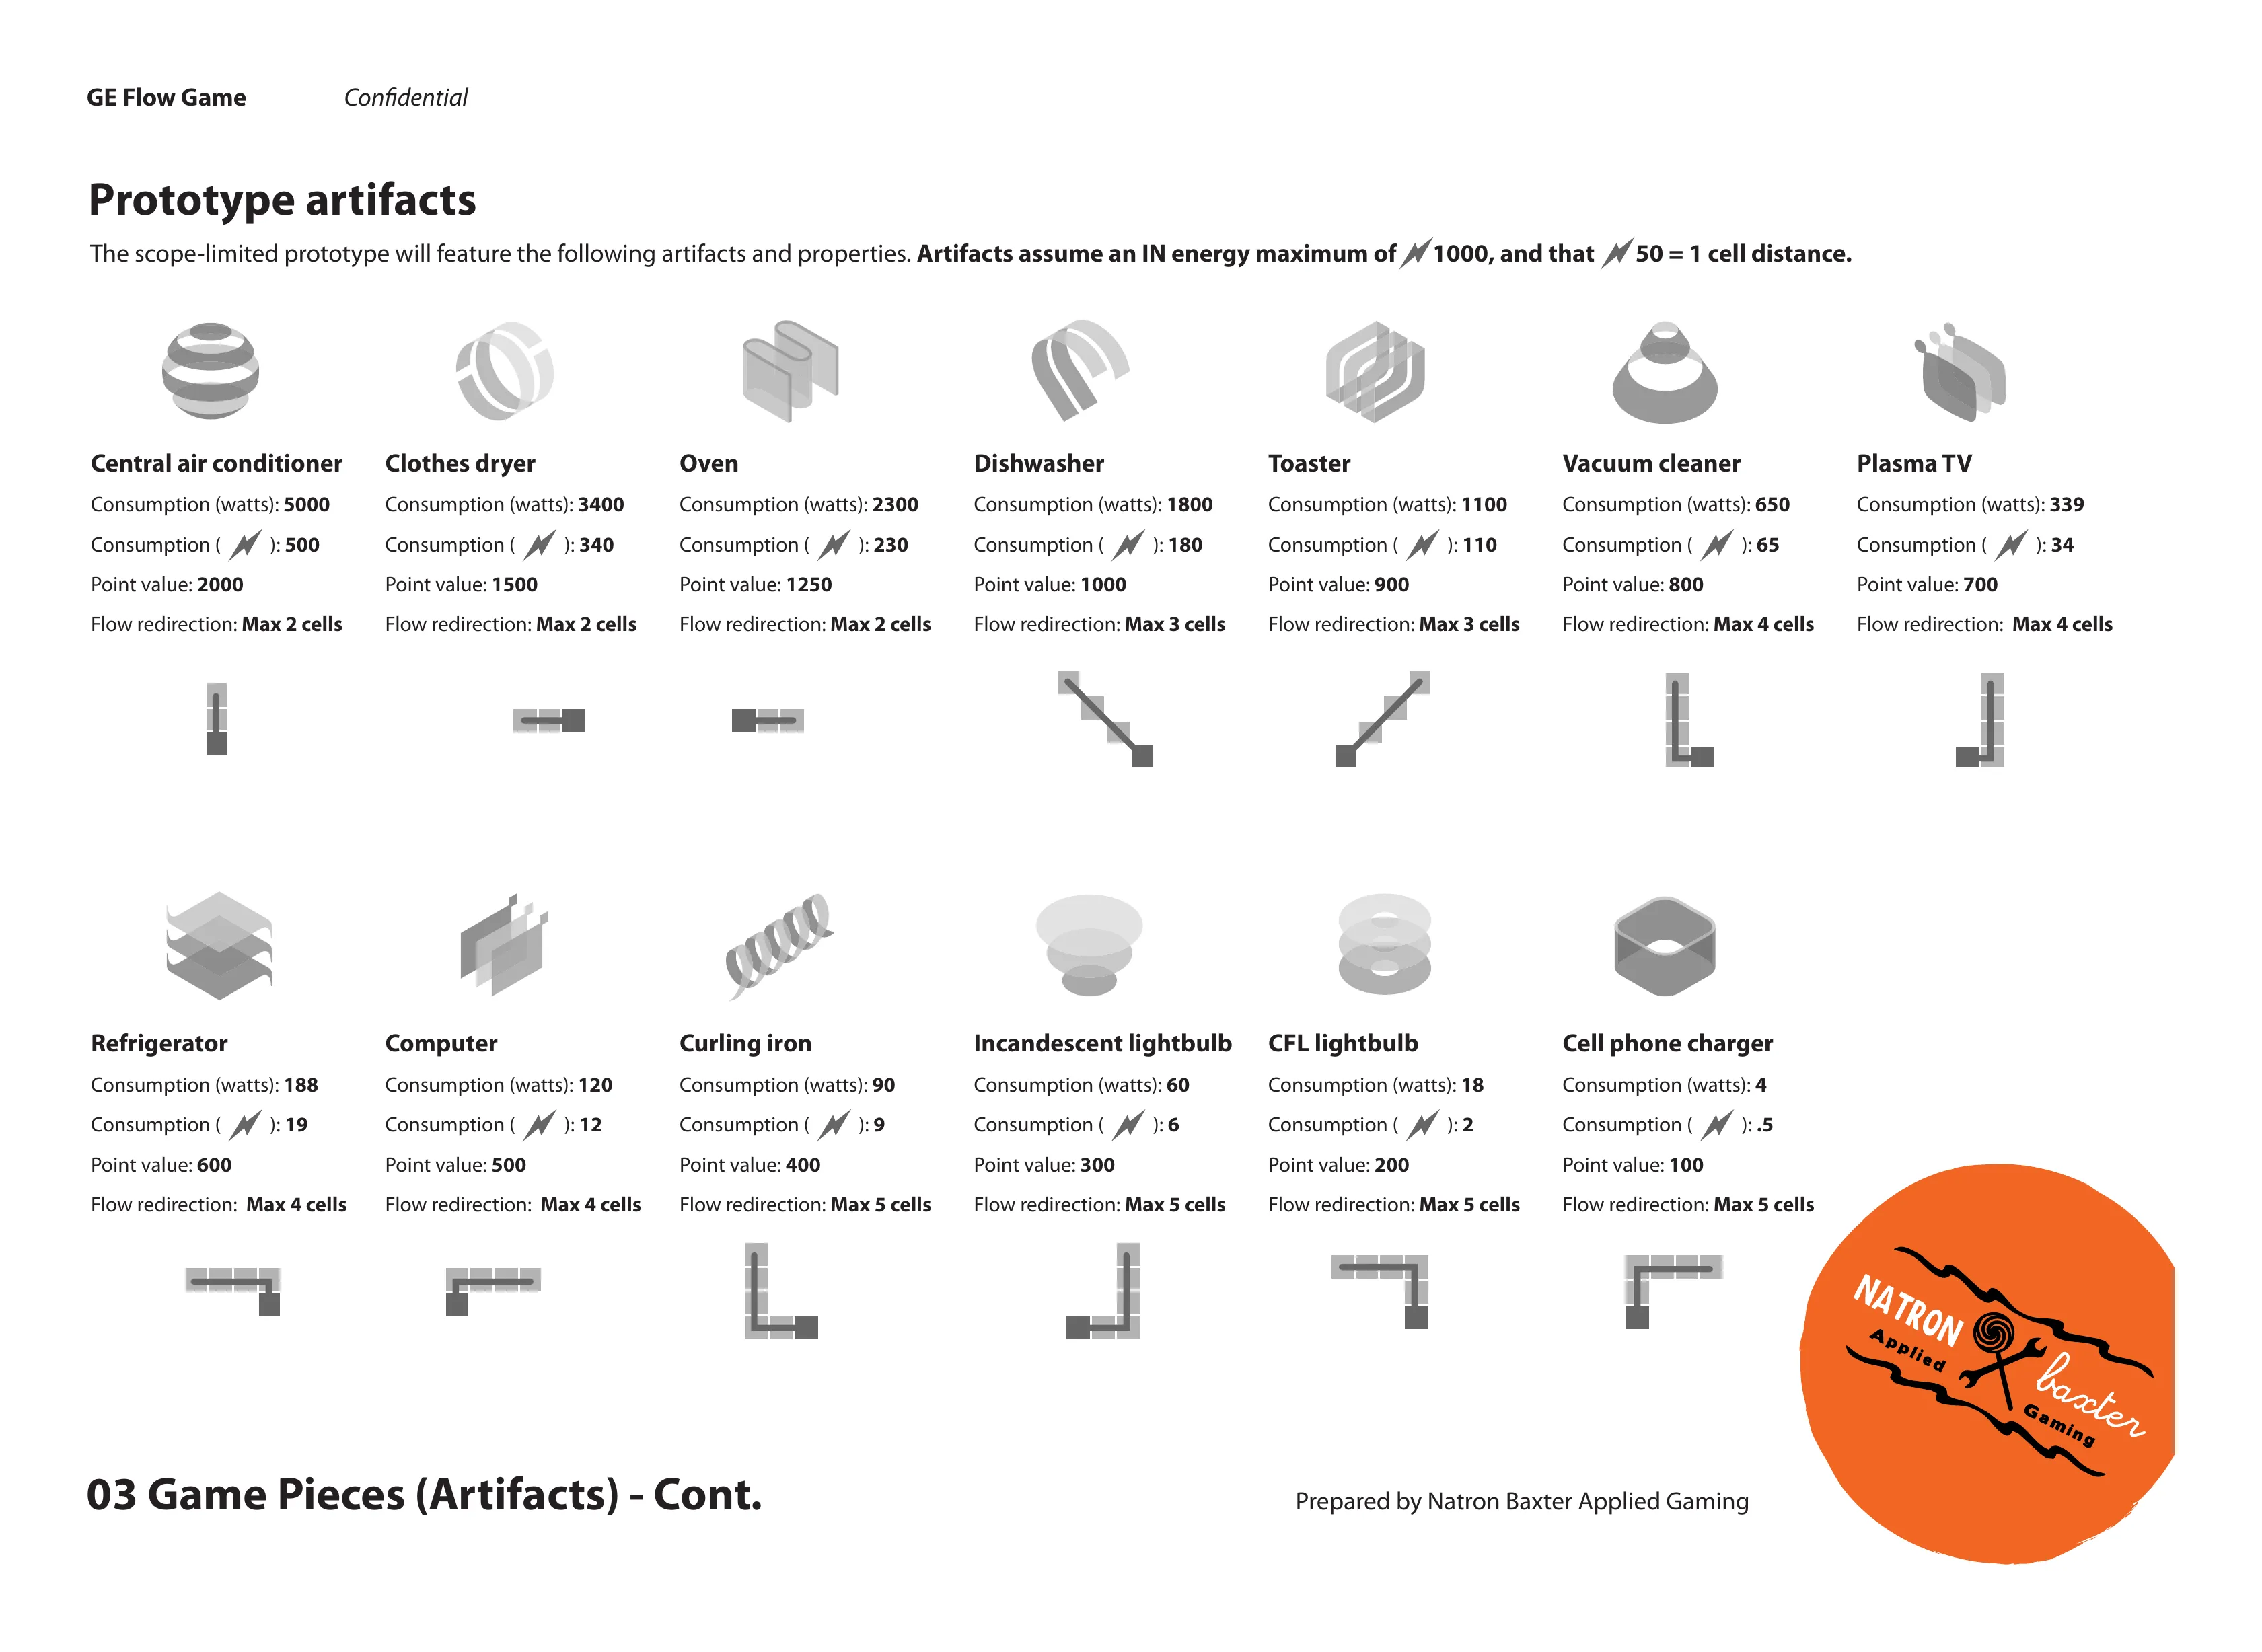
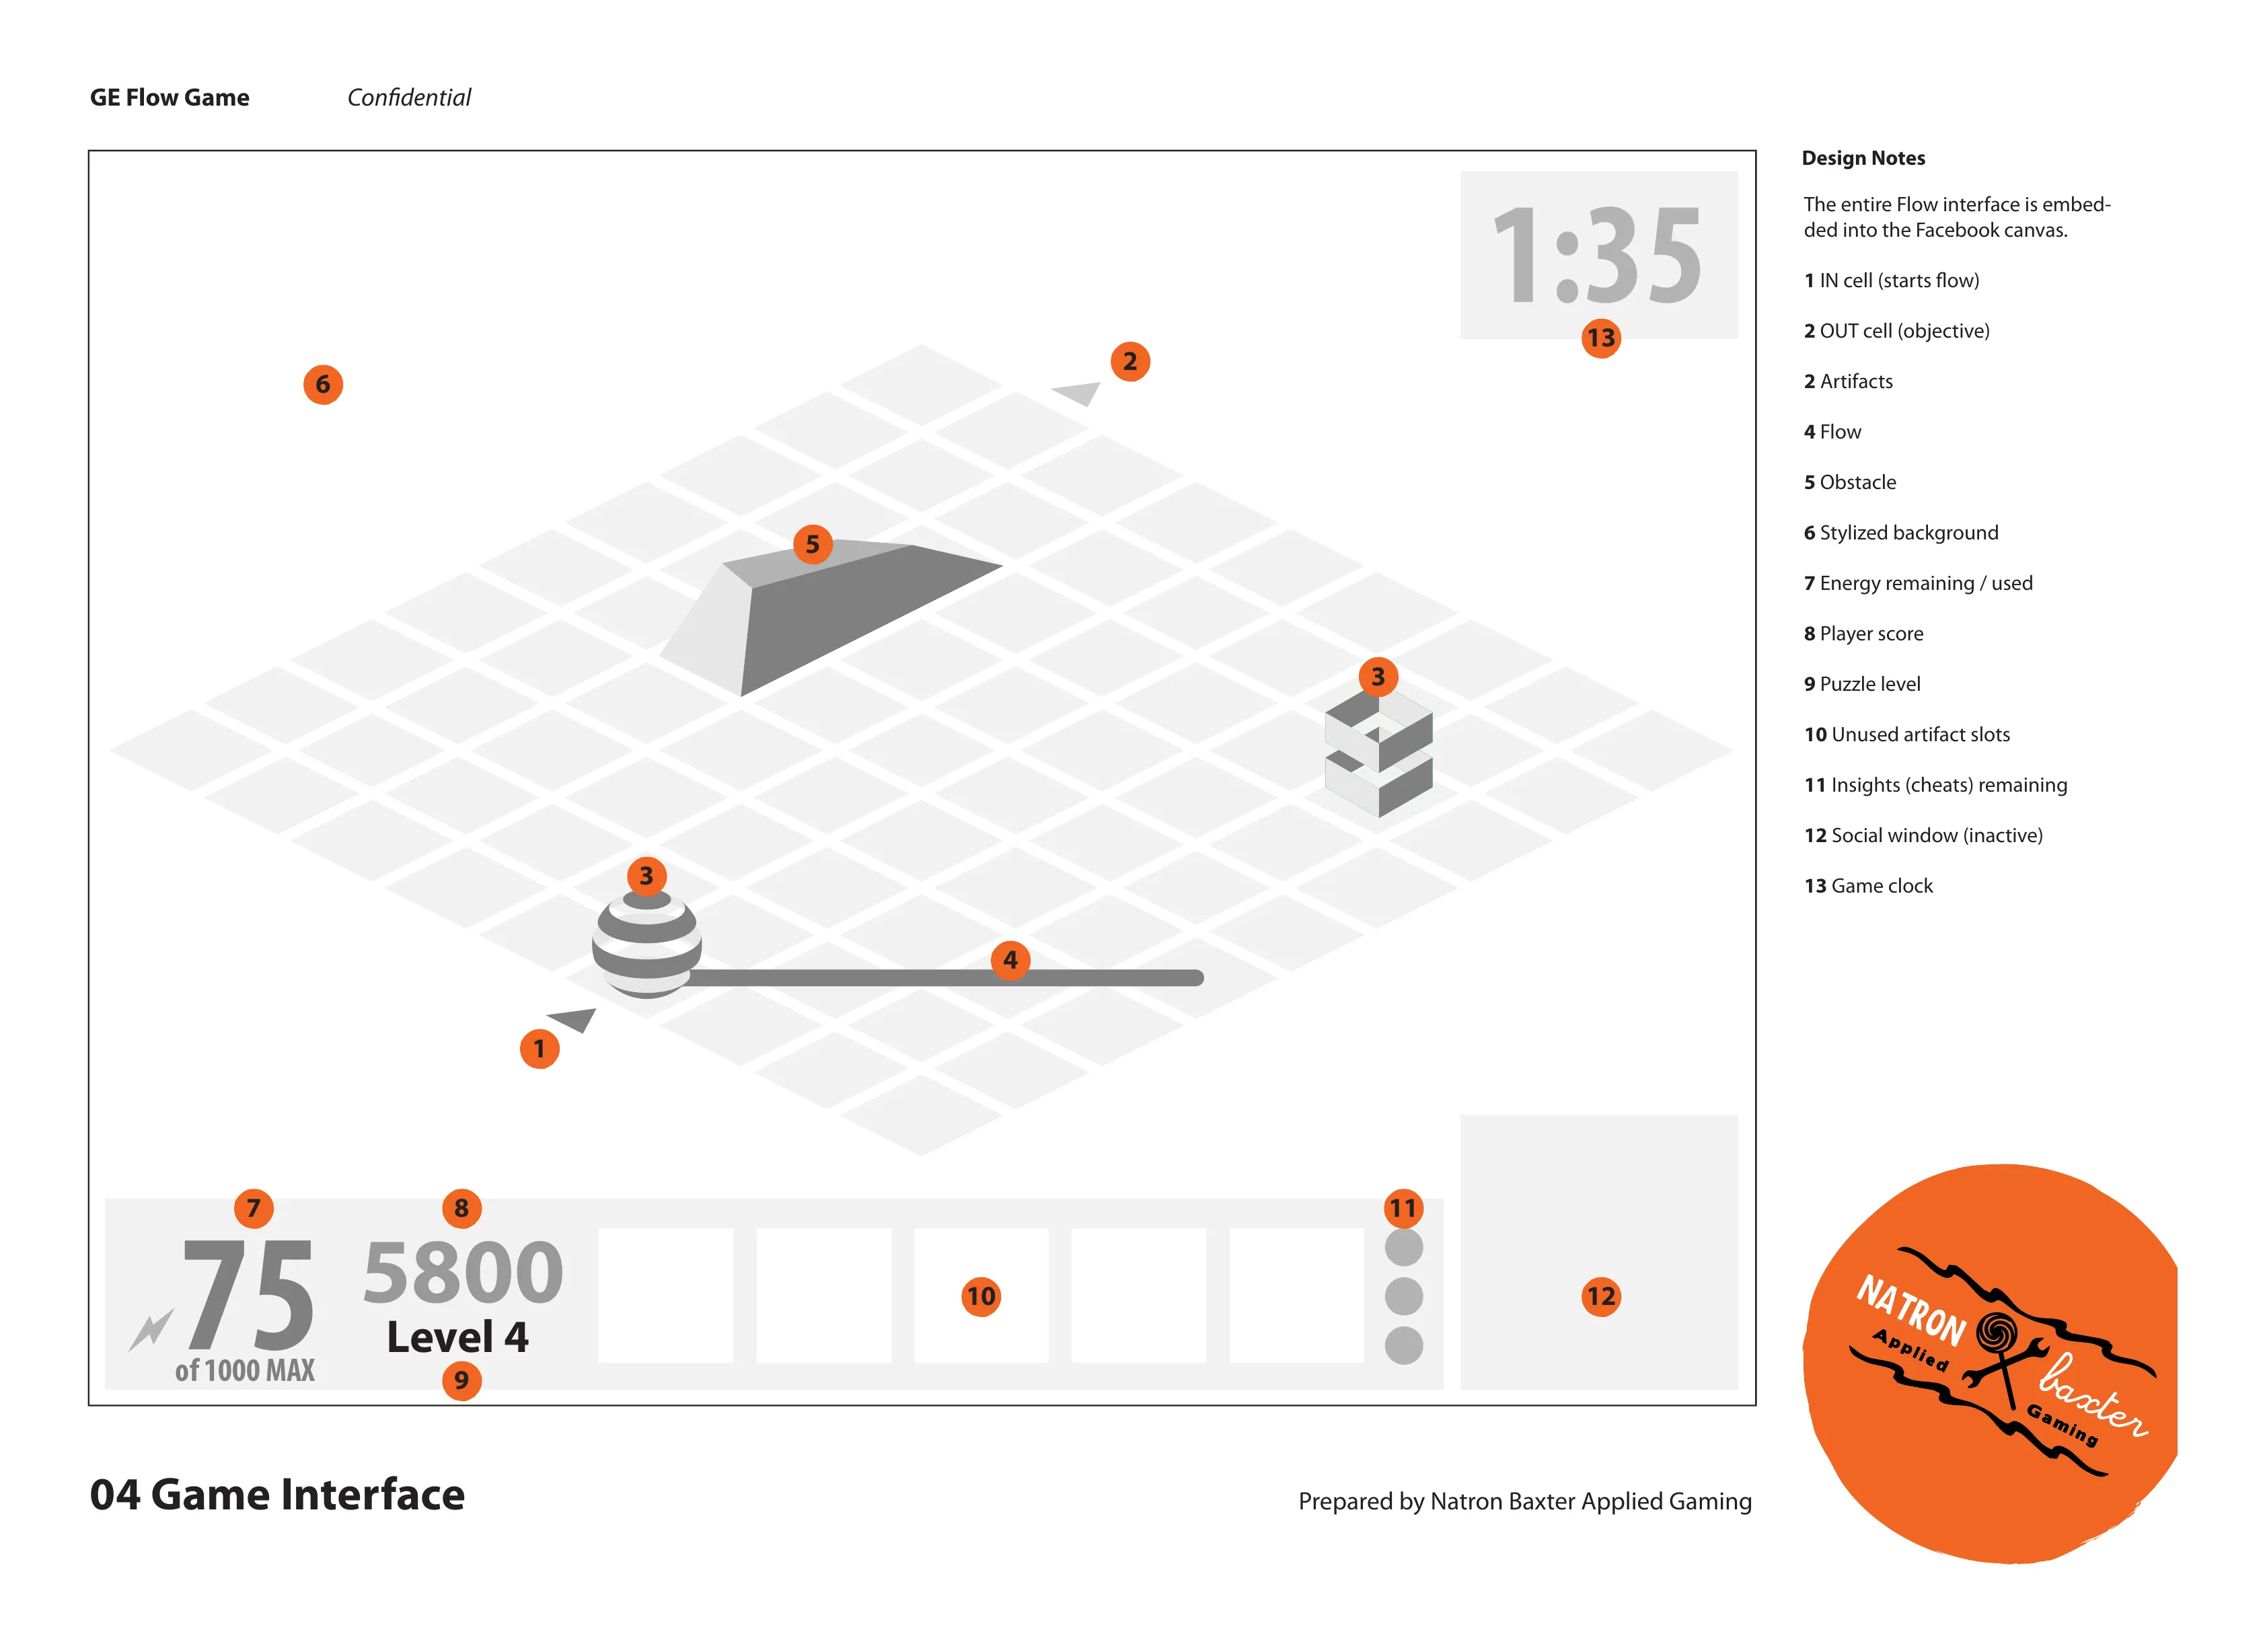
Every artifact is an appliance in disguise; players learn relative consumption by solving puzzles.
The playtest of Quantum Reach: about twenty children in Louisville, and the four kinds of player Natron Baxter saw in them.
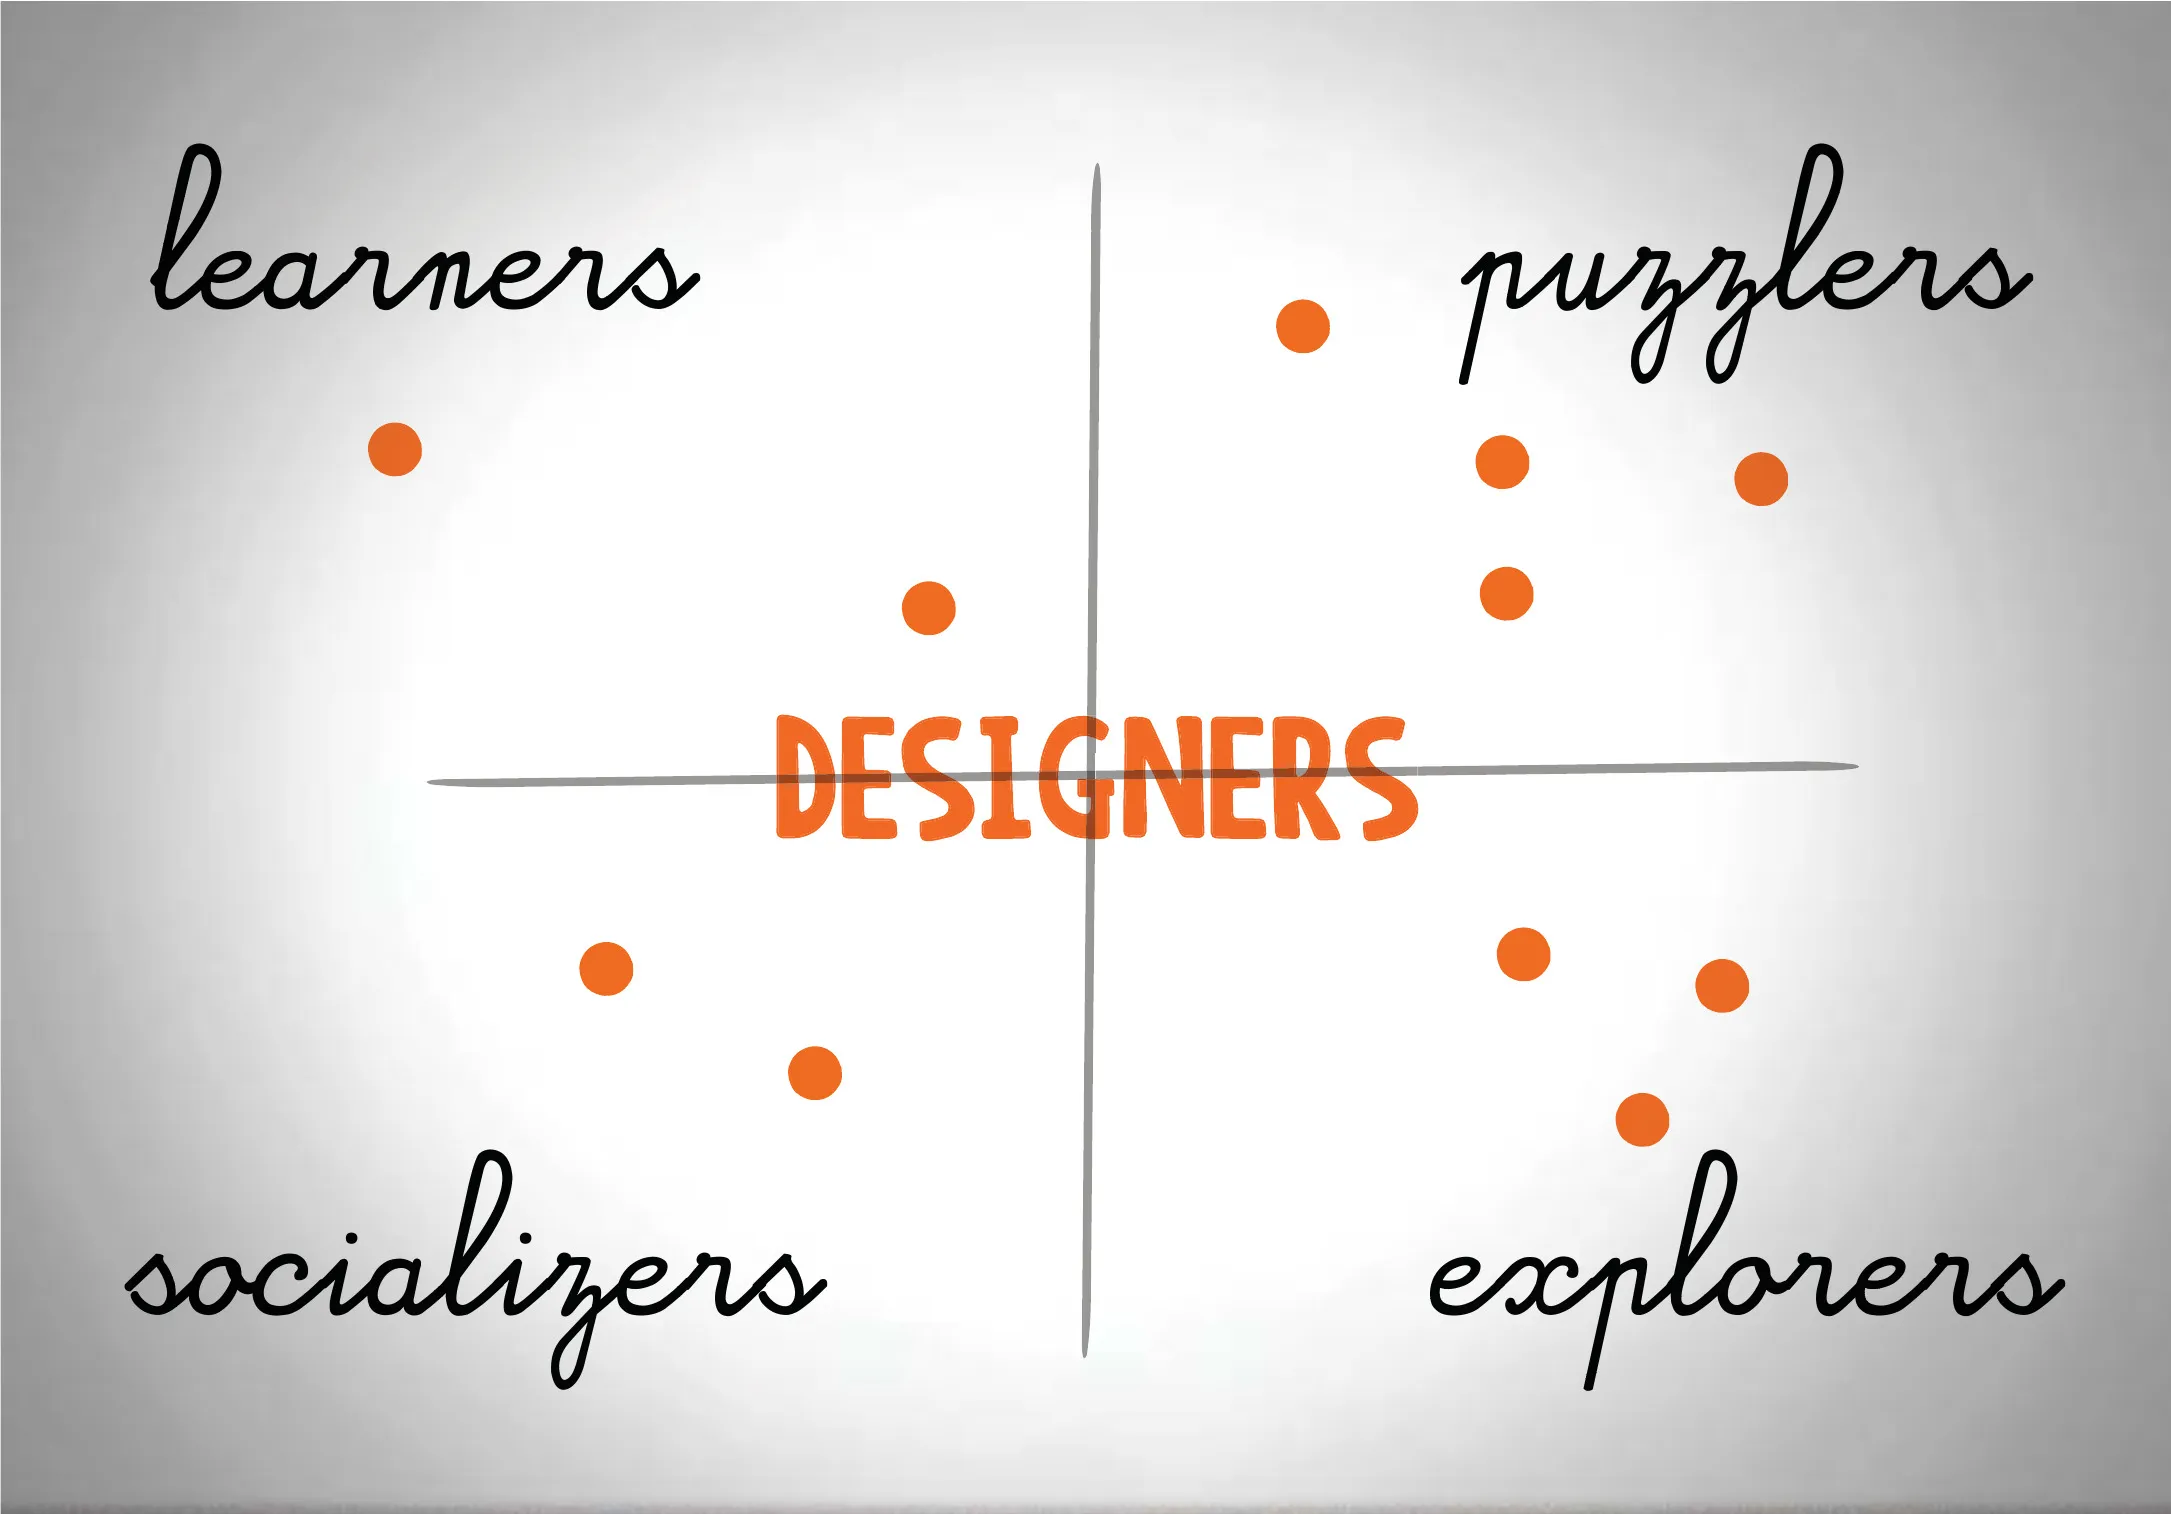
About twenty children aged nine to thirteen played Quantum Reach over two days in Louisville. They split into puzzlers, socializers, explorers and designers, played in pairs without being asked, and wanted the game to answer the real world: weather, time of day, their own outposts. “It was tricky, and that’s good,” one nine-year-old said. Parents who saw the Flow trailer liked its social side and asked for it on the iPad.
Three slides from Natron Baxter's future-state deck: how the games lead a family to the Nucleus, the install that imports their game profiles, and a parent running weekly challenges on a tablet.
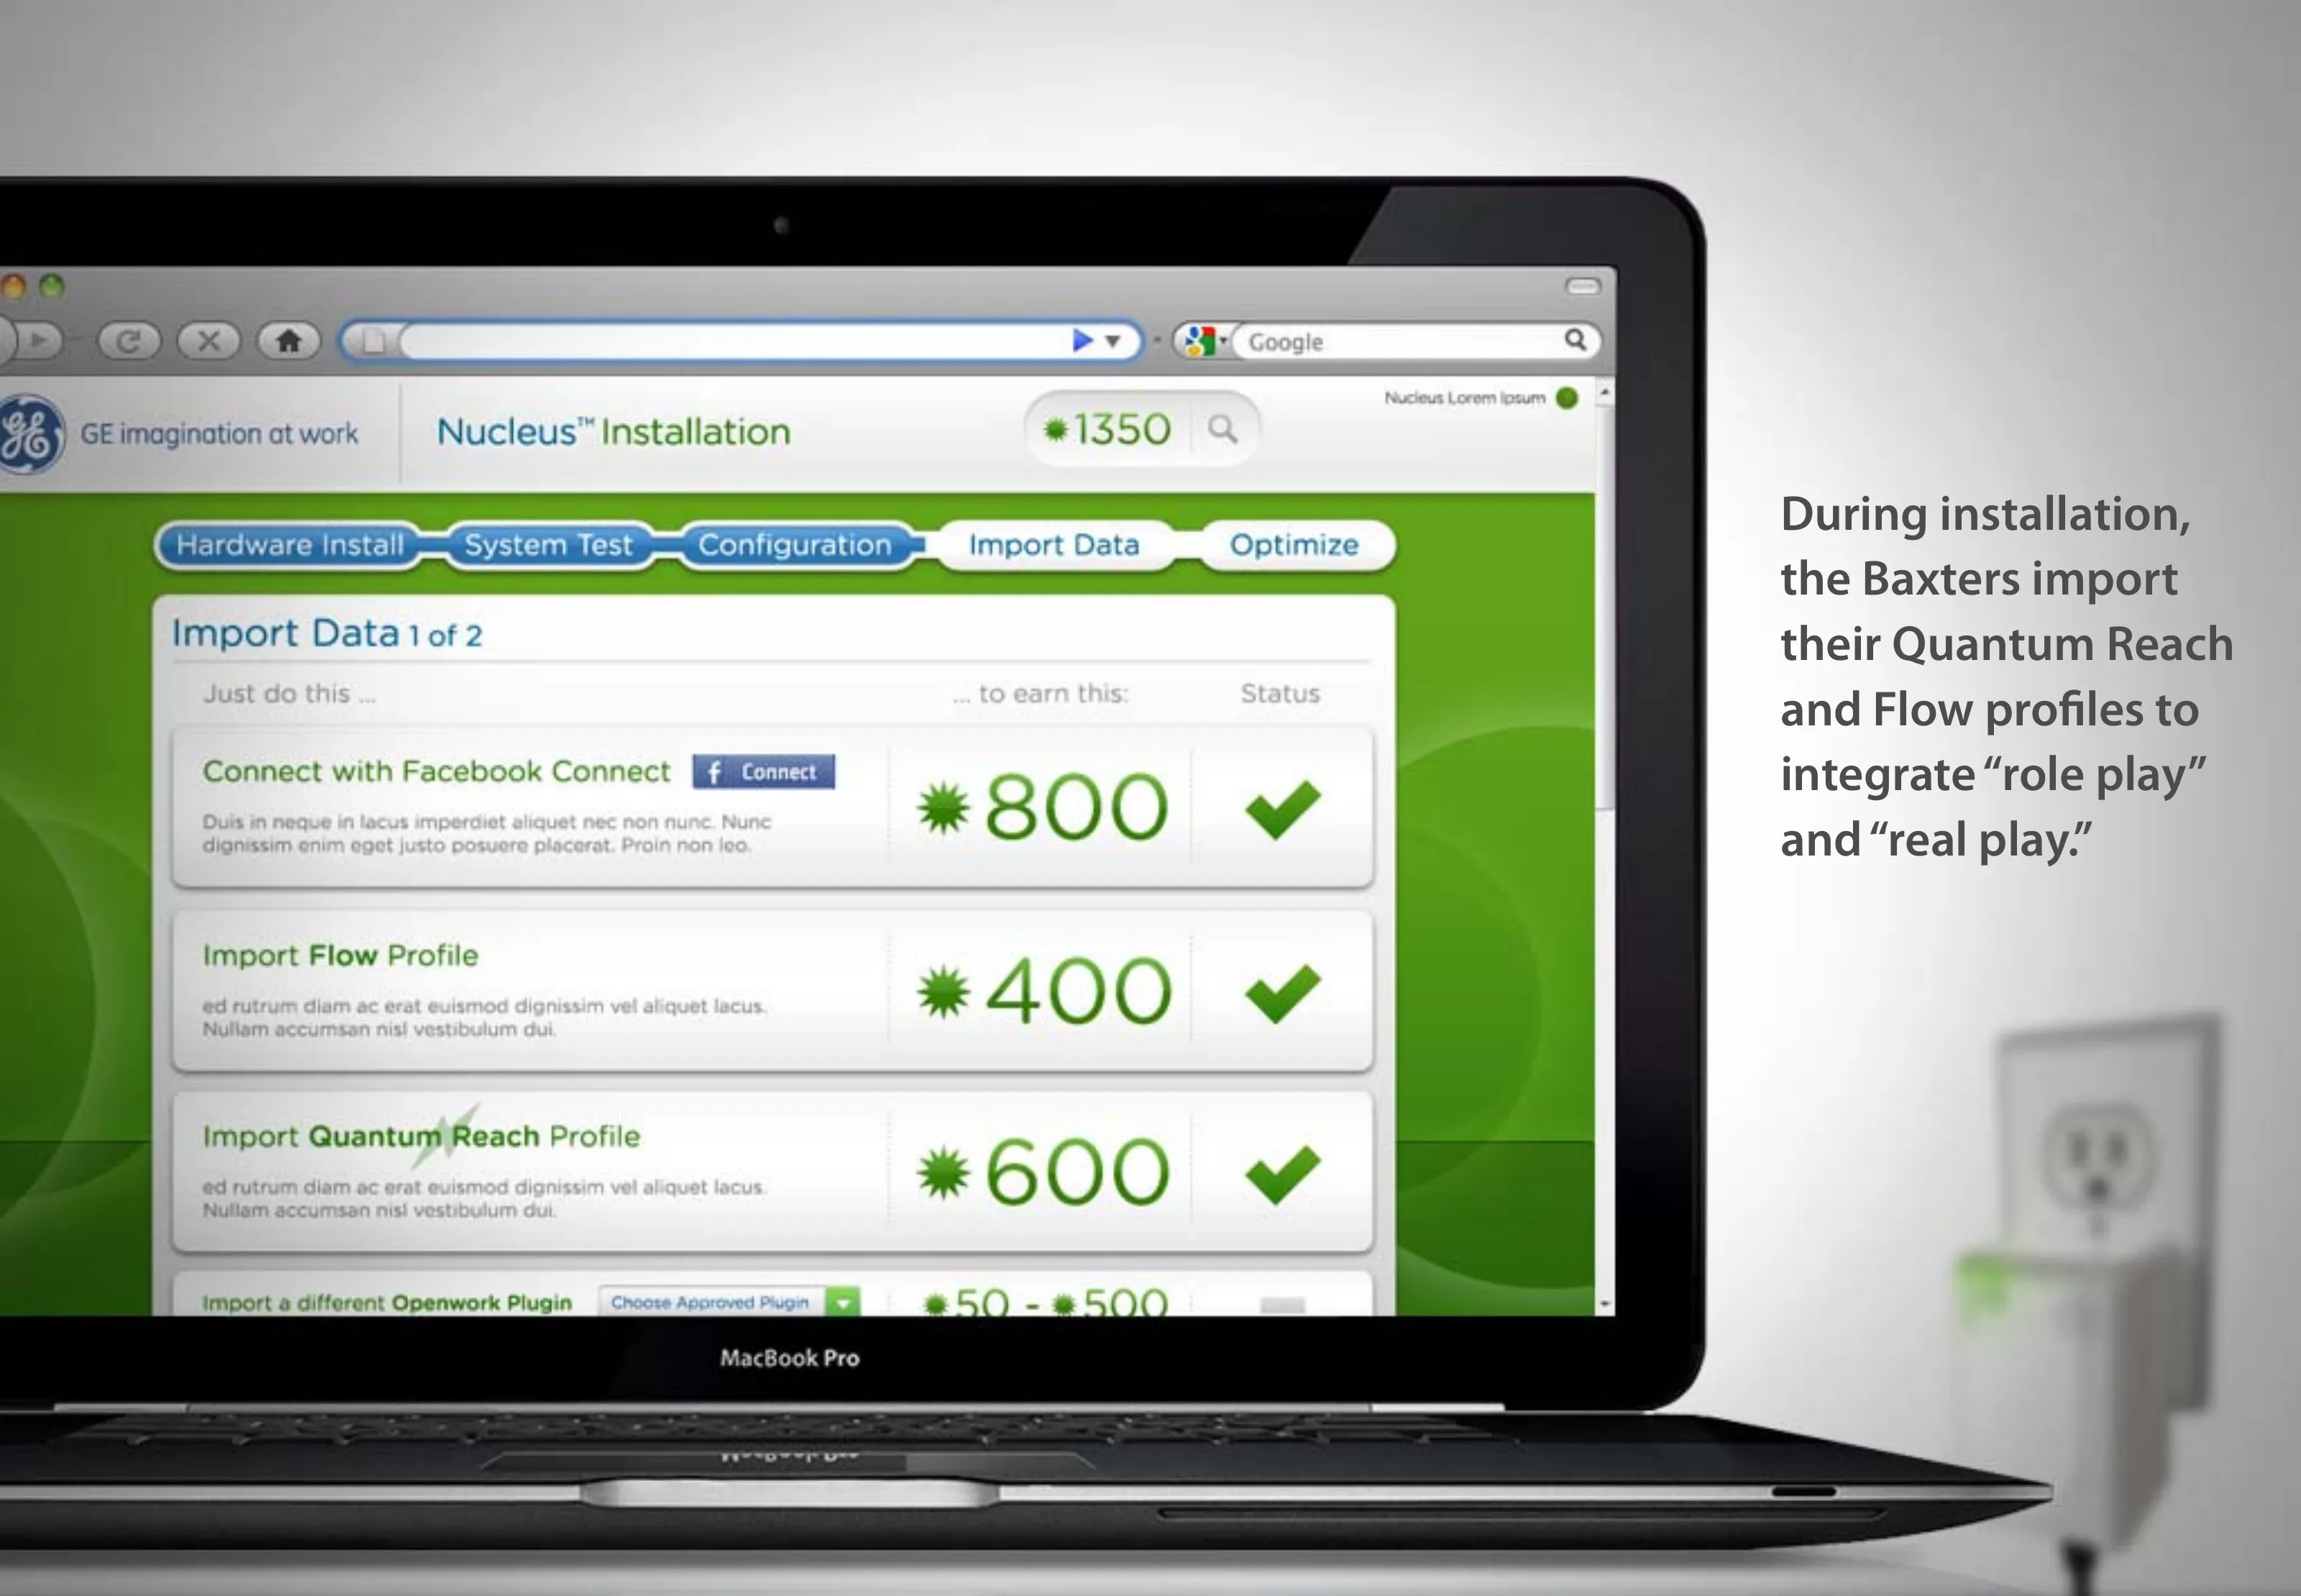
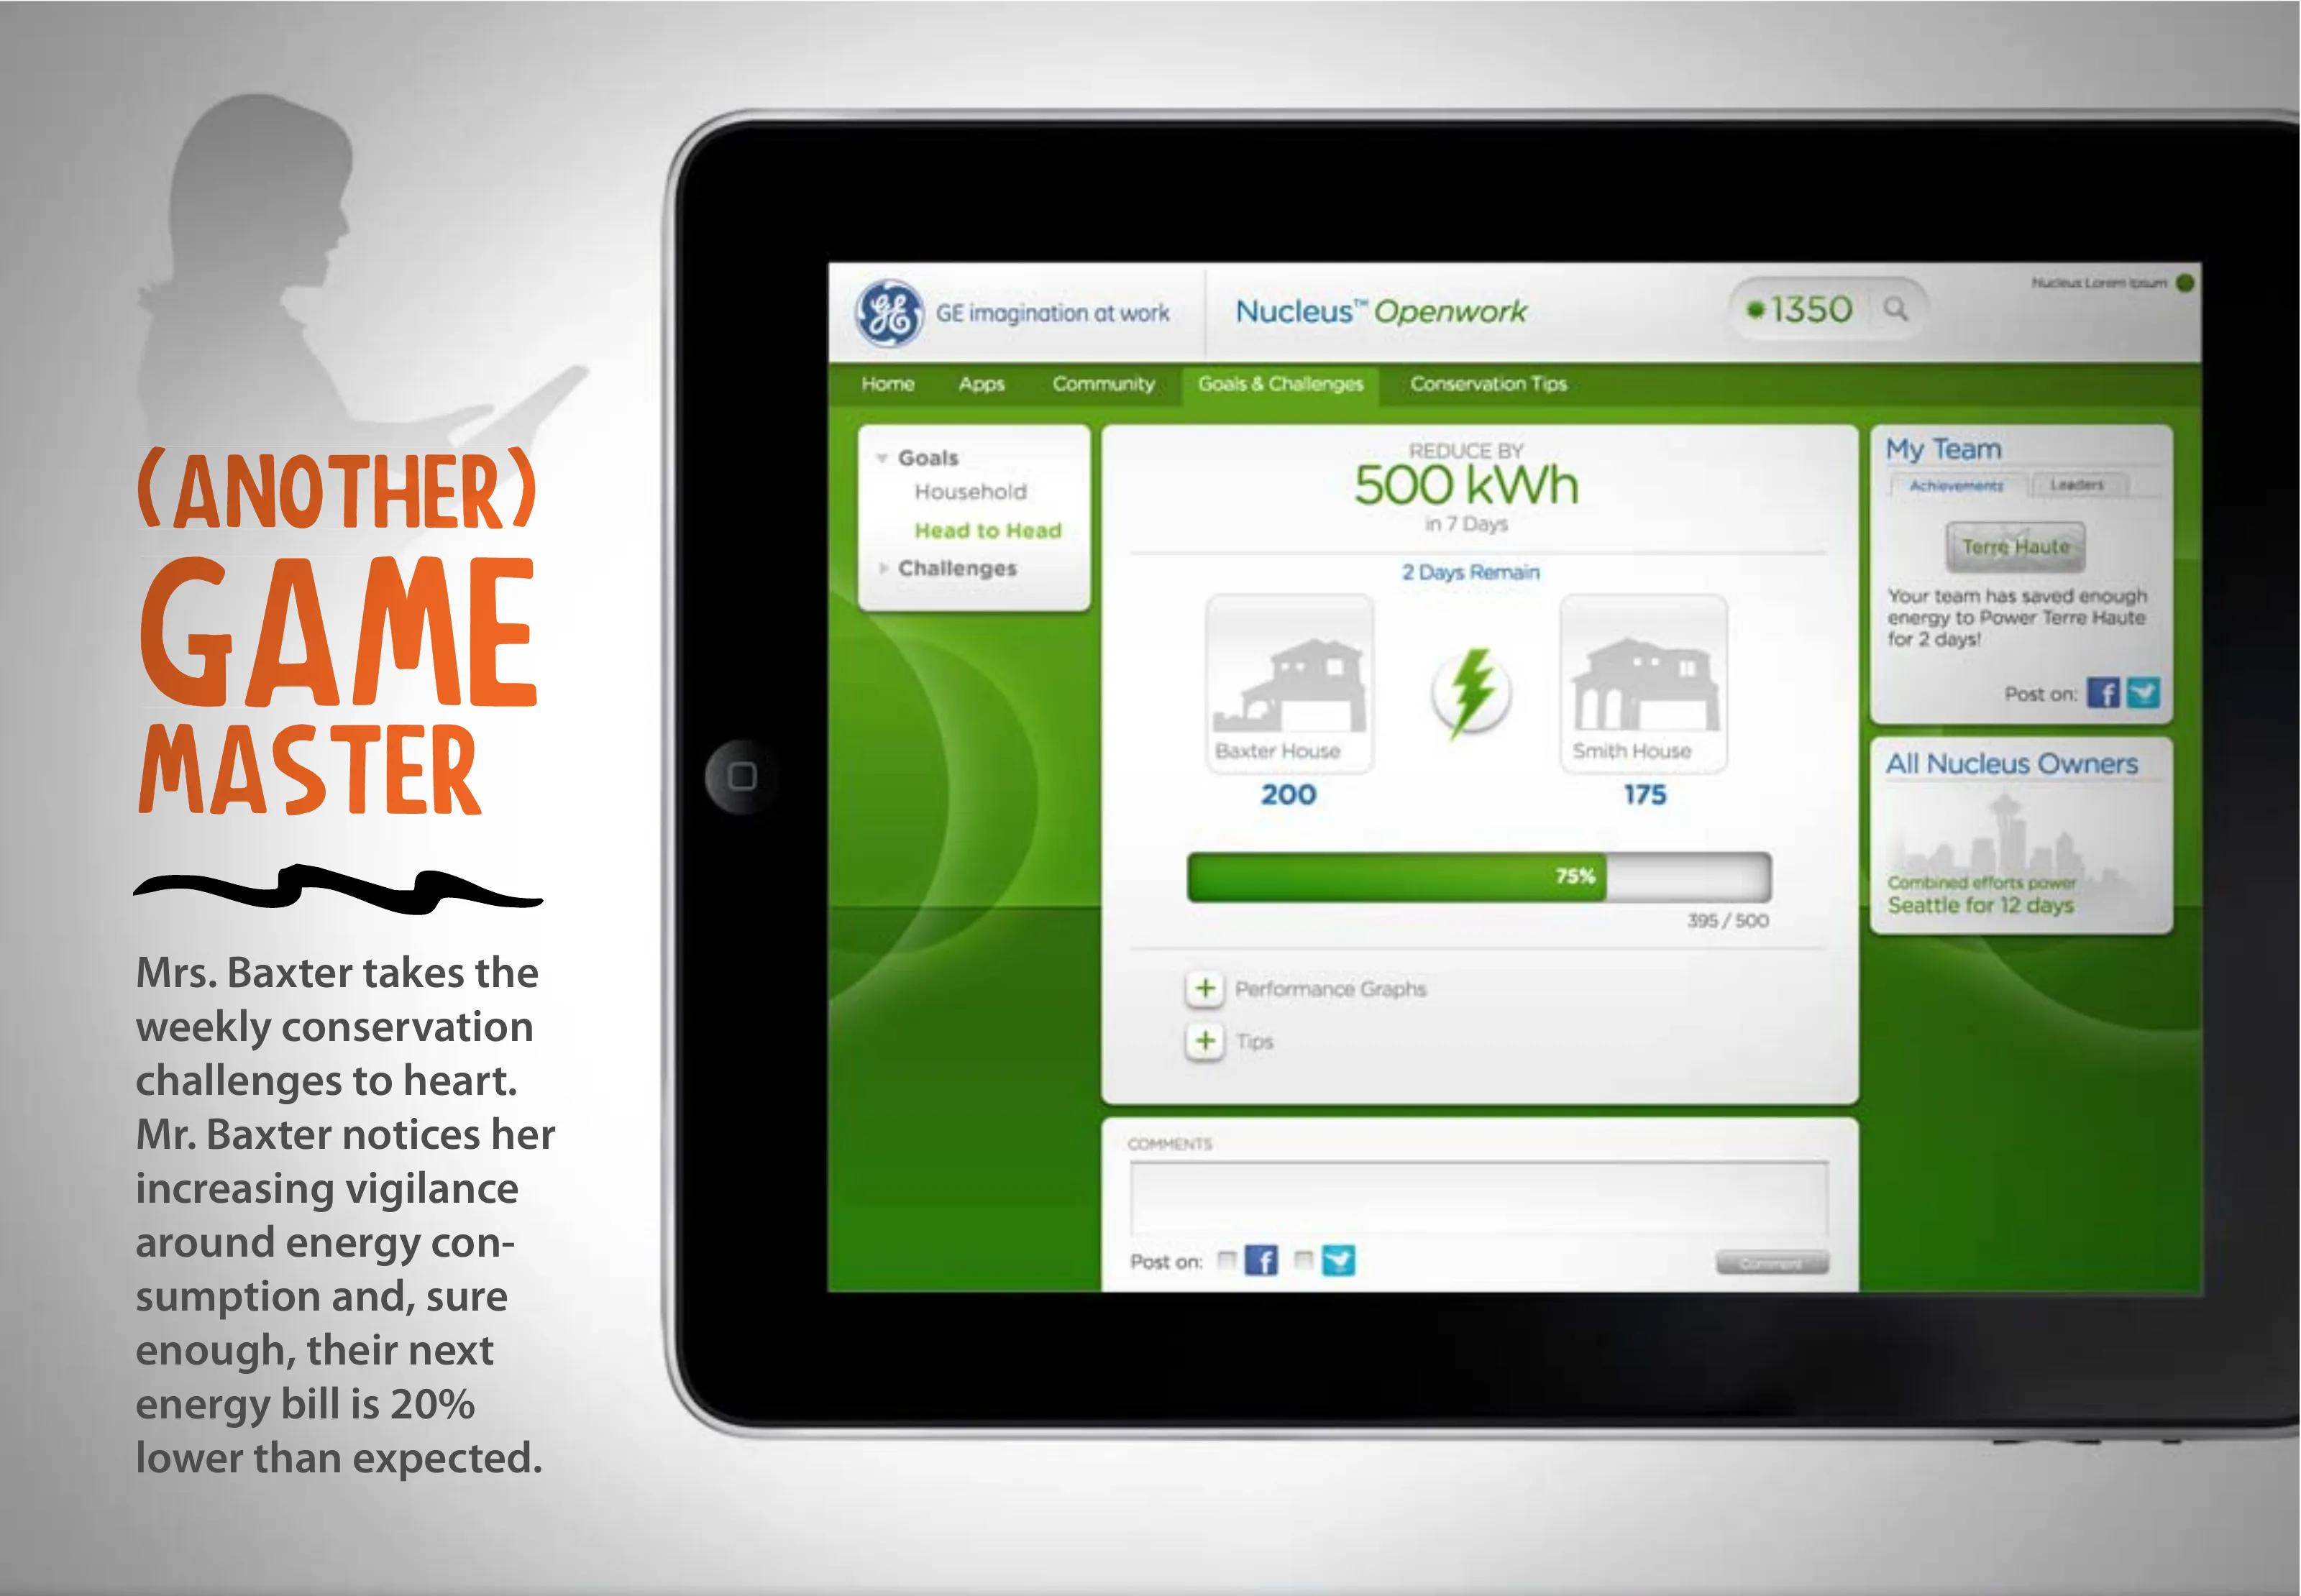
The games as a path to purchase: install imports the family’s game profiles, and the house becomes the game controller.
Results
GE's stand at CES in January 2011, South Hall 2, Connected Home Appliances. The Nucleus and the Brillion appliances were the centrepiece of GE's first return to the show in thirty years, and this is where the results section starts.
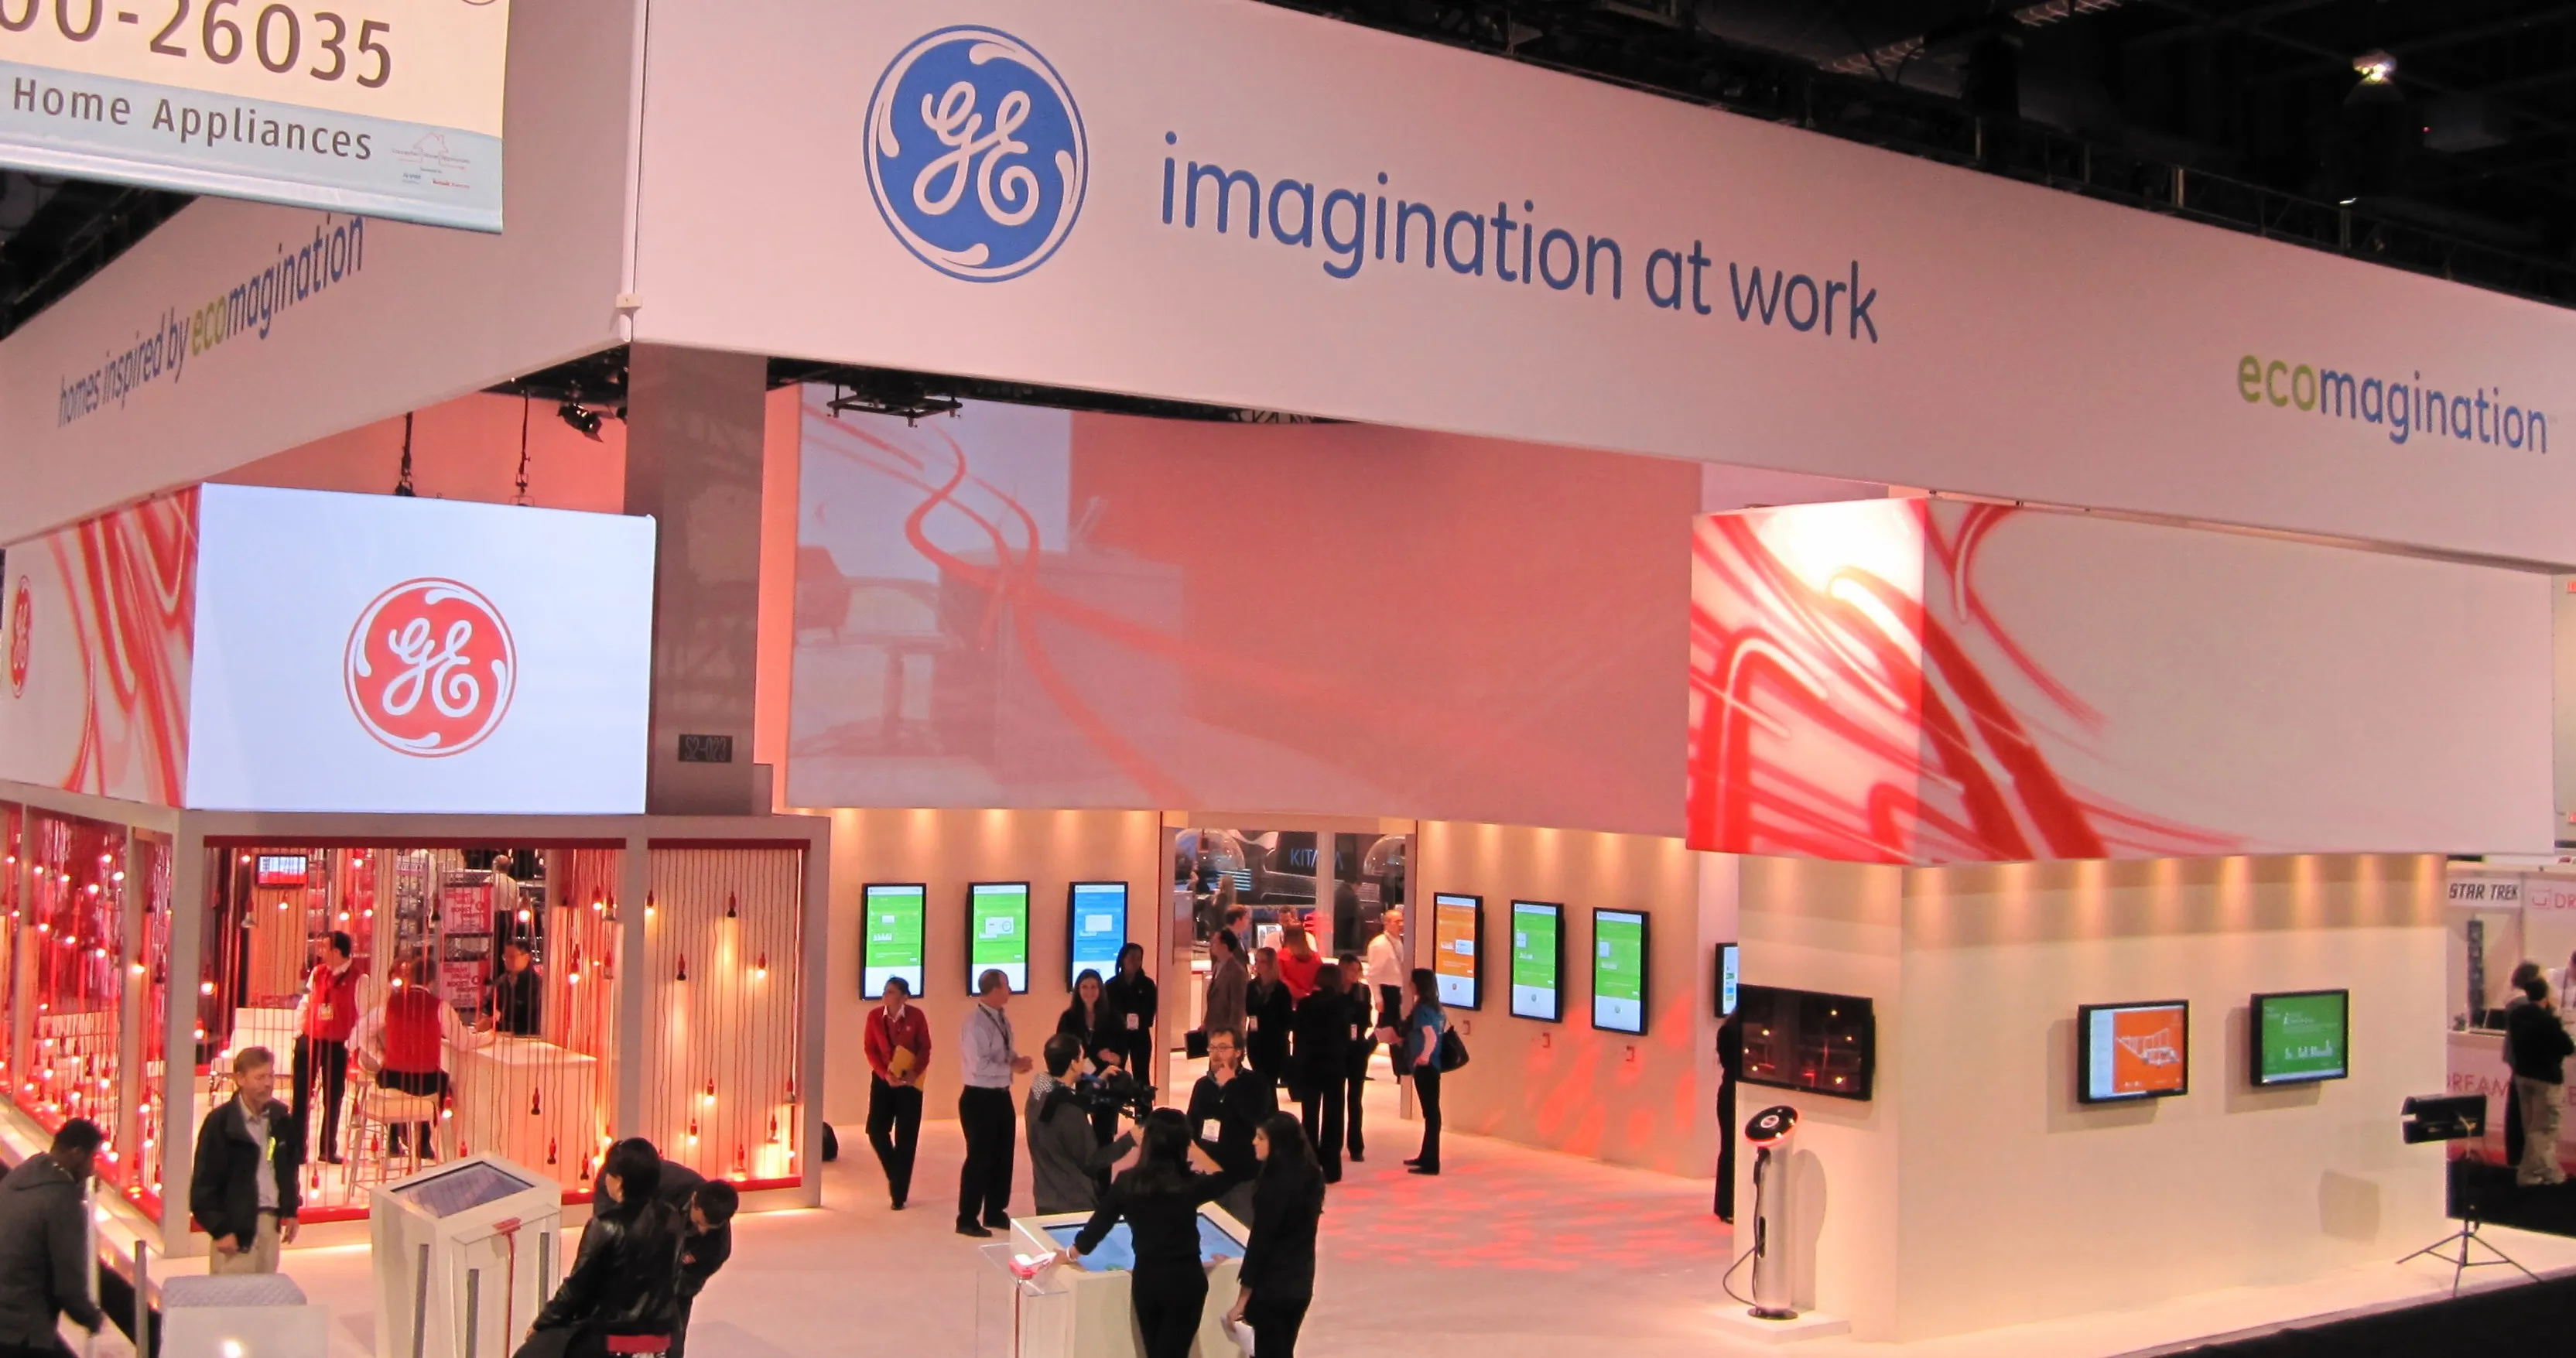
What became of the Nucleus, as a record: its launch, a business built around it, the first ZigBee-certified energy gateway, CES, utility pilots and their results, and the patents on the screenless gateway.
July 2010 · San Francisco
Launch
The first Brillion product: three years of usage data on the PC and phone, priced at $149 to $199.
November 2010 · GE Appliances
A business of its own
GE formed a Home Energy Management business with the Nucleus at its center.
December 2010 · ZigBee Alliance
First ZigBee-certified energy gateway
The first ZigBee-certified home energy gateway, linking meter, appliances and thermostat to computers and phones.
January 2011 · Las Vegas
At CES
MIT Technology Review: “plugged into a spare power socket,” it talks to the meter, appliances and an electric car.
2011 – 2012 · Massachusetts and Georgia
Utility pilots
Martha’s Vineyard, 50 homes, about 120 appliances. Flint Energies, Georgia, 10 homes with peak-time rebates.
2011 · GE utility pilots
Pilot results
Rated best overall against four competitors. Smart appliances nearly doubled peak reduction, from 1.0 to 1.8 kW per home.
Filed 2010 – 2011 · US and Canadian patents
Seven granted patents
Six on the screenless Home Energy Gateway, the Nucleus’s working name, and one on pairing appliances to it.
AI usage
2, Ideas. AI helped with research, sources, brainstorming or structure. I wrote every word.The tiers