Boosting consistency, quality, and time to value for industrial software.
A sheet of the design system's web components on gray panels, each labeled: alerts, multipage tabs, progress bars, pagination, content alerts and grouping, spider charts, buttons, thumbnails, form inputs, and more. It opens the project on the system itself, the shared interface parts meant to bring consistency, quality, and time to value to GE's industrial software.
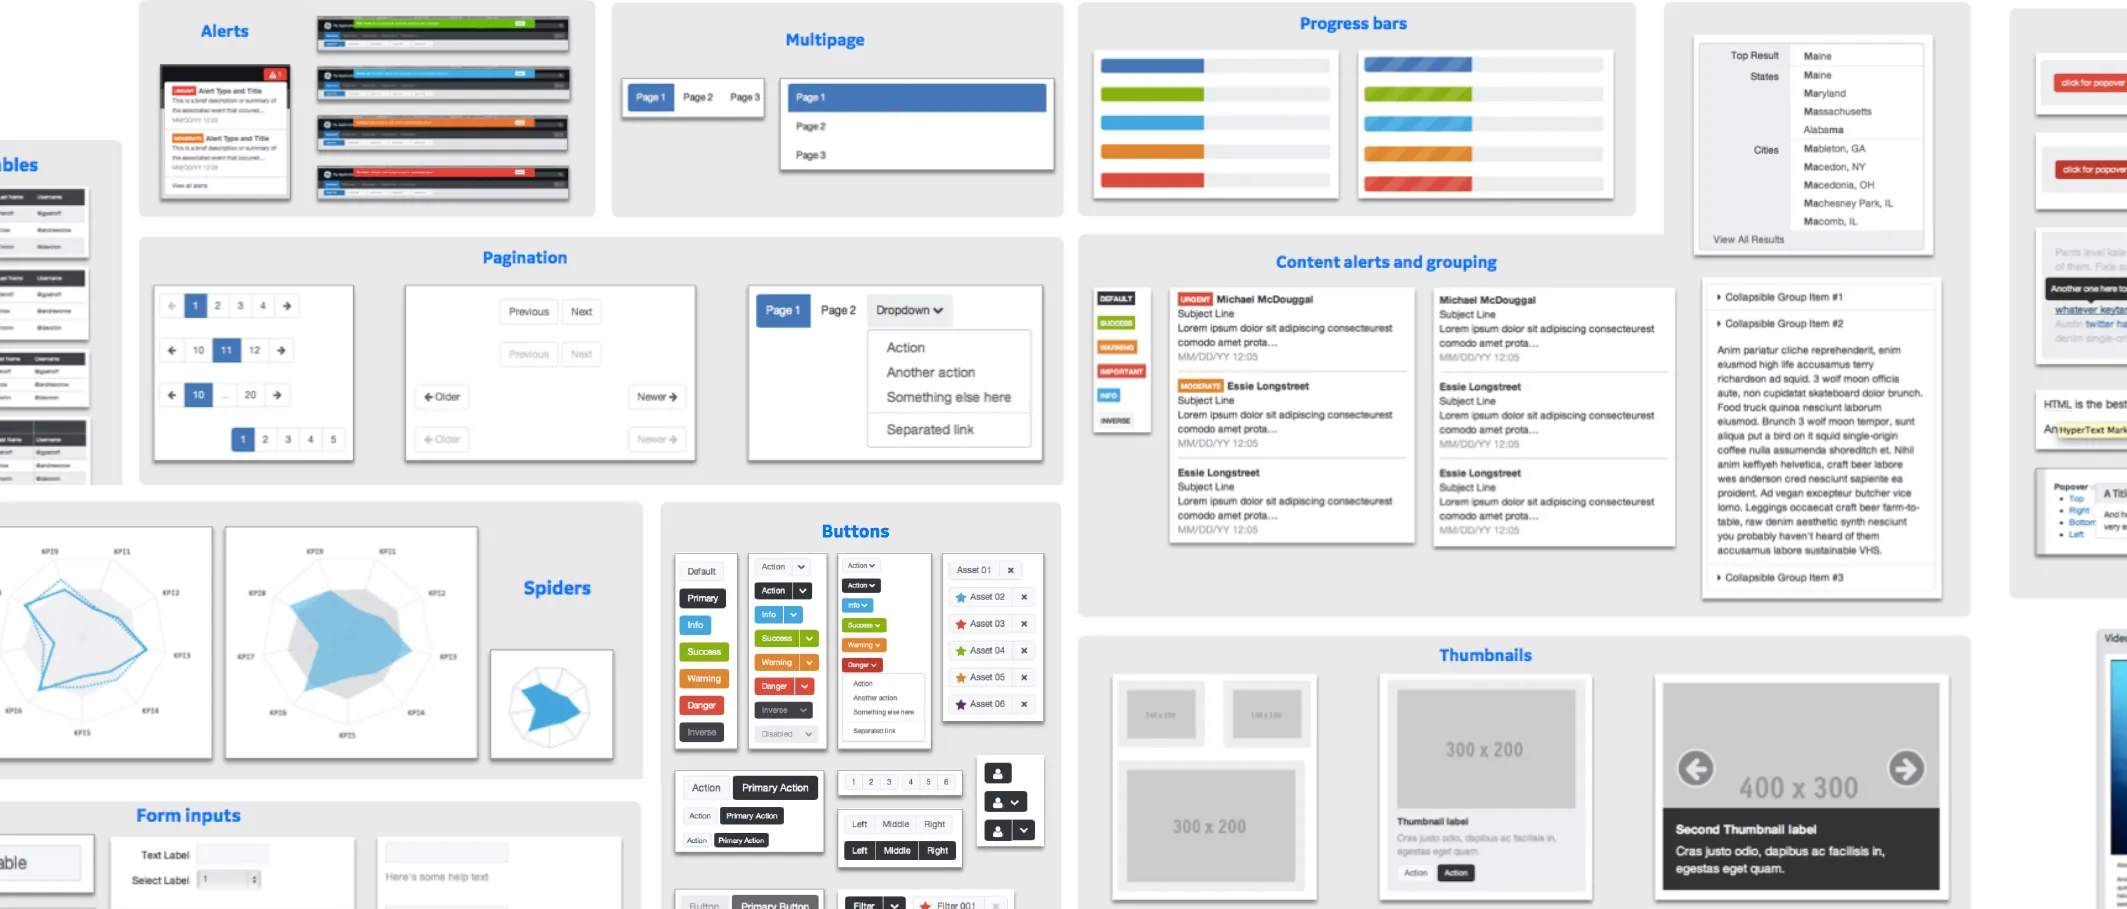
GE Design System
Problem space
The aim of the work in one sentence: to curate GE's Industrial Internet Design System through a prioritized backlog, open design critique sessions, and standardization of scalable experience patterns. It frames the prioritizing, backlog, and pattern work the rest of the page shows.
Curate GE’s Industrial Internet Design System through a prioritized backlog, open design critique sessions, and standardization of scalable experience patterns.
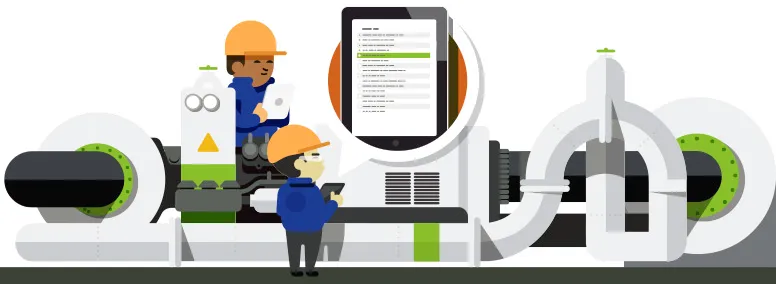
Two illustrations side by side, office workers before wind turbines and a drafting table, and field workers in hard hats at a pipe assembly with a tablet, each above what the design system was to give that audience. For GE software teams: faster development, clearer team communications, and meaningful design focus; for GE customers: a high-quality user experience, more predictable products, and simpler ongoing support.

For GE software teams
- Faster development speed
- Clarify team communications
- Meaningful design focus
For GE customers
- High quality user experience
- Increase product predictability
- Simplify ongoing support
Roadmap prioritization
Five printed copies of the design system's numbered feature list, each initialed and marked up by hand, beside a whiteboard where sticky notes for fonts, forms, data visualization, colors, search, sign-in, icons, mapping, and other features are placed on an effort axis. I surveyed business and design leaders and ran regular workshops to decide where the system should focus, and held office hours to see designers' product interfaces in context.
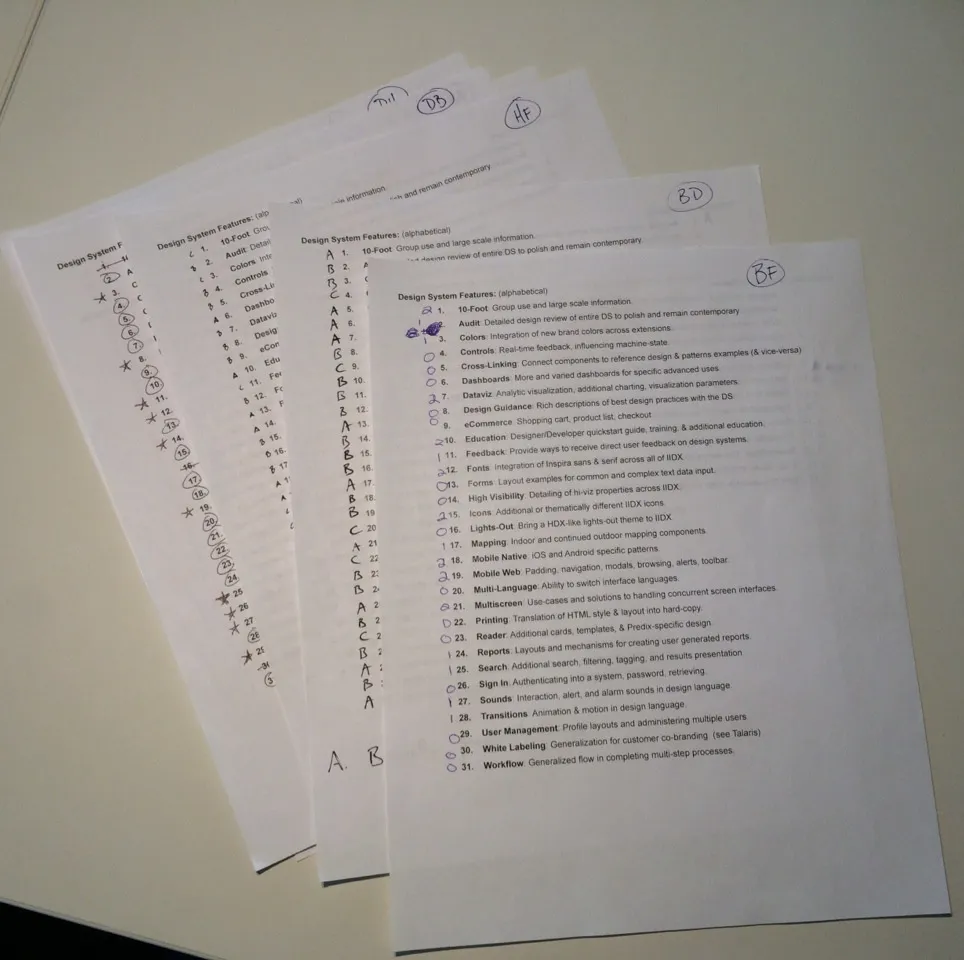
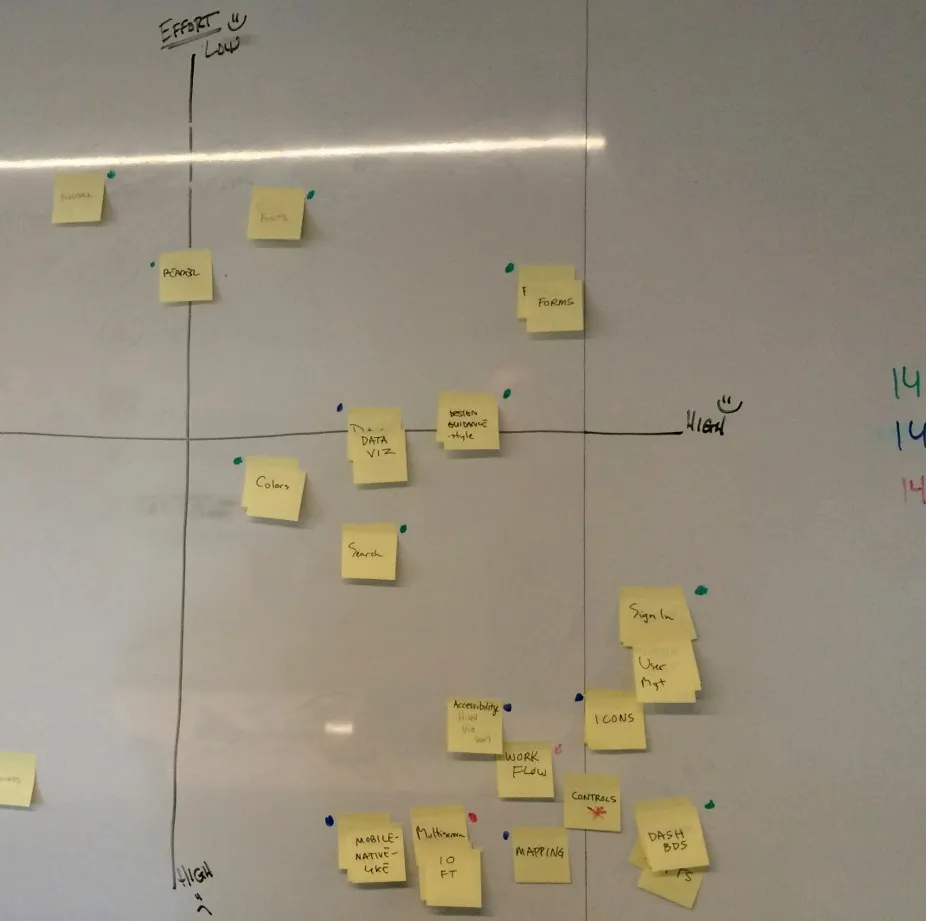
I surveyed business and design leaders for areas of need and ran regular workshops to determine where we should focus. Office hours were held to consult with designers and see the context of their product interfaces.
Backlog management
Three Confluence pages from the system's working space: the backlog, a table of components such as accordion, tree browser, calendar, and modals tracked against the IIDX, MDX, and HDX extensions; a design brief for the tree browser; and a list of projects grouped under collections, themes and properties, patterns, the Software Design Hub, and delivery. They show requests to the system turned into an open backlog, with a taxonomy, a way to track demand, and a brief and examples for each component.
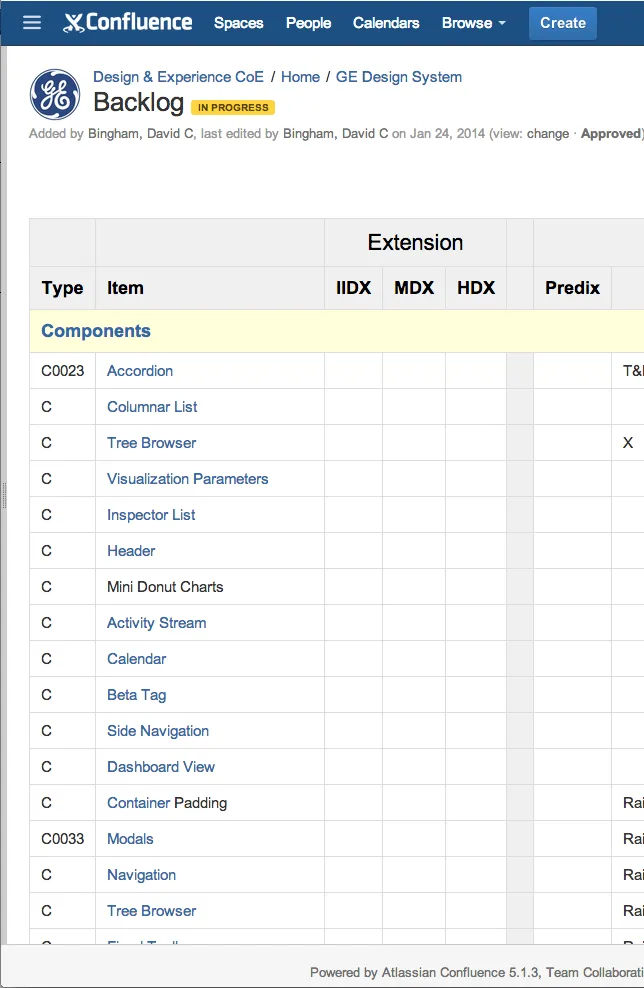
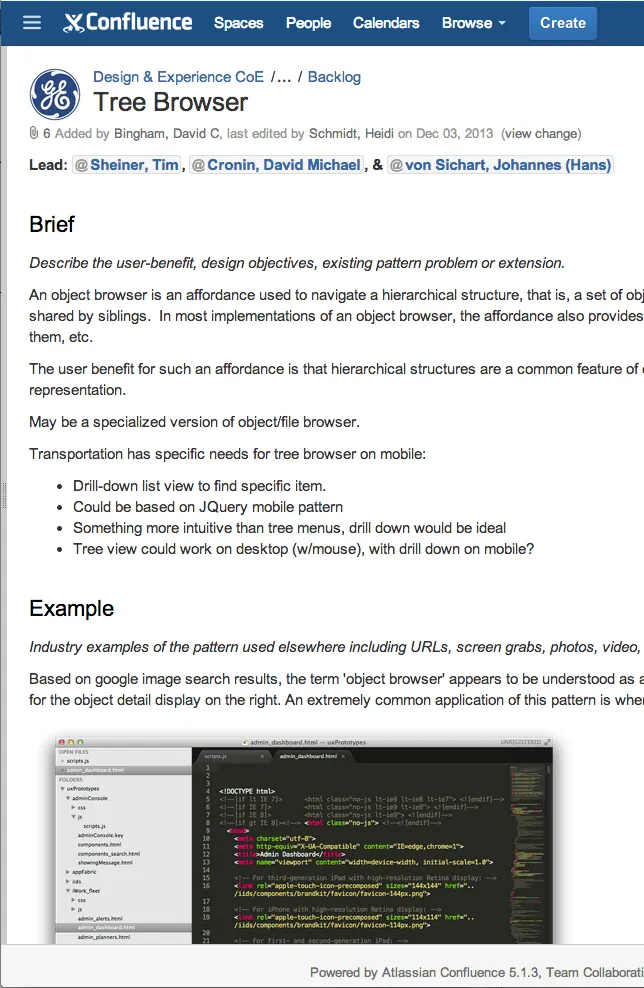
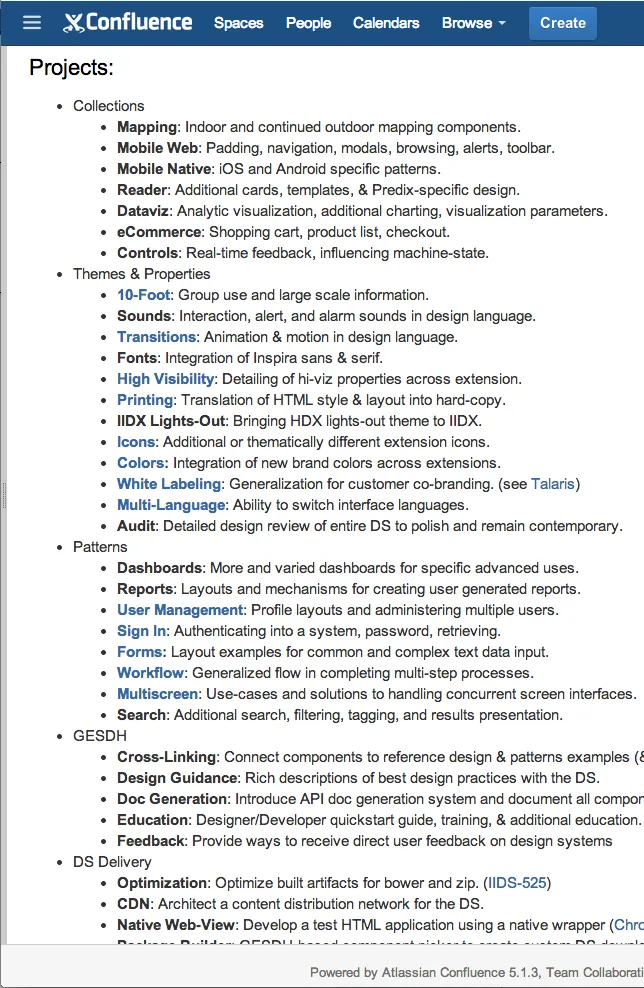
Translated design system requests into an openly organized system backlog. Defined a system taxonomy and method to track demand. Wrote design briefs for each component with individual examples.
System color palette
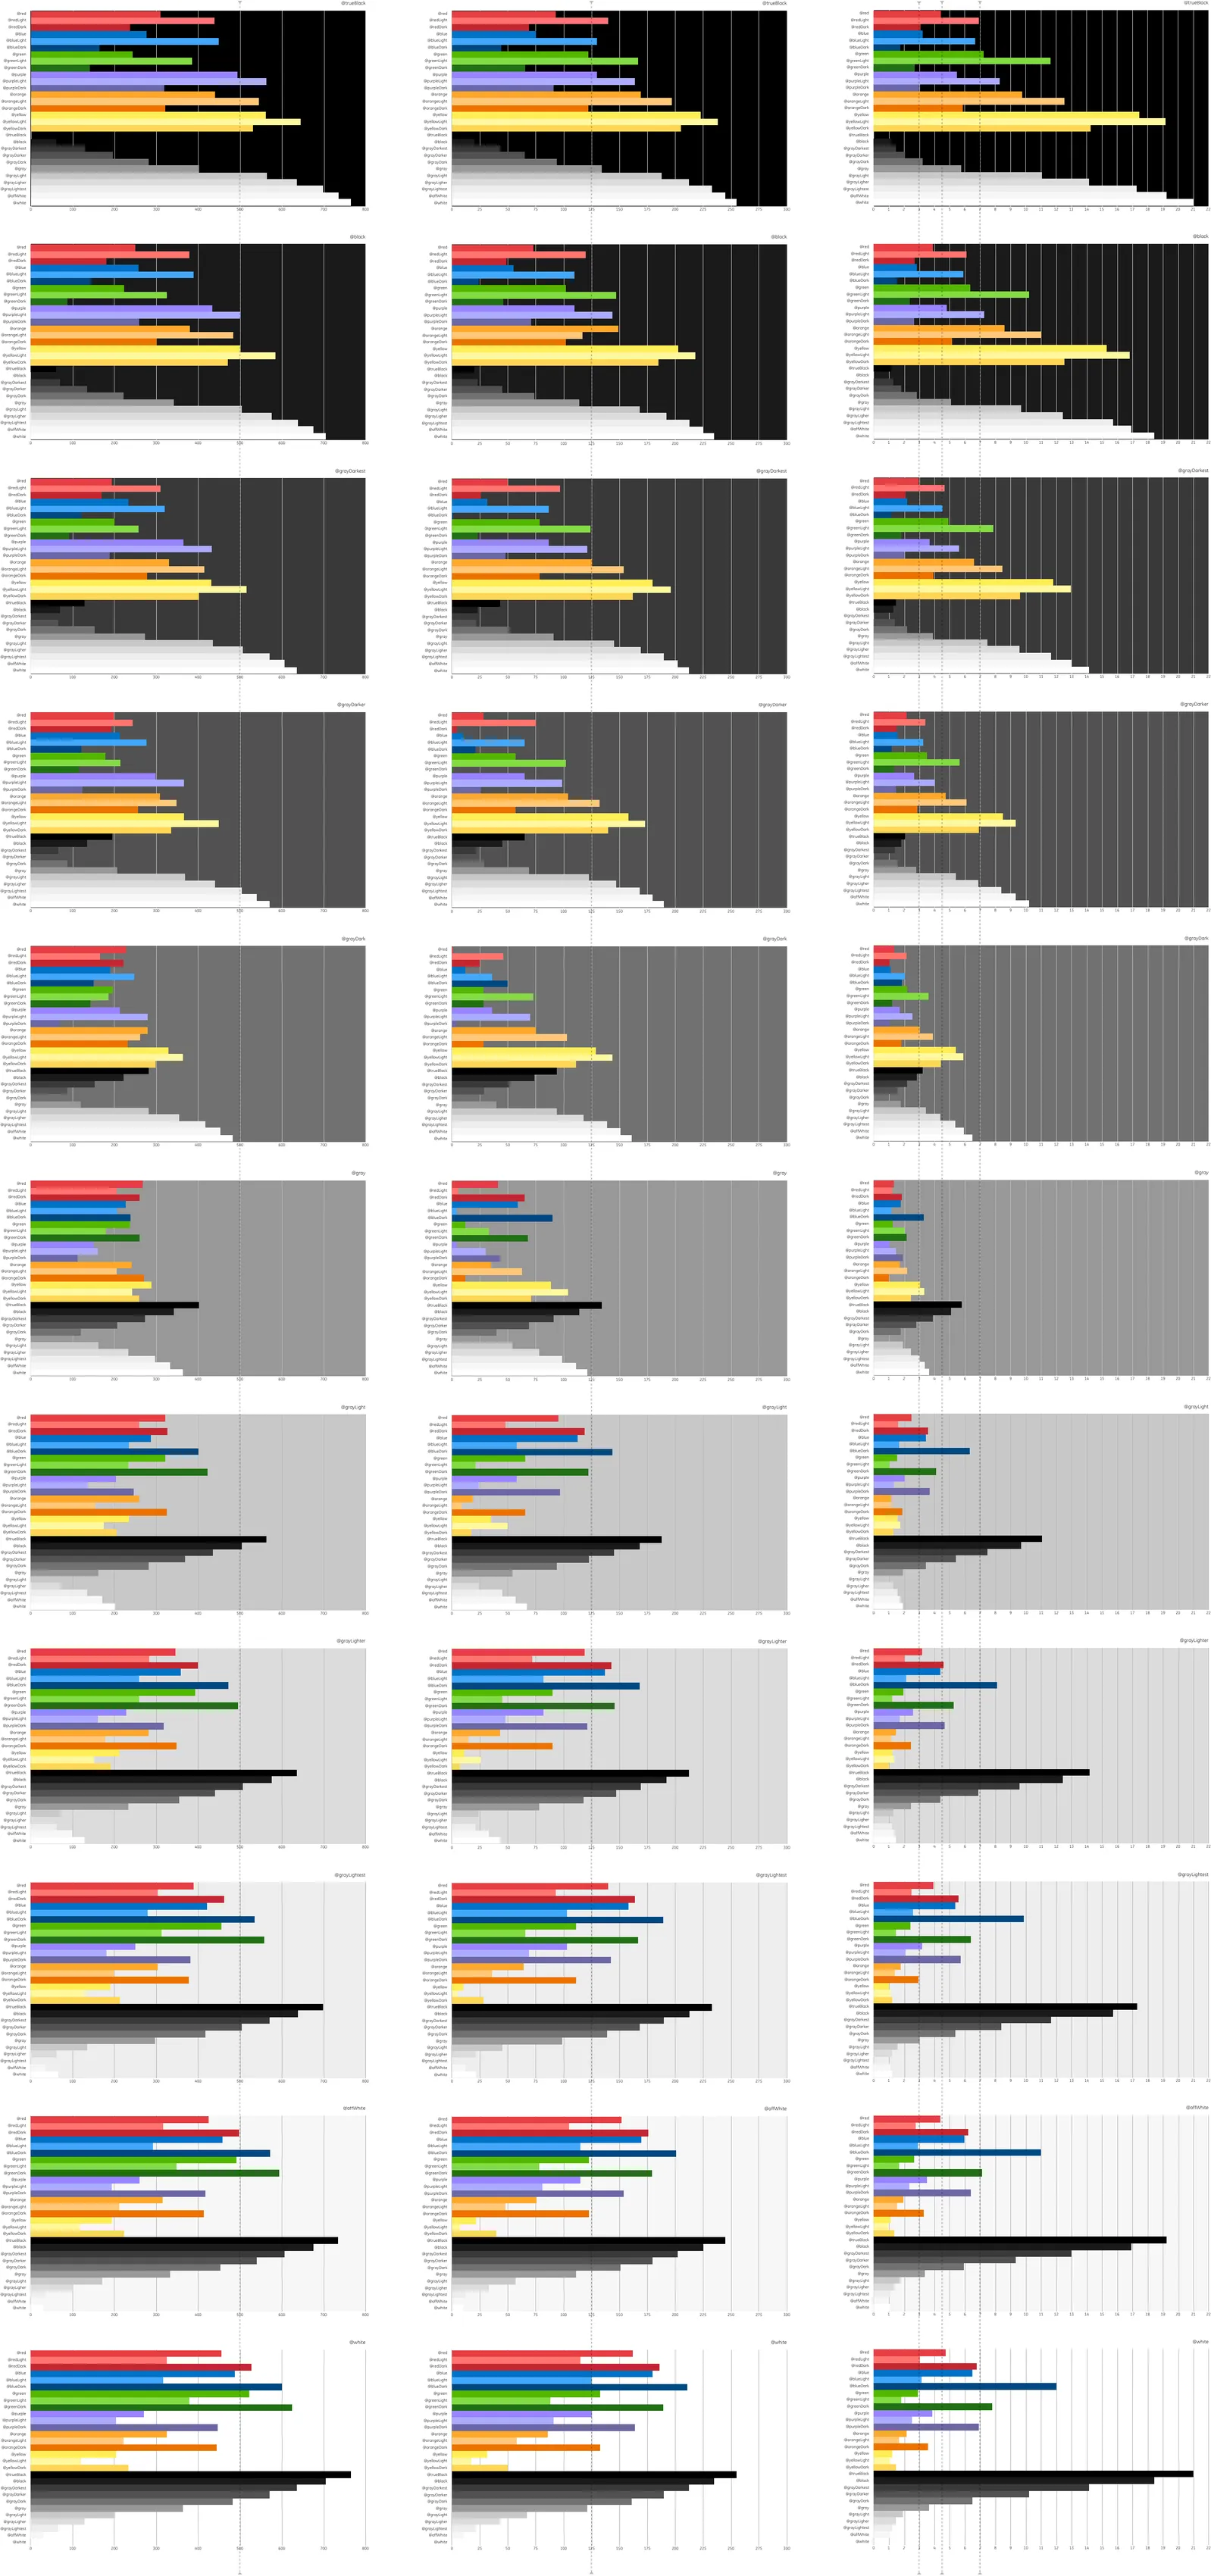
A chart testing the palette's reds, blues, greens, purples, oranges, yellows, and grays against eleven backgrounds from black to white, by color difference, brightness difference, and contrast ratio, beside one service portal design in its colors before an accessibility audit and in a brighter set after it. The definitions beneath give the thresholds: a color difference above 500, a brightness difference above 125, and contrast of at least 4.5:1 (AA) or 7:1 (AAA) for text under 18pt.
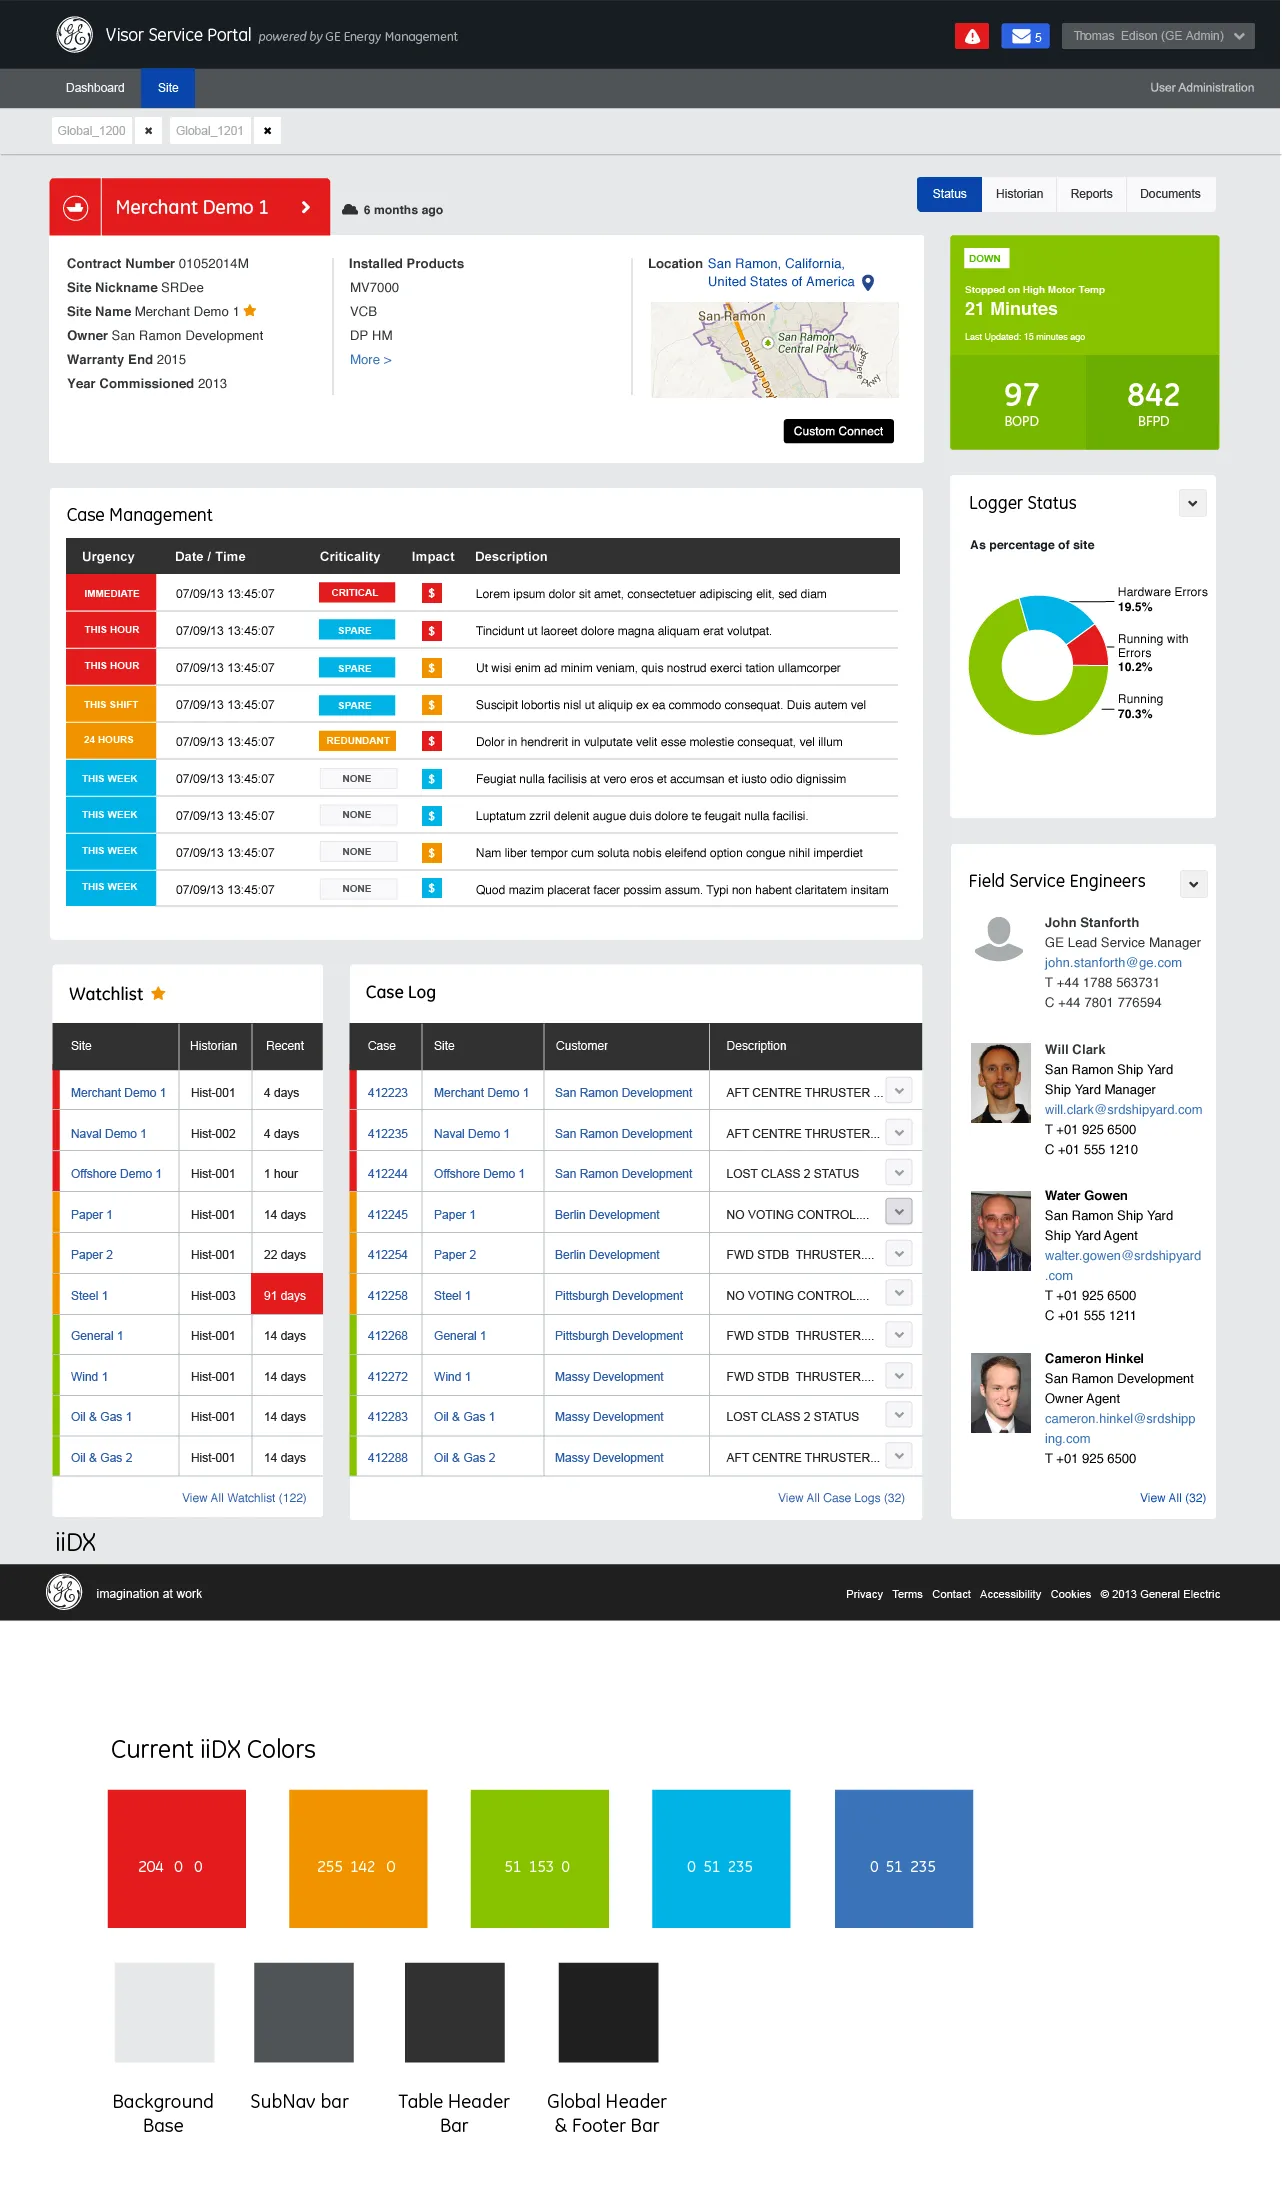
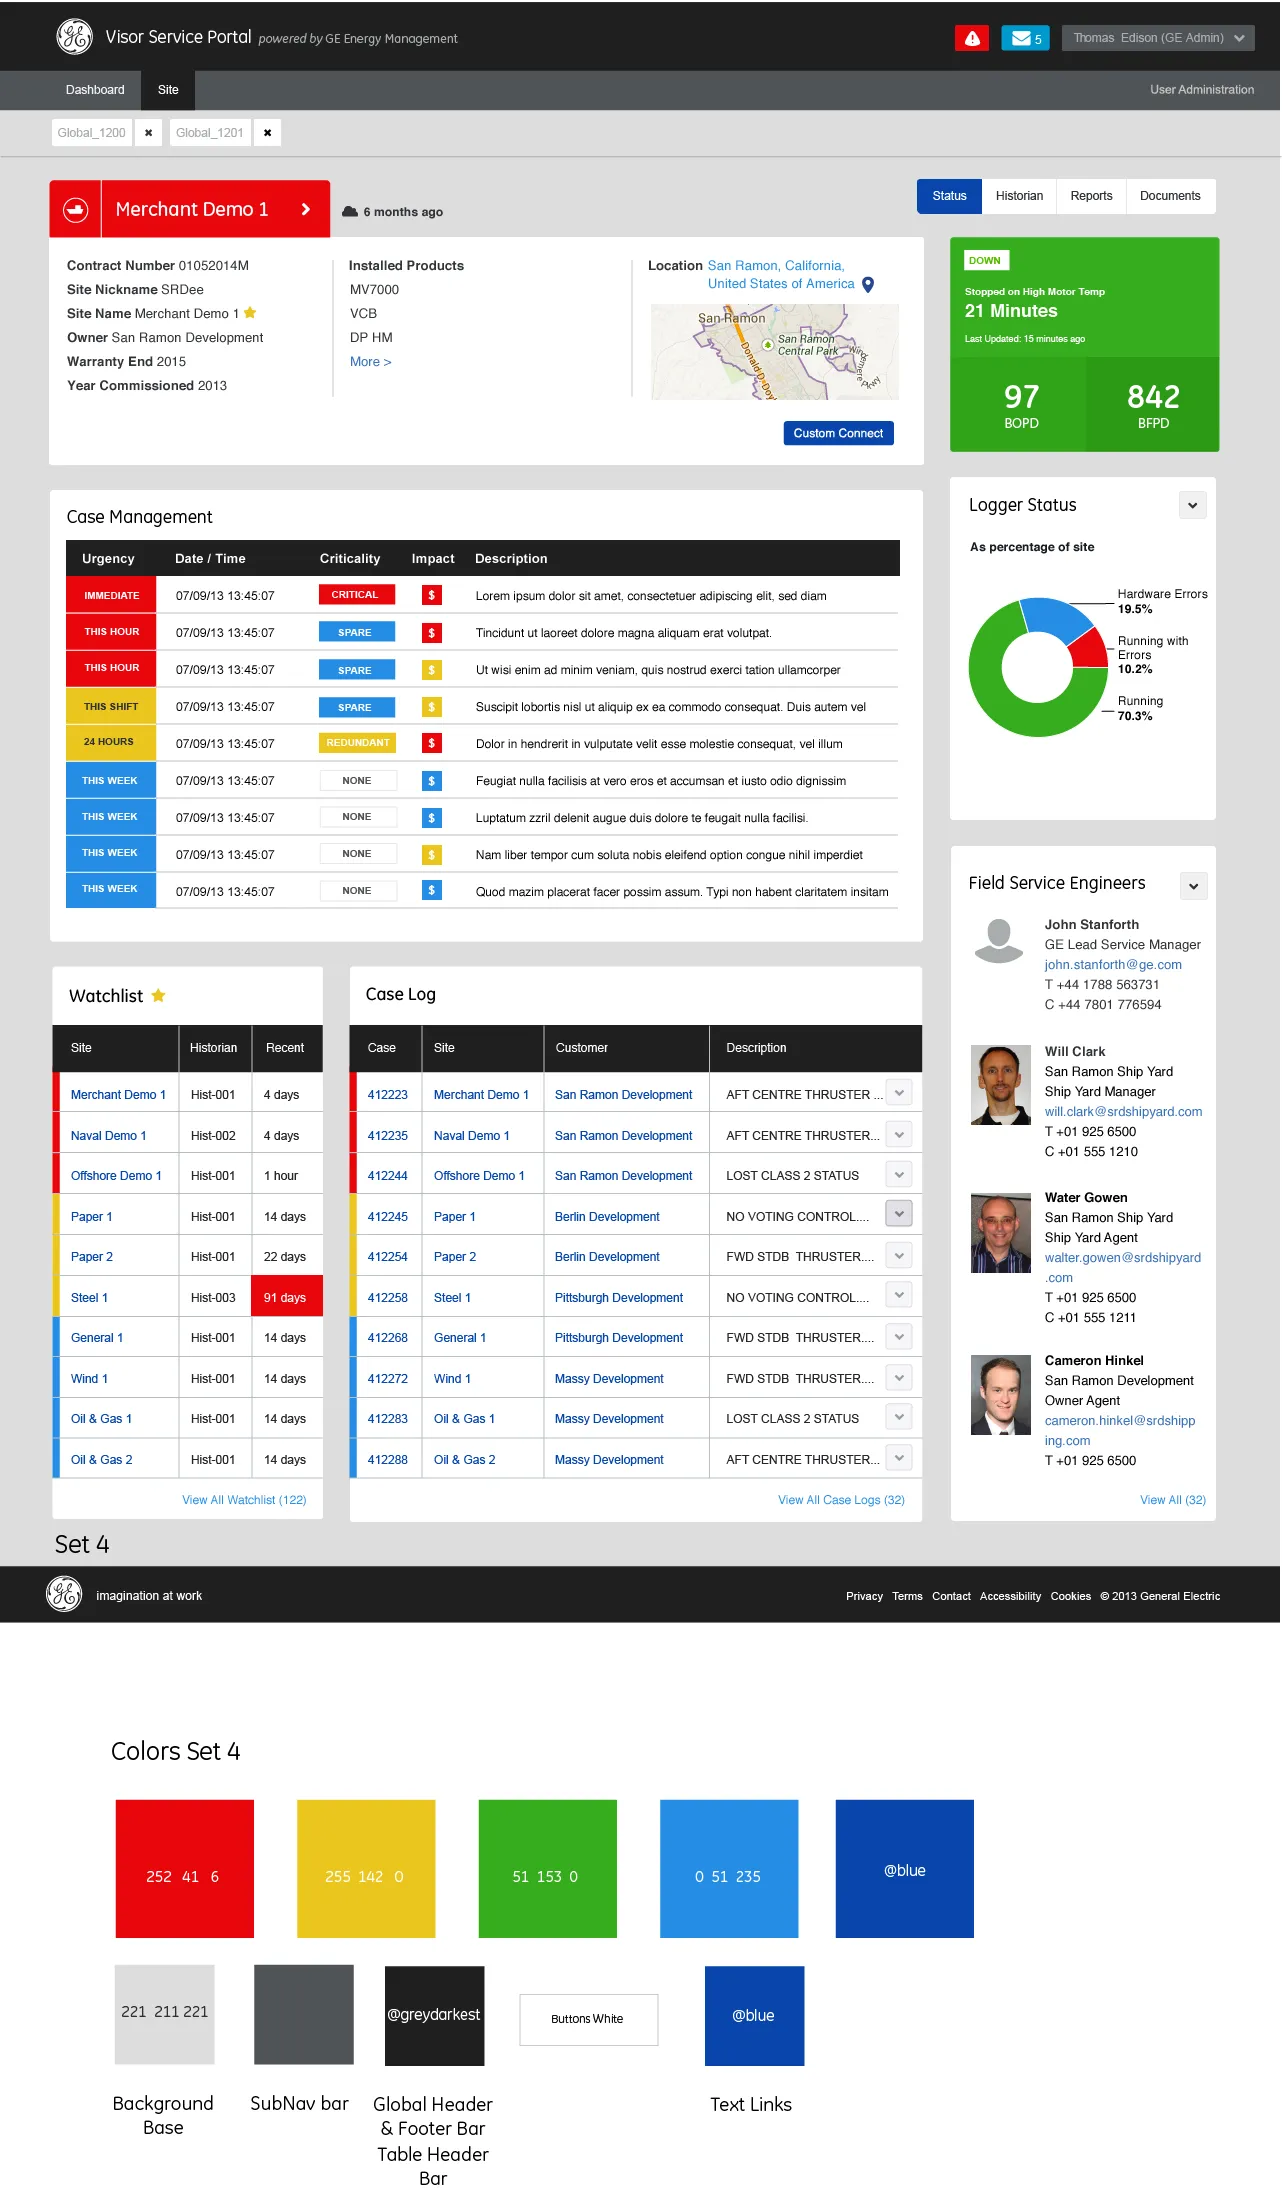
Color
Color difference between foreground and background. >500 is ideal.
Brightness
Brightness difference between foreground and background. >125 is ideal.
Contrast
Contrast difference between foreground and background. Minimum (AA) 4.5:1 for <18pt text, 3:1 for >18pt text or 14pt bold. Enhanced (AAA) 7:1 for <18pt text, 4.5:1 for >18pt text or 14pt bold.
User management
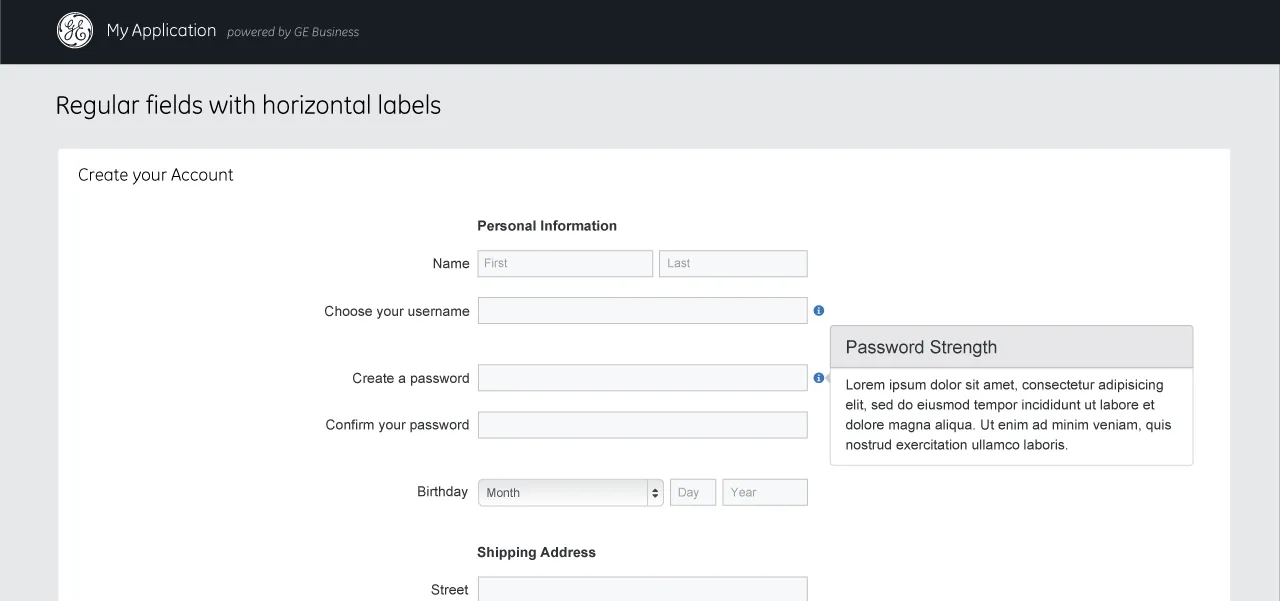
An outline of a standard user management flow, numbered wireframe views in rows for invite, entry, app, view, edit, add, and delete, with a legend and design notes, beside two finished screens, a Predix Asset sign-in and a create-account form with a password strength tip. I outlined the flow with the content and affordances for each section, then worked with a visual designer to realize it as reference design.
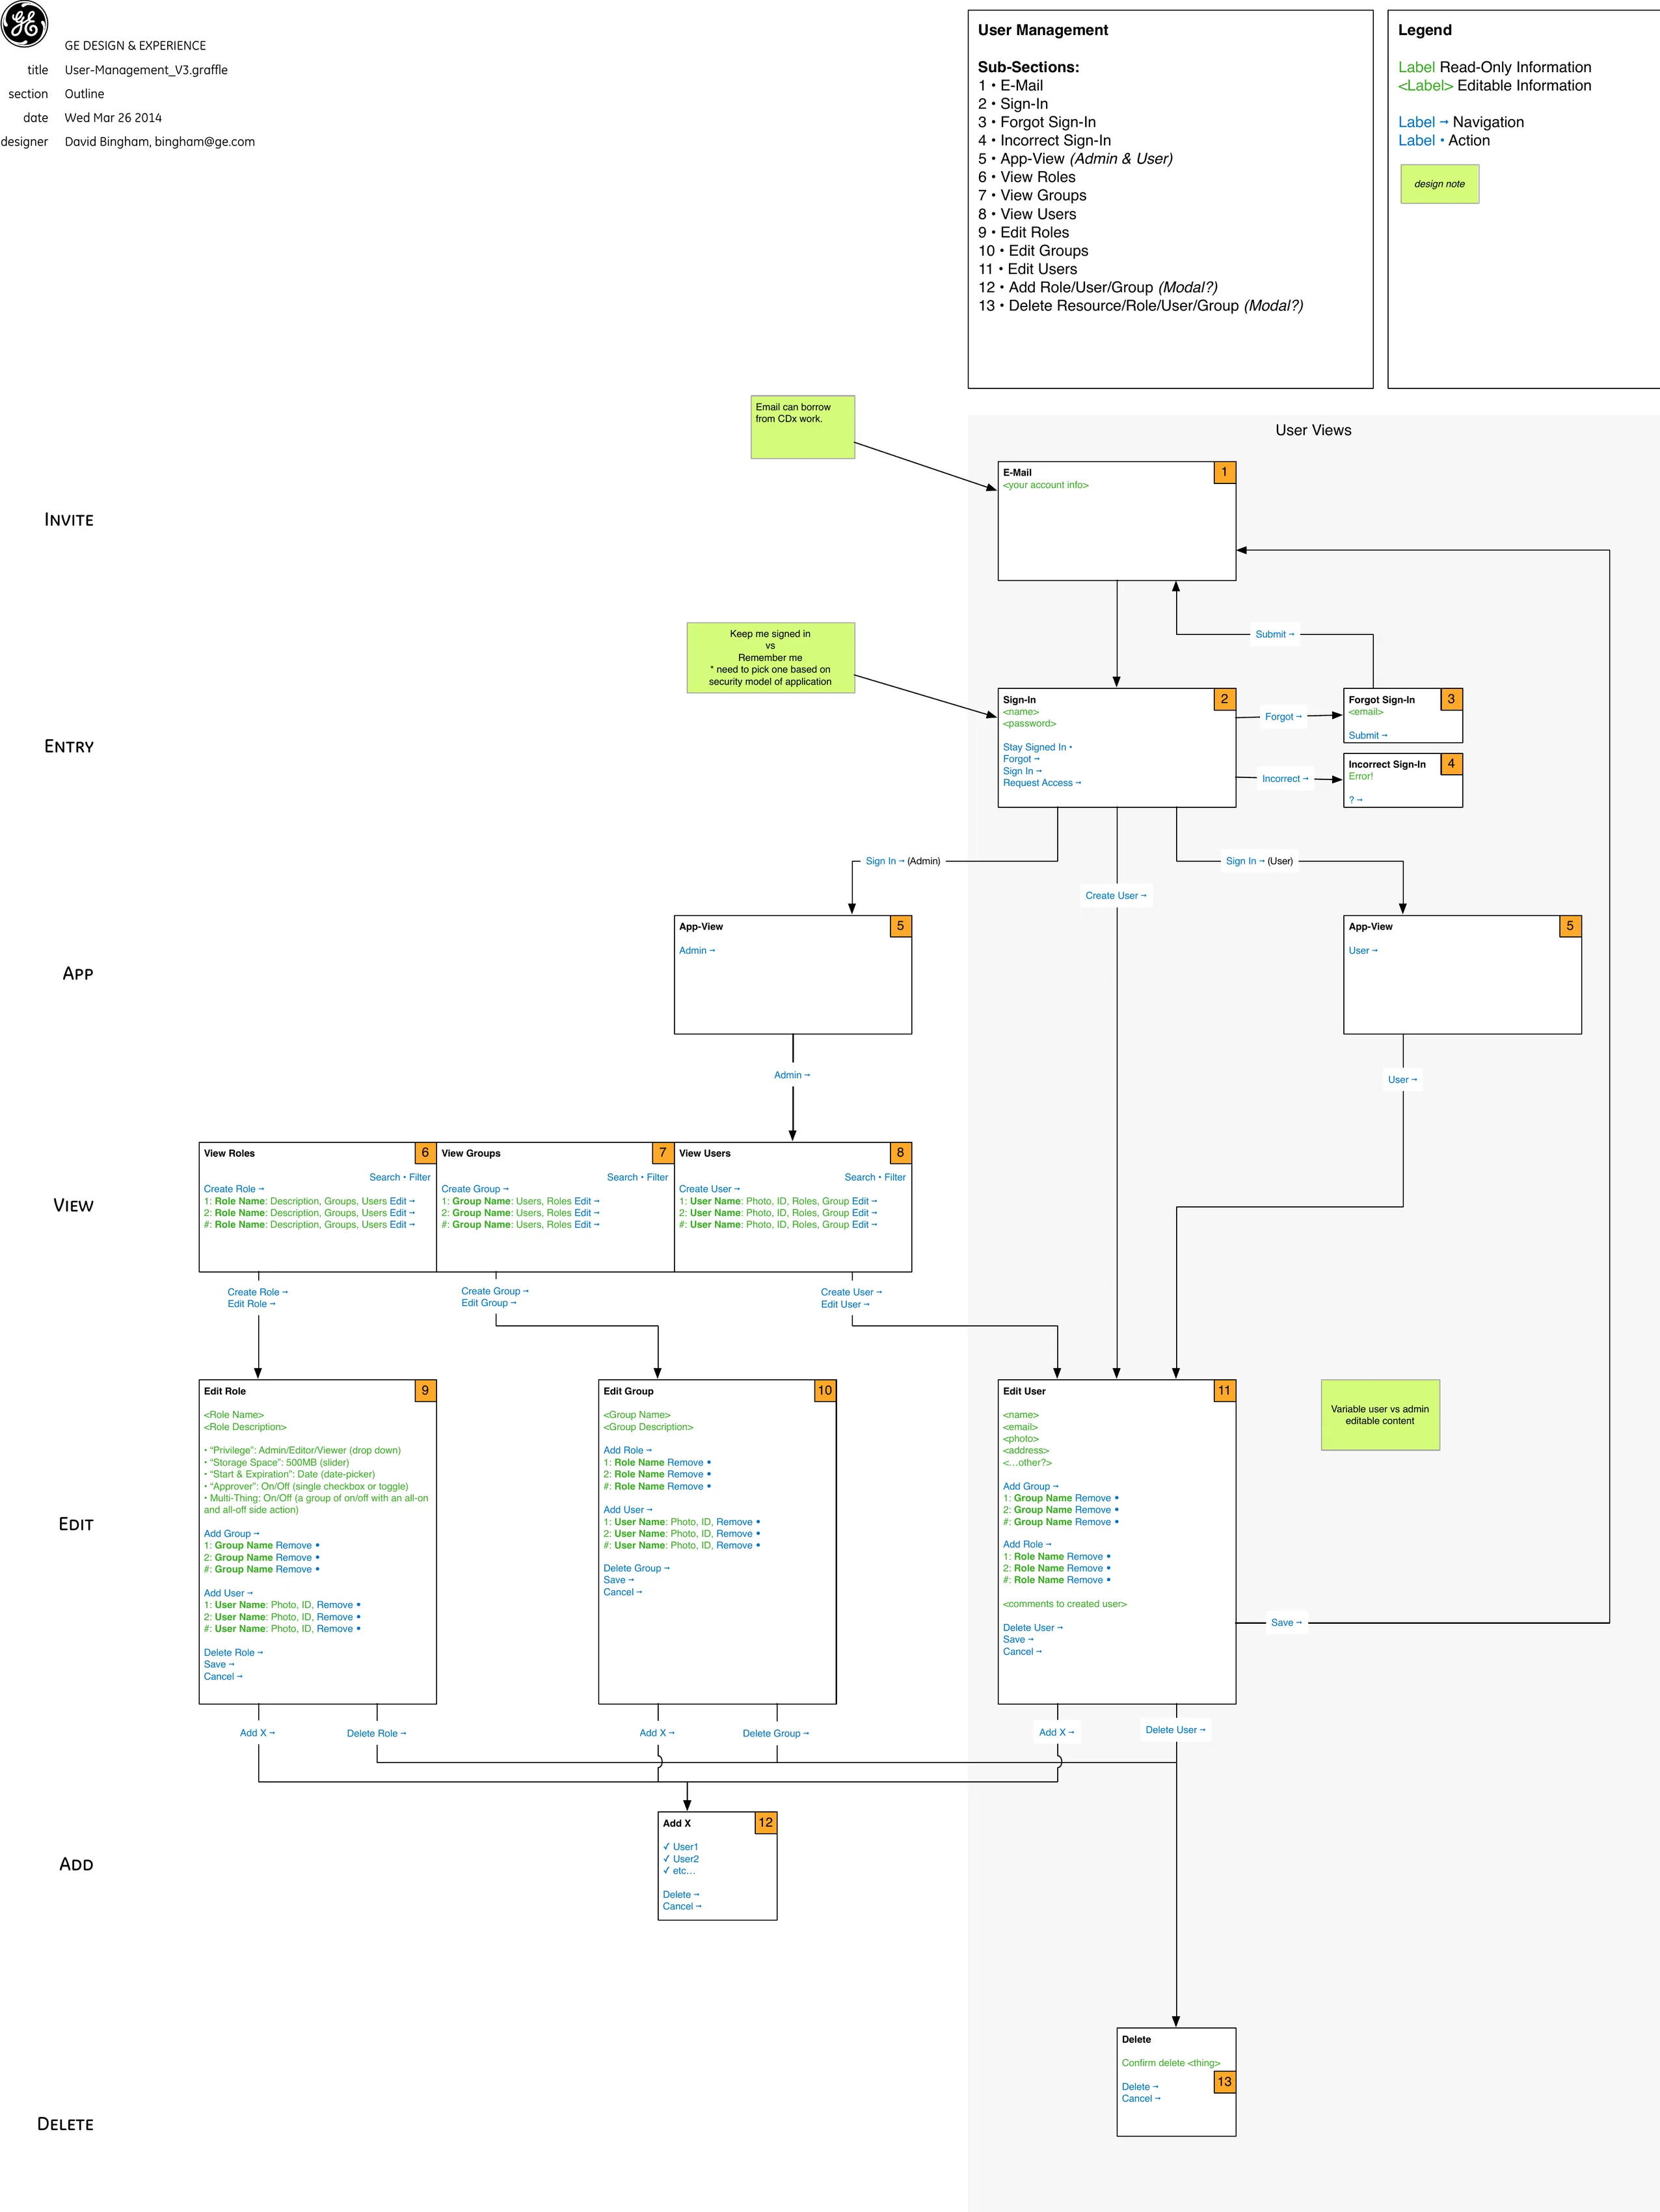
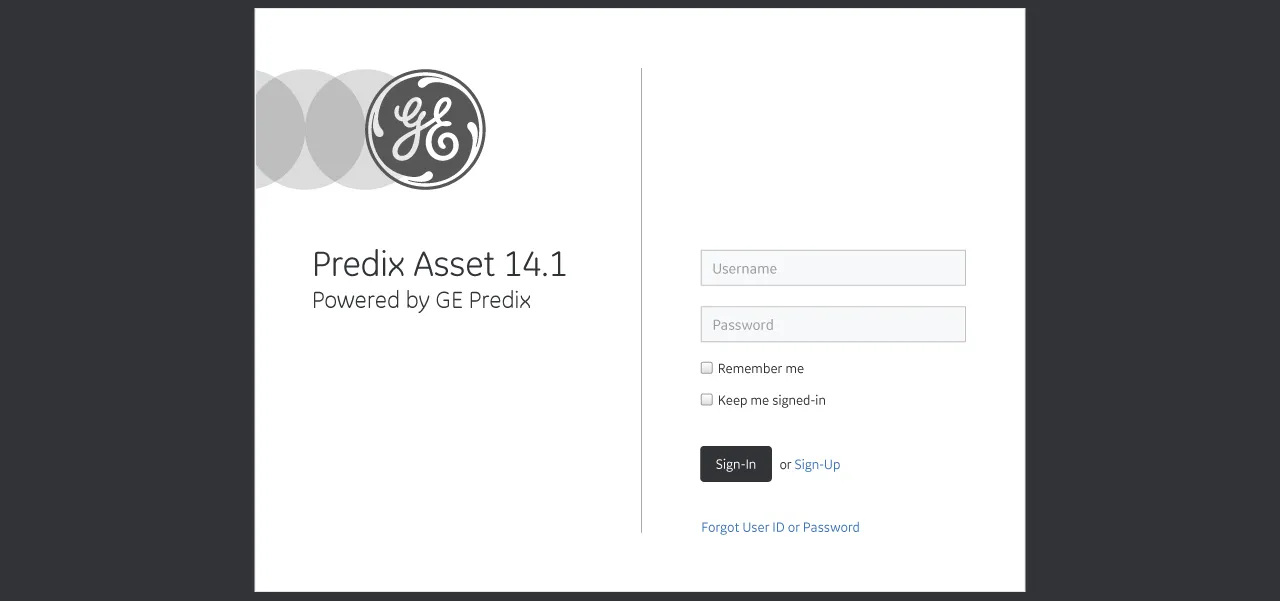
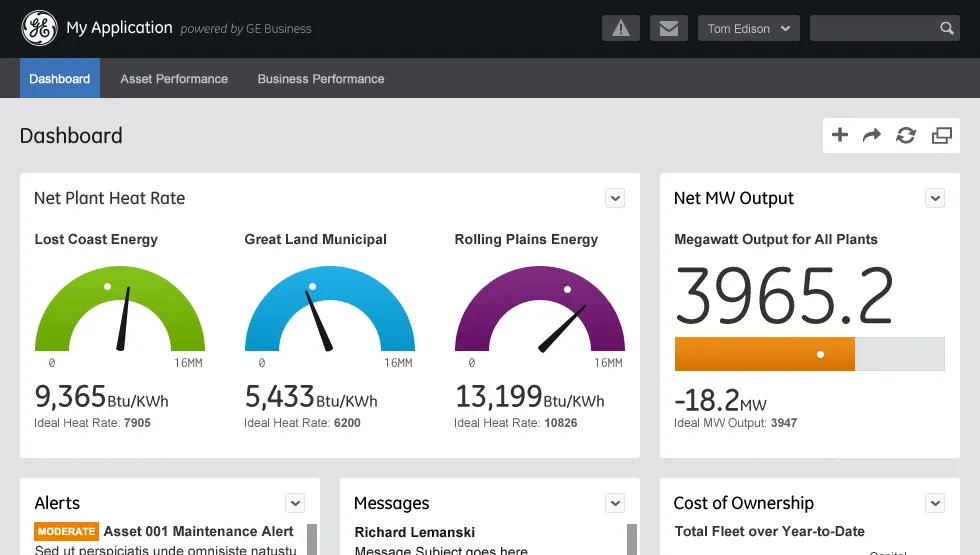
Reference design
The reference design's dashboard under a My Application header: net plant heat rate gauges for three plants, a net megawatt output readout, and alerts, messages, and cost of ownership panels. It shows the system's components assembled into one application screen, built to demonstrate the system rather than to ship.
Software design hub
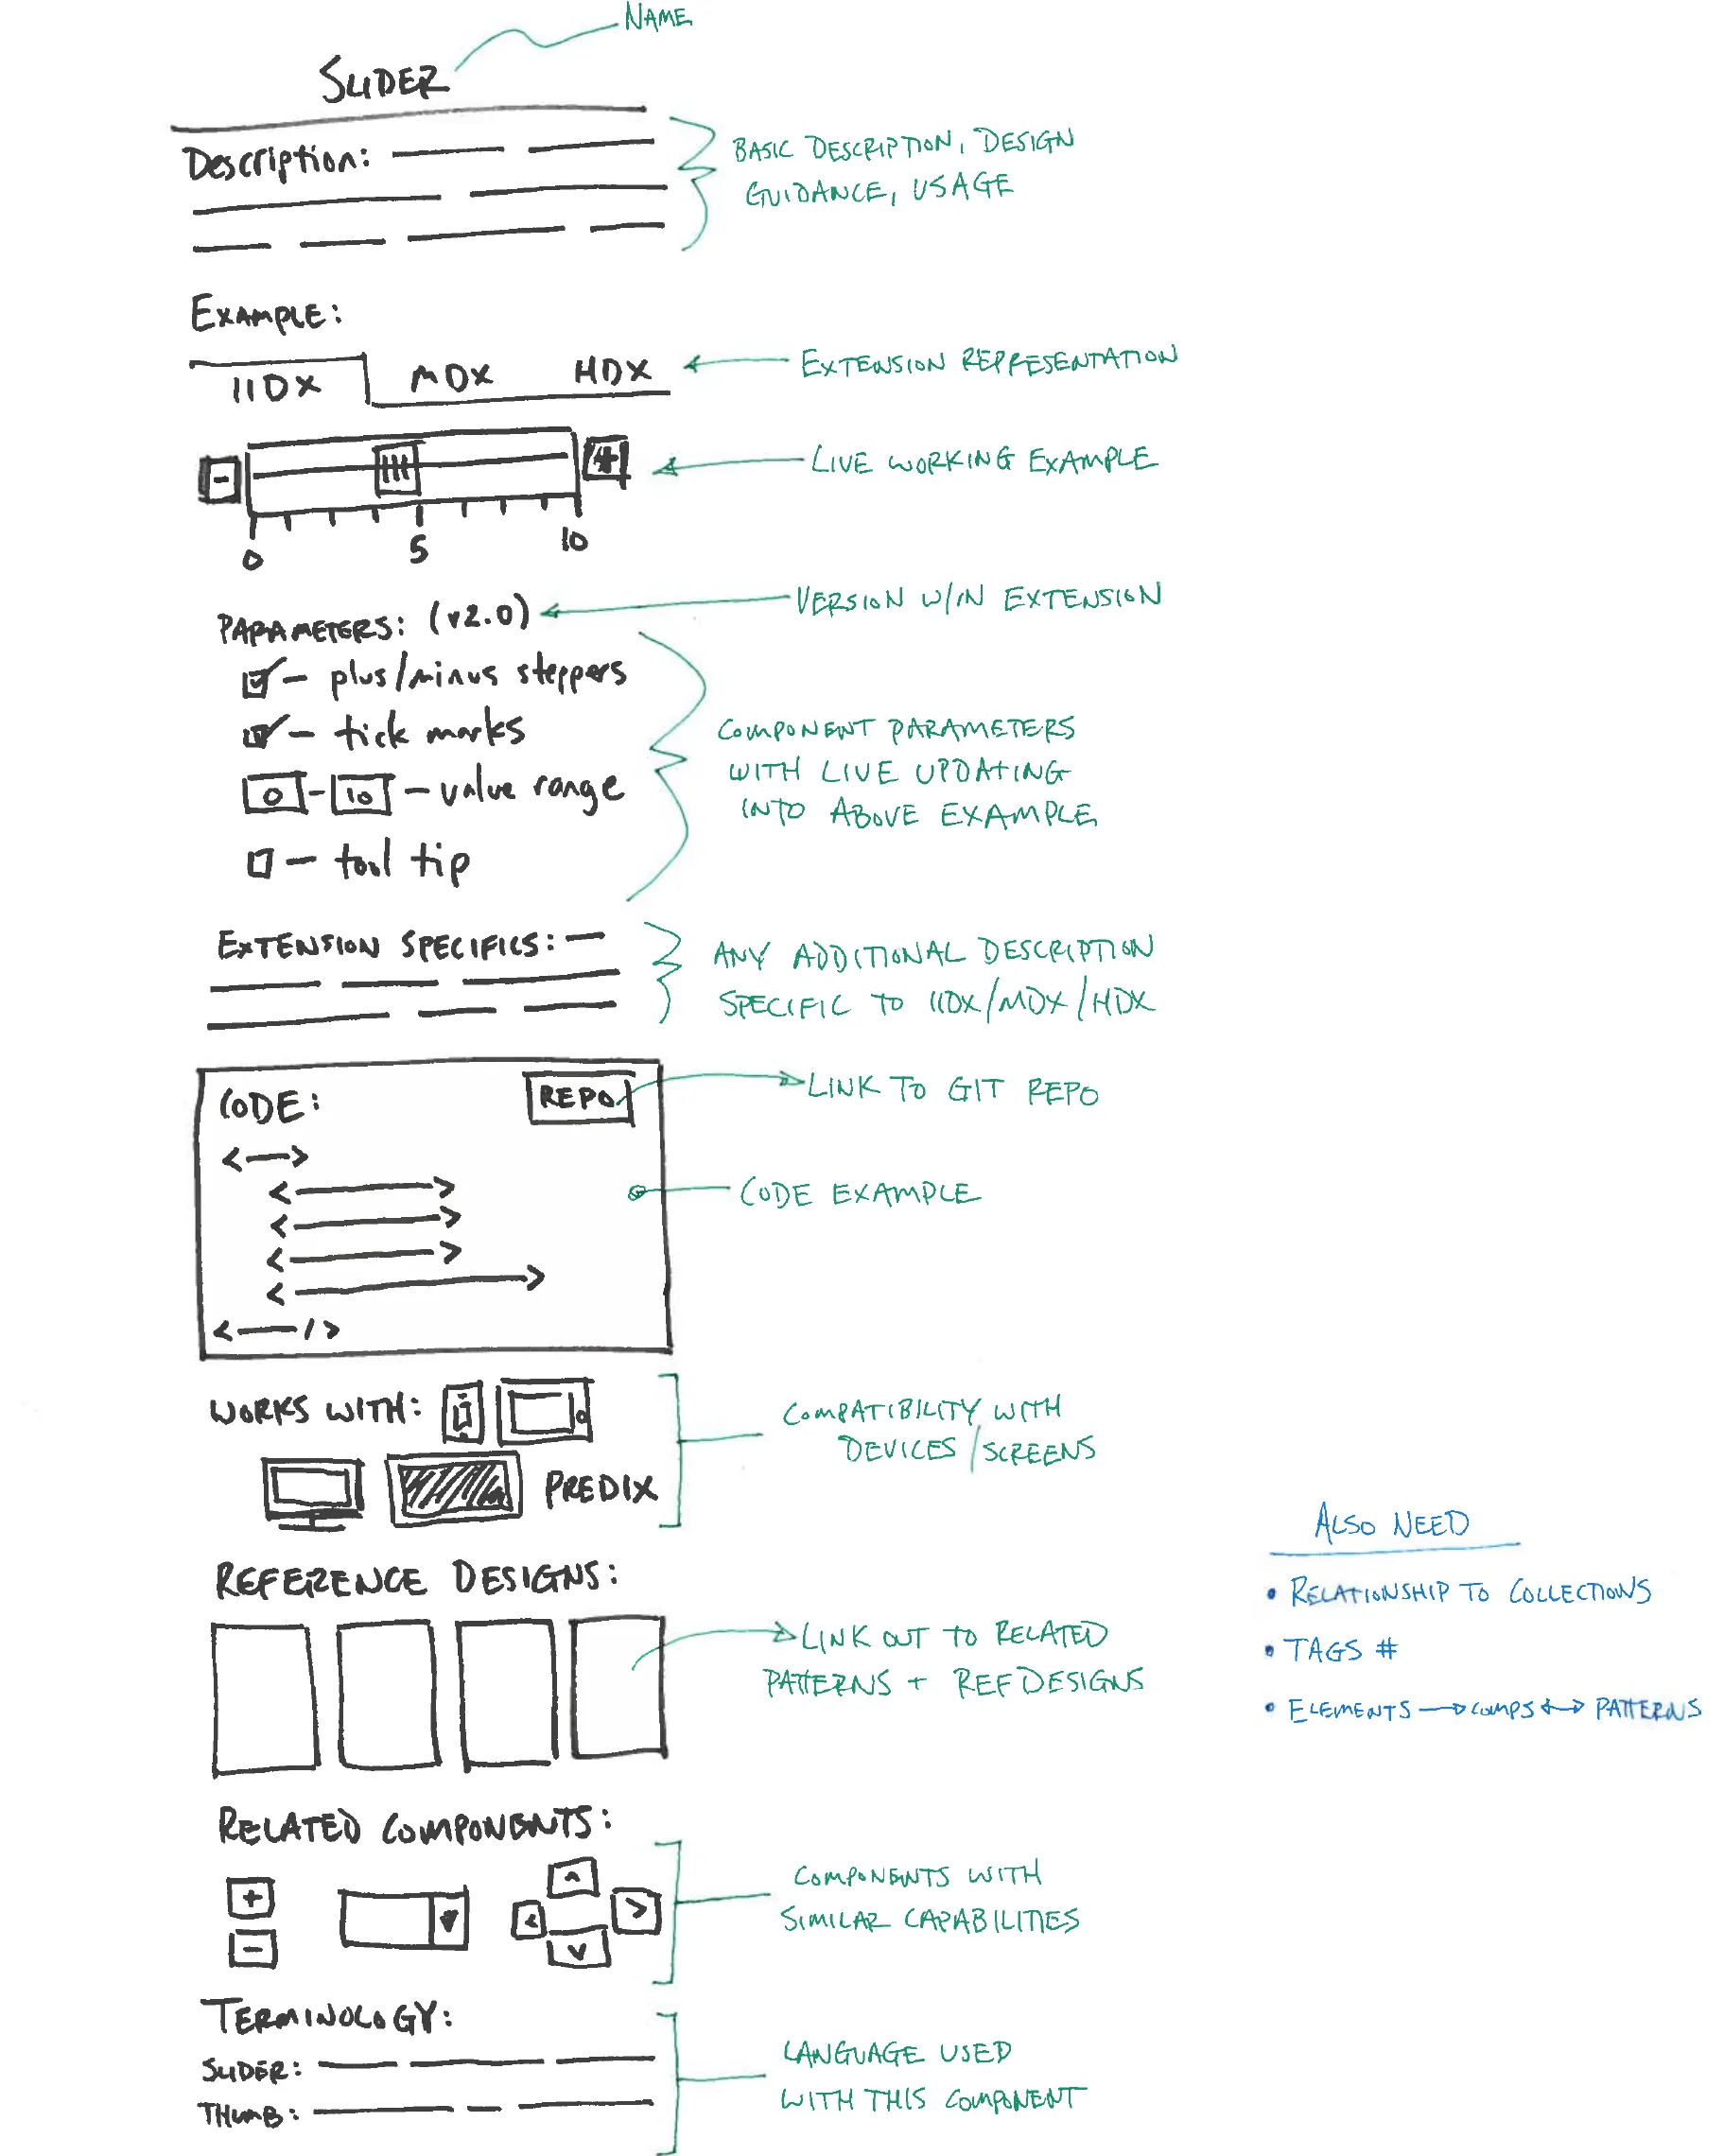
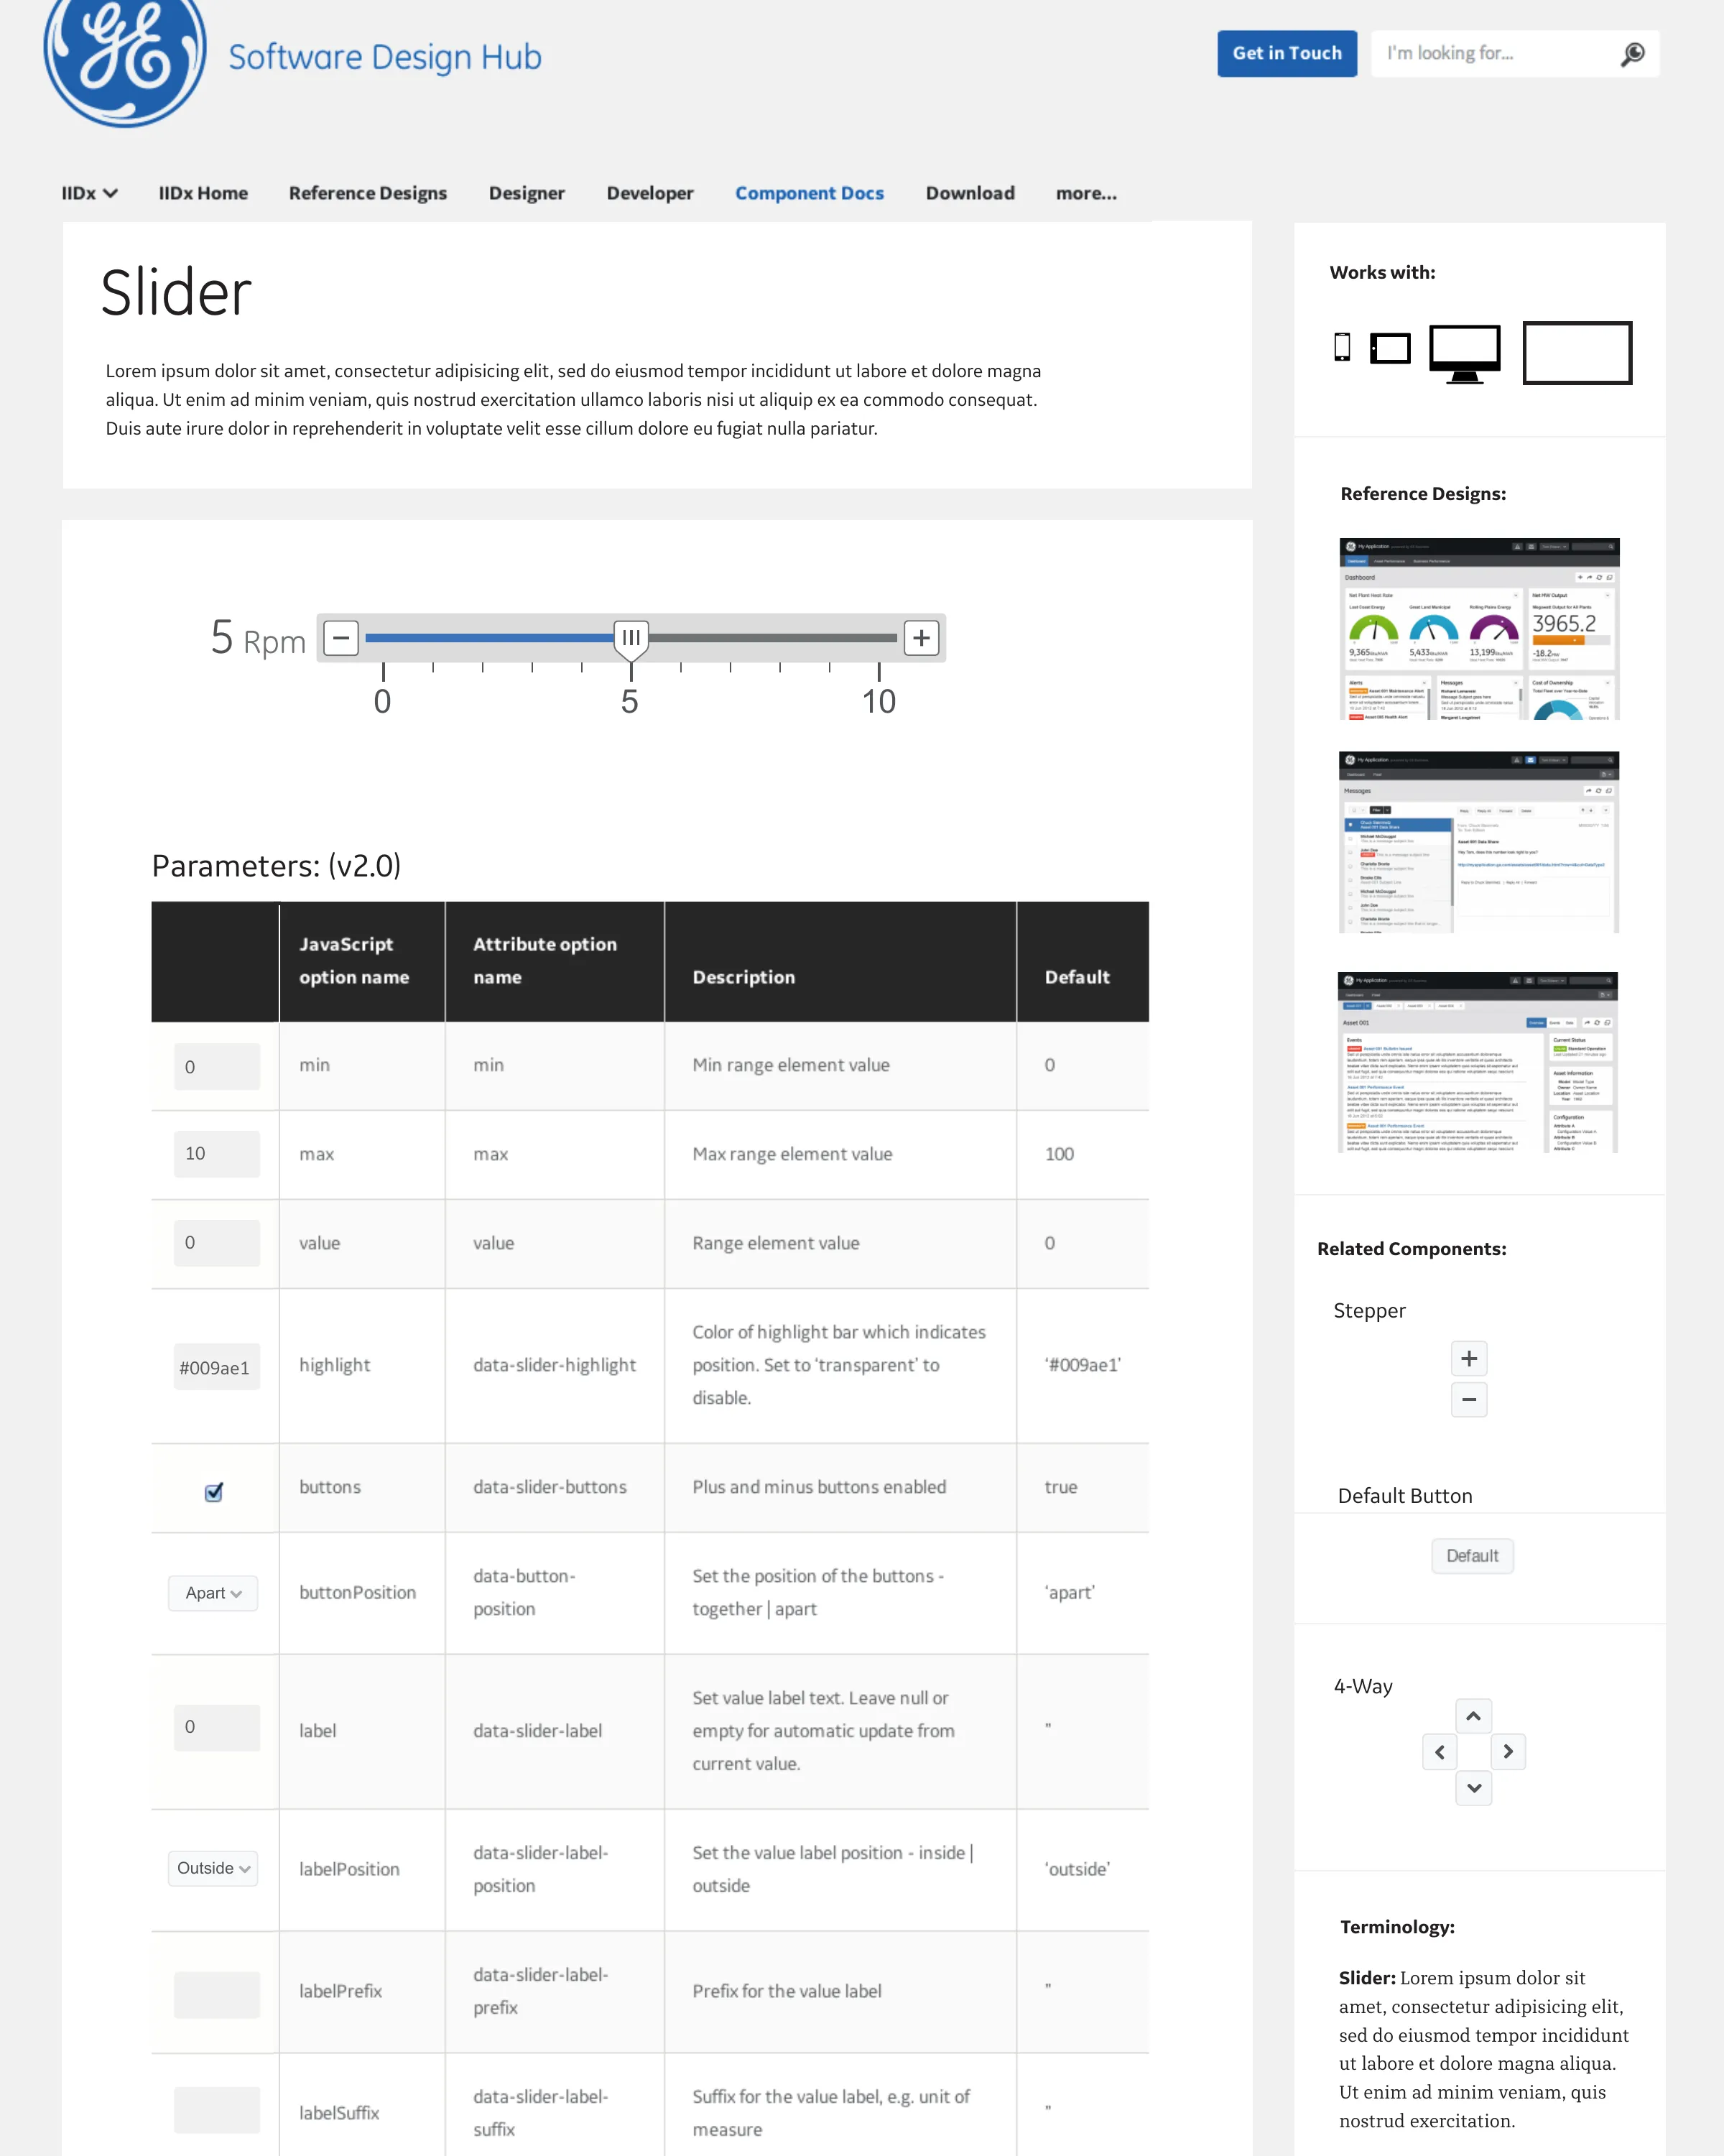
A pen sketch of a component spec page for a slider, the Slider page as built on the Software Design Hub, and the Hub's home page with cards for the IIDx, MDx, and HDx design extensions. The Hub was the system's guide to component documentation and reference designs, with principles, guidelines, and stencils for designers, frameworks and docs for developers, and case studies and reference designs for managers; I designed its spec pages and navigation.
- Designers: Principles, guidelines, & stencils.
- Developers: Technology frameworks & docs.
- Managers: Case studies & reference designs.
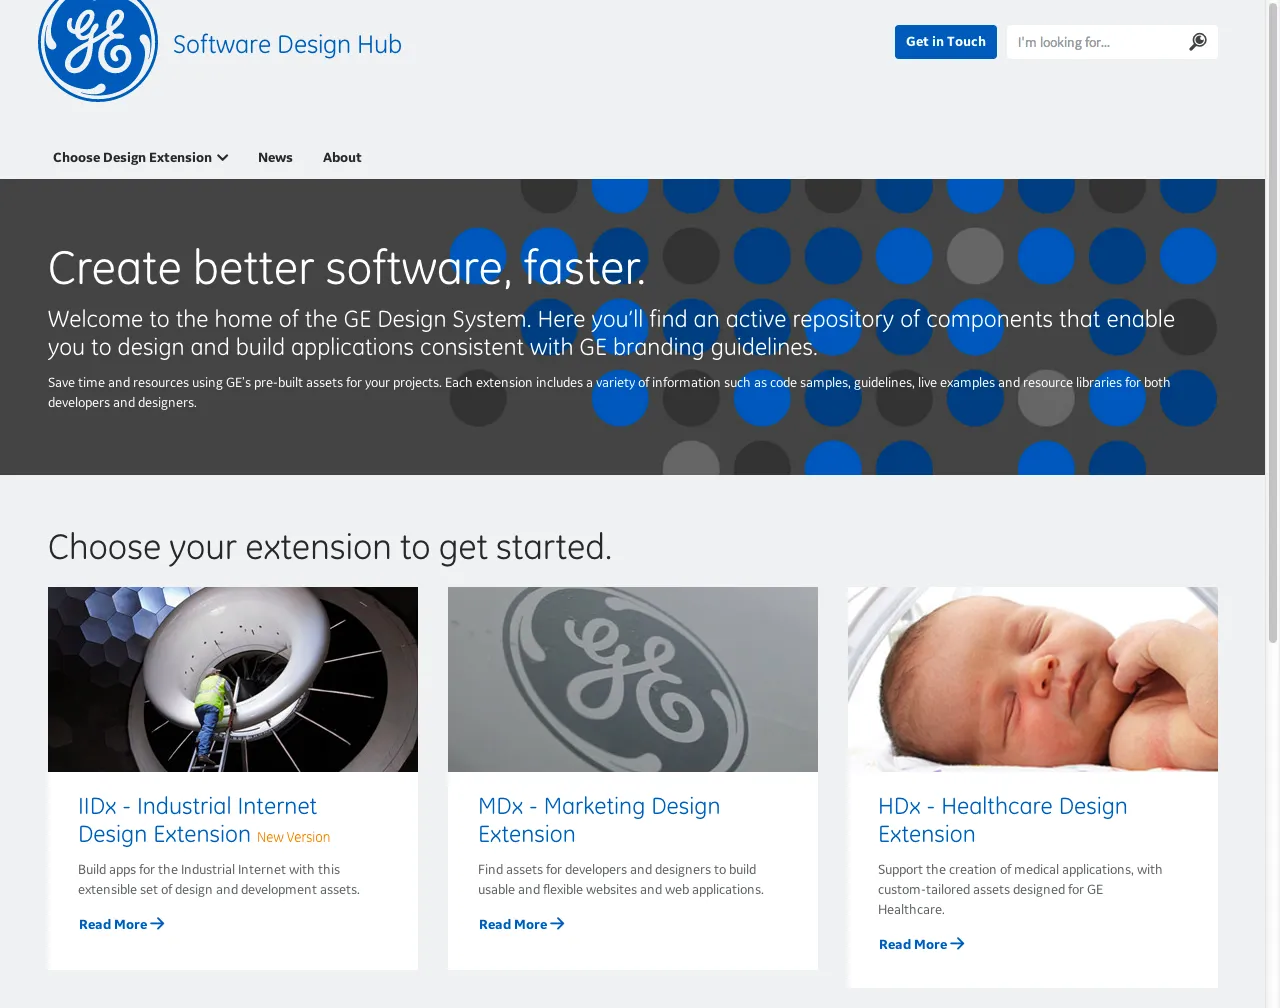
The Software Design Hub offers design system users a guide to component documentation and reference designs. I designed the site’s spec pages and user navigation across the corpus.
AI usage
2, Ideas. AI helped with research, sources, brainstorming or structure. I wrote every word.The tiers